Работа завершена
Техническое задание
The indicator, when applied to a chart will give buy and sell signals as well as draw indicating arrows/trend lines on the chart.
Suppose there are 2 candles A and B. Candle A is followed by Candle B.
For example, when applied to a 5 min chart, indicator will give a BUY signal when these 4 conditions are fulfilled.
Condition 1: Candle A has a longer wick than the body of candle A.
Condition 2: Body of candle A is engulfed by the body of candle B (Bullish Engulfing).
Condition 3: Candle A and Candle B form a tweezer bottom i.e. (opening price of candle B is equal to closing price of candle A).
Condition 4: Candle A is a bearish candle and Candle B is a bullish candle.
Similarly, the indicator will generate a SELL signal when these 4 conditions are fulfilled.
Condition 1: Candle A has a longer wick than the body of candle A.
Condition 2: Body of candle A is engulfed by the body of candle B (Bearish Engulfing).
Condition 3: Candle A and Candle B form a tweezer top i.e. (opening price of candle B is equal to closing price of candle A).
Condition 4: Candle A is a bullish candle and Candle B is a bearish candle.
The indicator must have an input parameter named 'Minimum Wick To Body Size Ratio'. The default value of this parameter must be '1'.
When the parameter value is set to 1, the indicator will give a BUY/SELL signal only if the candle A has a wick size greater than 1 times of its body size.
When the parameter value is set to 2, the indicator will give a BUY/SELL signal only if the candle A has a wick size greater than 2 times of its body size.
Another input parameter will be 'Maximum Number of Candlesticks To Look Back'. Default value will be 1000. If value is set to 1000, it will indicate signals upto a 1000 candles back in time, on chart and so on.
Another input parameter will be 'Maximum Tolerance in Tweezer Formation'. Default value will be 0. When the value is 0, the opening price of candle B has to be exactly equal to the closing price of candle A and there should not a difference of even the last digit in a 4-digit (or 5 digit) price feed. When value is set to 1, there can be a difference of maximum 1 unit, if set to 5, there can be a difference of 5 digits.
For example, if value is 0 and closing price of candle A is 1.18101, then opening price of candle B must be 1.18101 for the indicator to generate a BUY/SELL signal.
If value is 5 and closing price of candle A is 1.18101, then opening price of candle B can be between (1.18096-1.18106), both values inclusive, for the indicator to generate a BUY/SELL signal.
In 4 digit pricing, if value of parameter is 5 and closing price of candle A is 1.1810, then opening price of candle B can be between (1.1805-1.1815), both values inclusive, for the indicator to generate a BUY/SELL signal.
Definition of Engulfing
Engulfing has got many different forms, but for the sake of this indicator, bearish engulfing happens only when the opening price of candle B is equal to or higher than closing price of candle A and the closing price of candle B is equal to or lower than the opening price of candle A and bullish engulfing happens only when the opening price of candle B is equal to or lower than closing price of candle A and the closing price of candle B is equal to or higher than the opening price of candle A.
Requirements:
If the indicator is applied on m5 chart, it should indicate signals according to m5 chart candles. If we switch the timeframe to m1 or m15 or any other timeframe, it should then indicate the signals according to the candles of that timeframe and on that chart.
Indicator should send BUY and SELL alerts in MT4 (both sound and popup) so that user can know that there is a trade opportunity.
Indicator should not repaint its arrows, lines or indications.
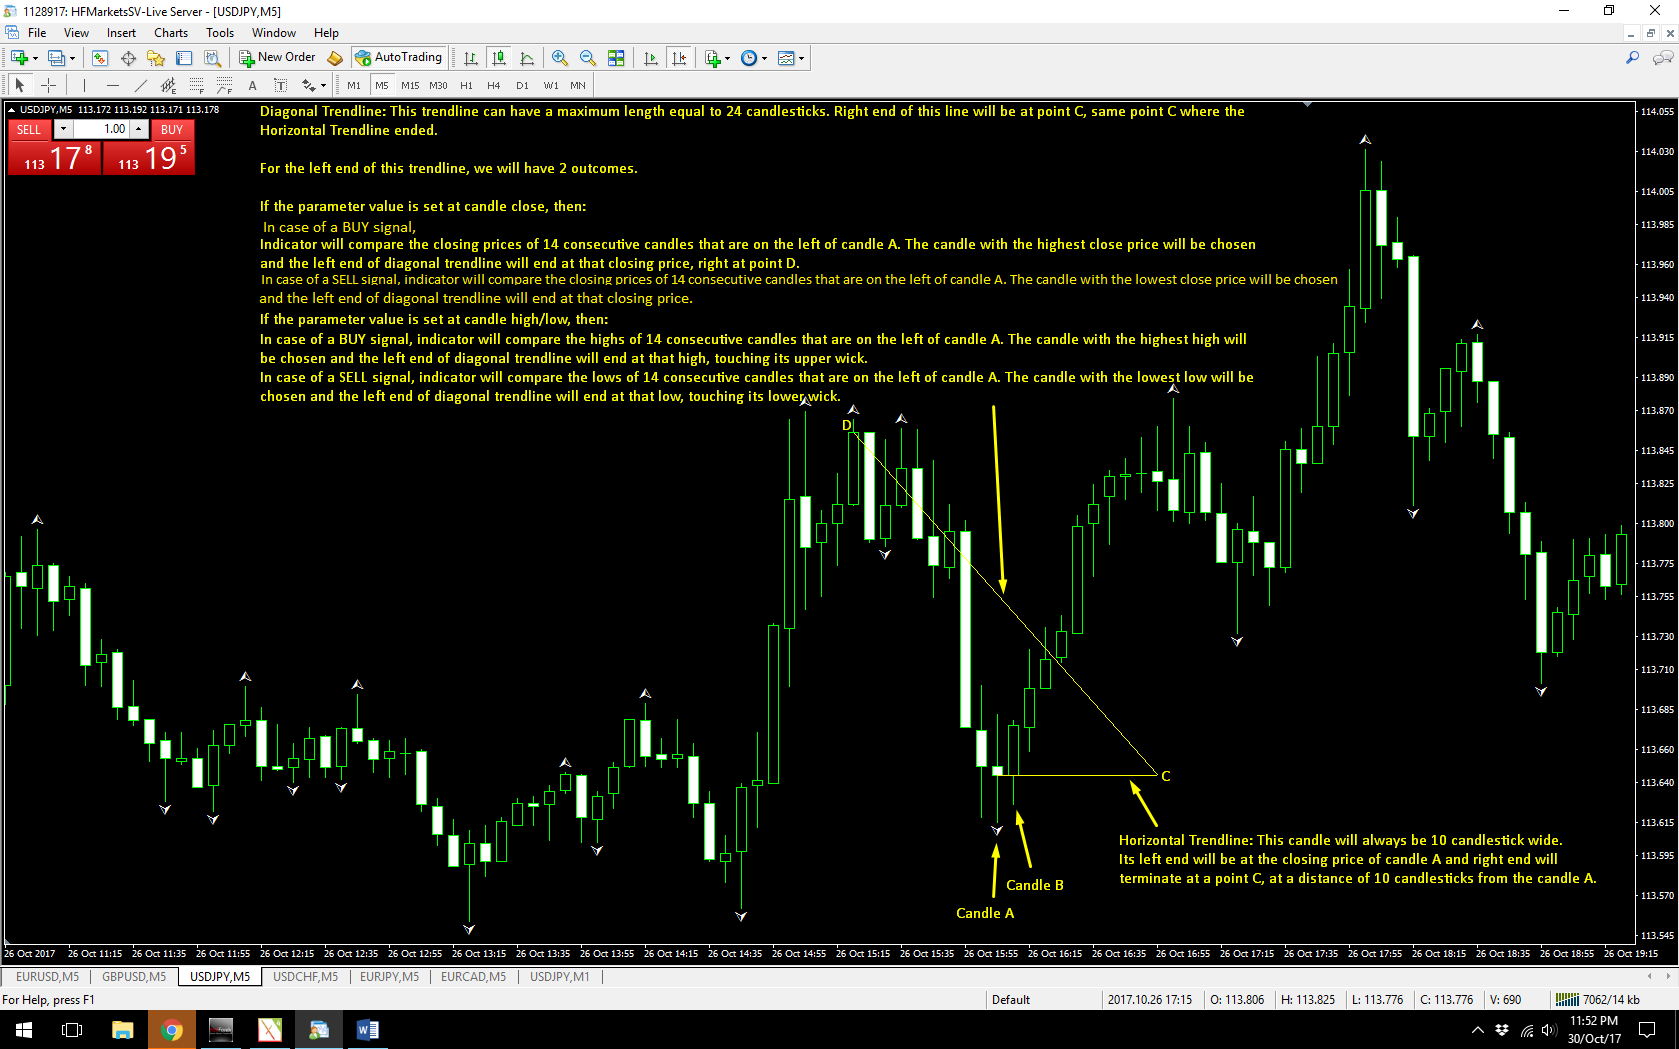
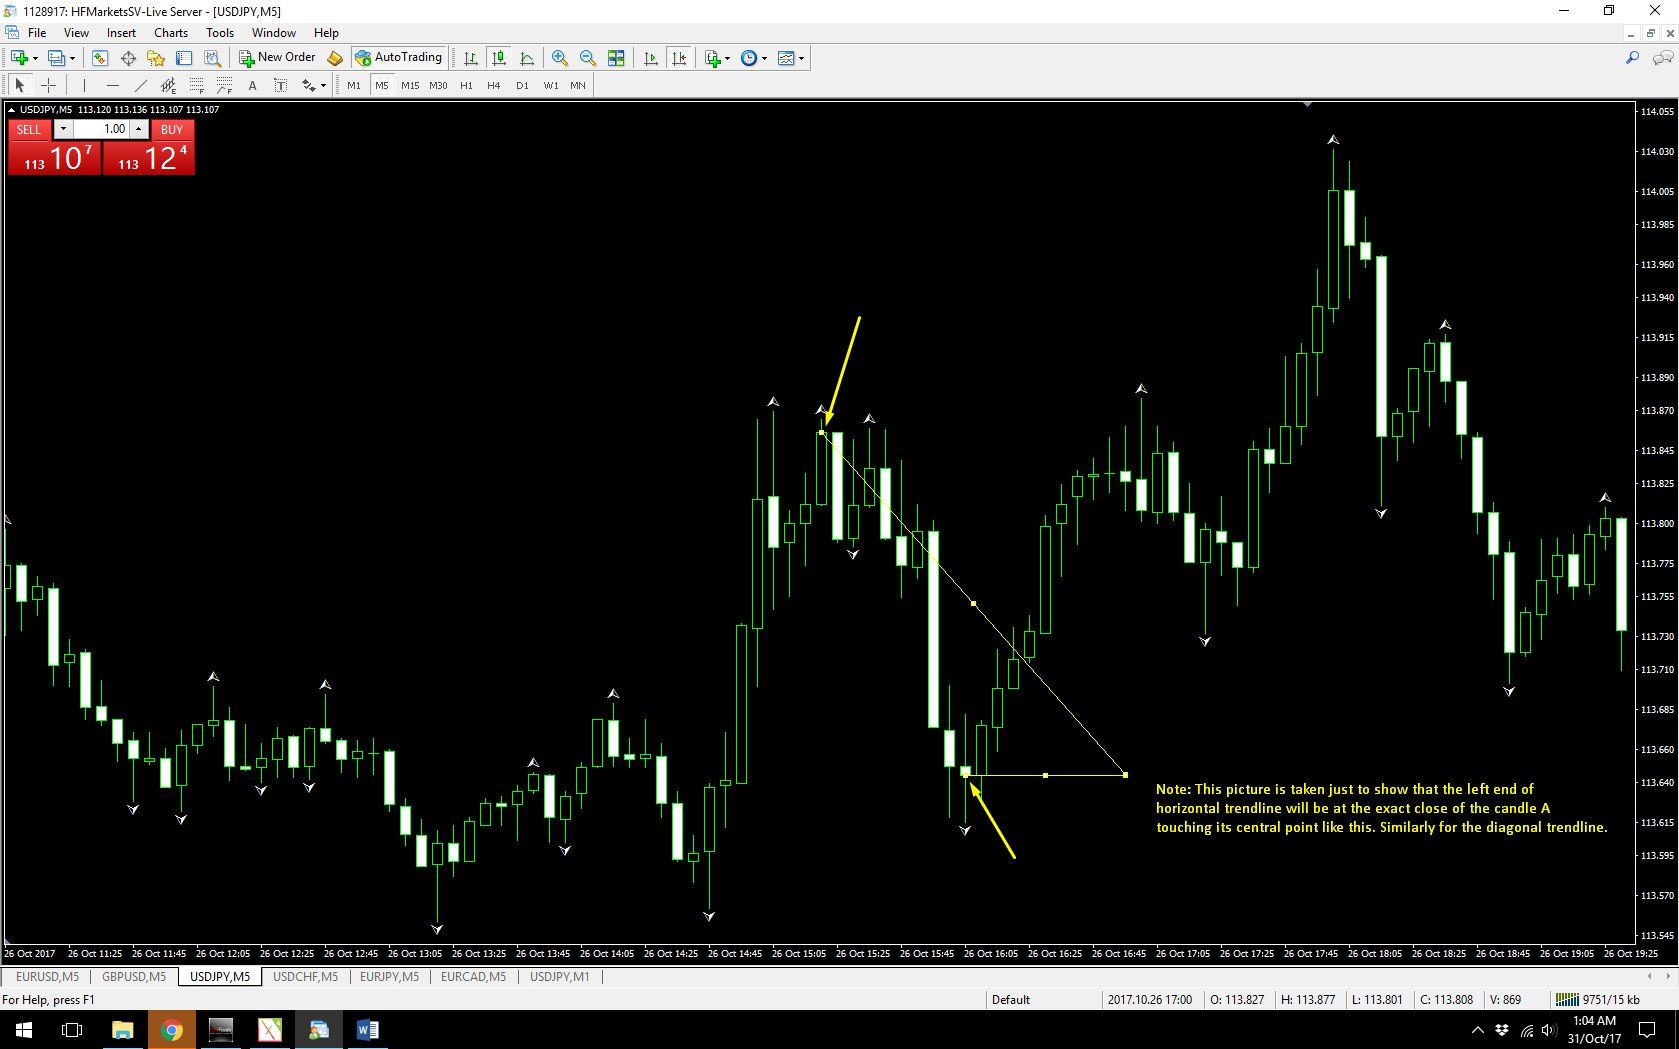
Please see the attached screenshot which shows that indicator should draw 2 trendlines; both in case of a BUY signal and in case of a SELL signal.
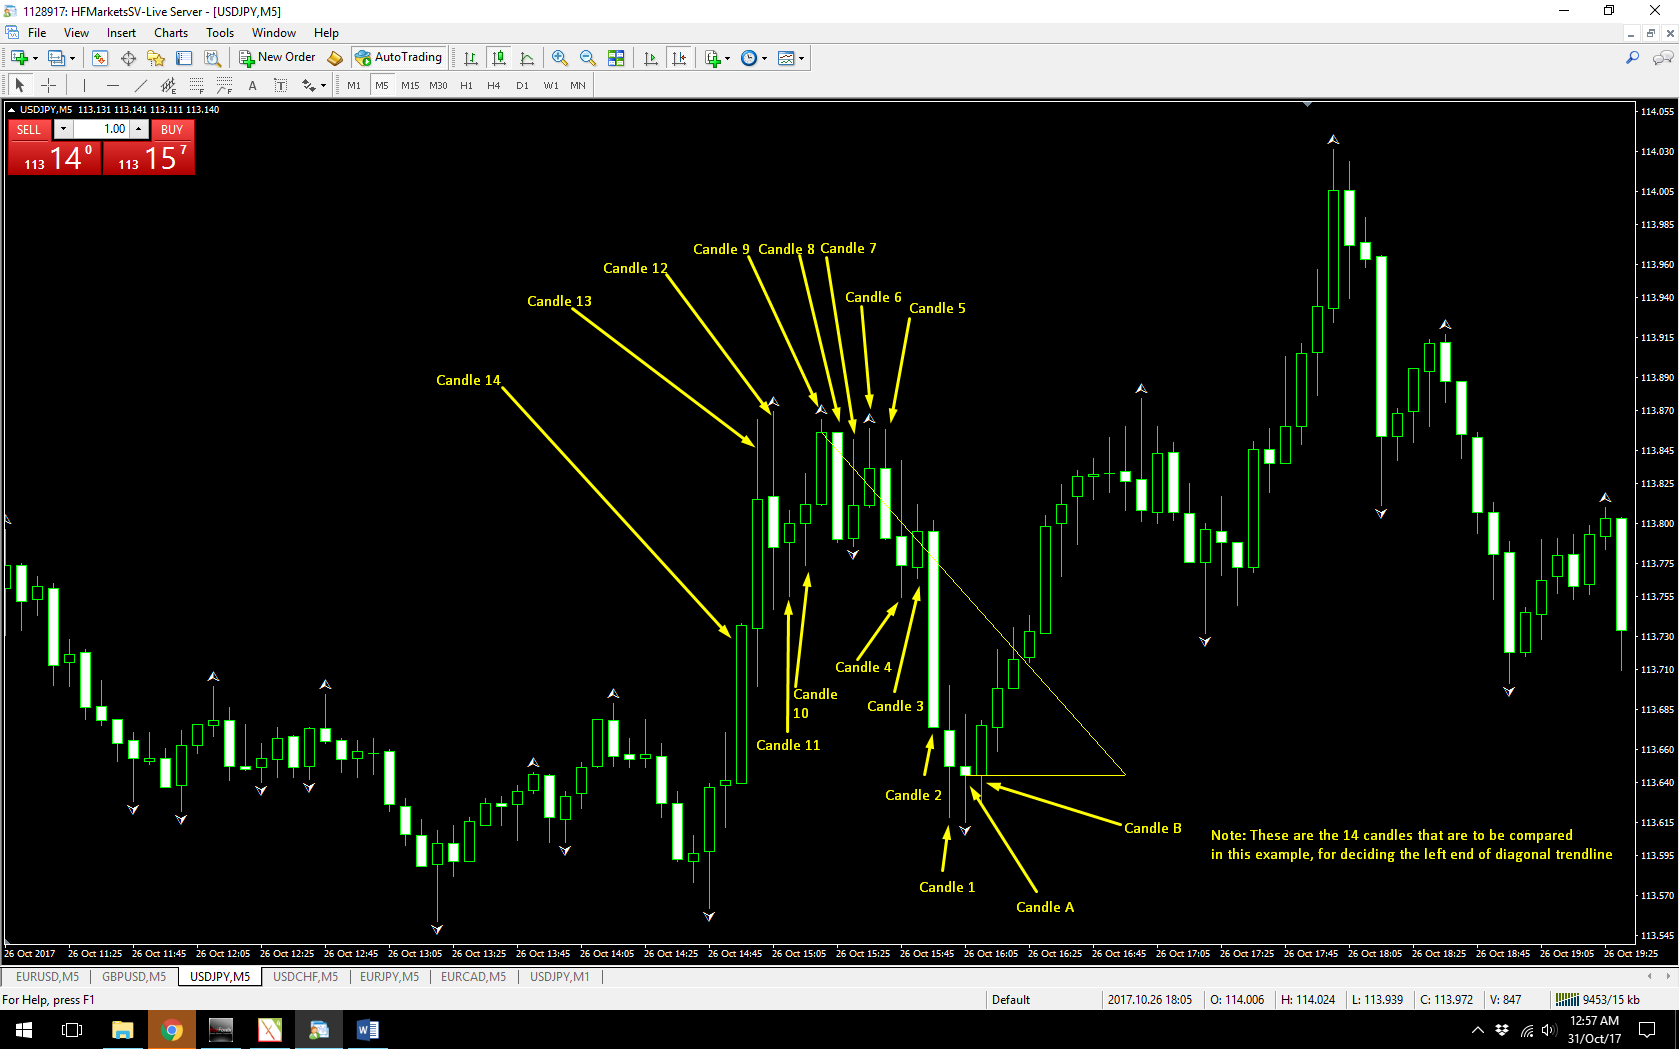
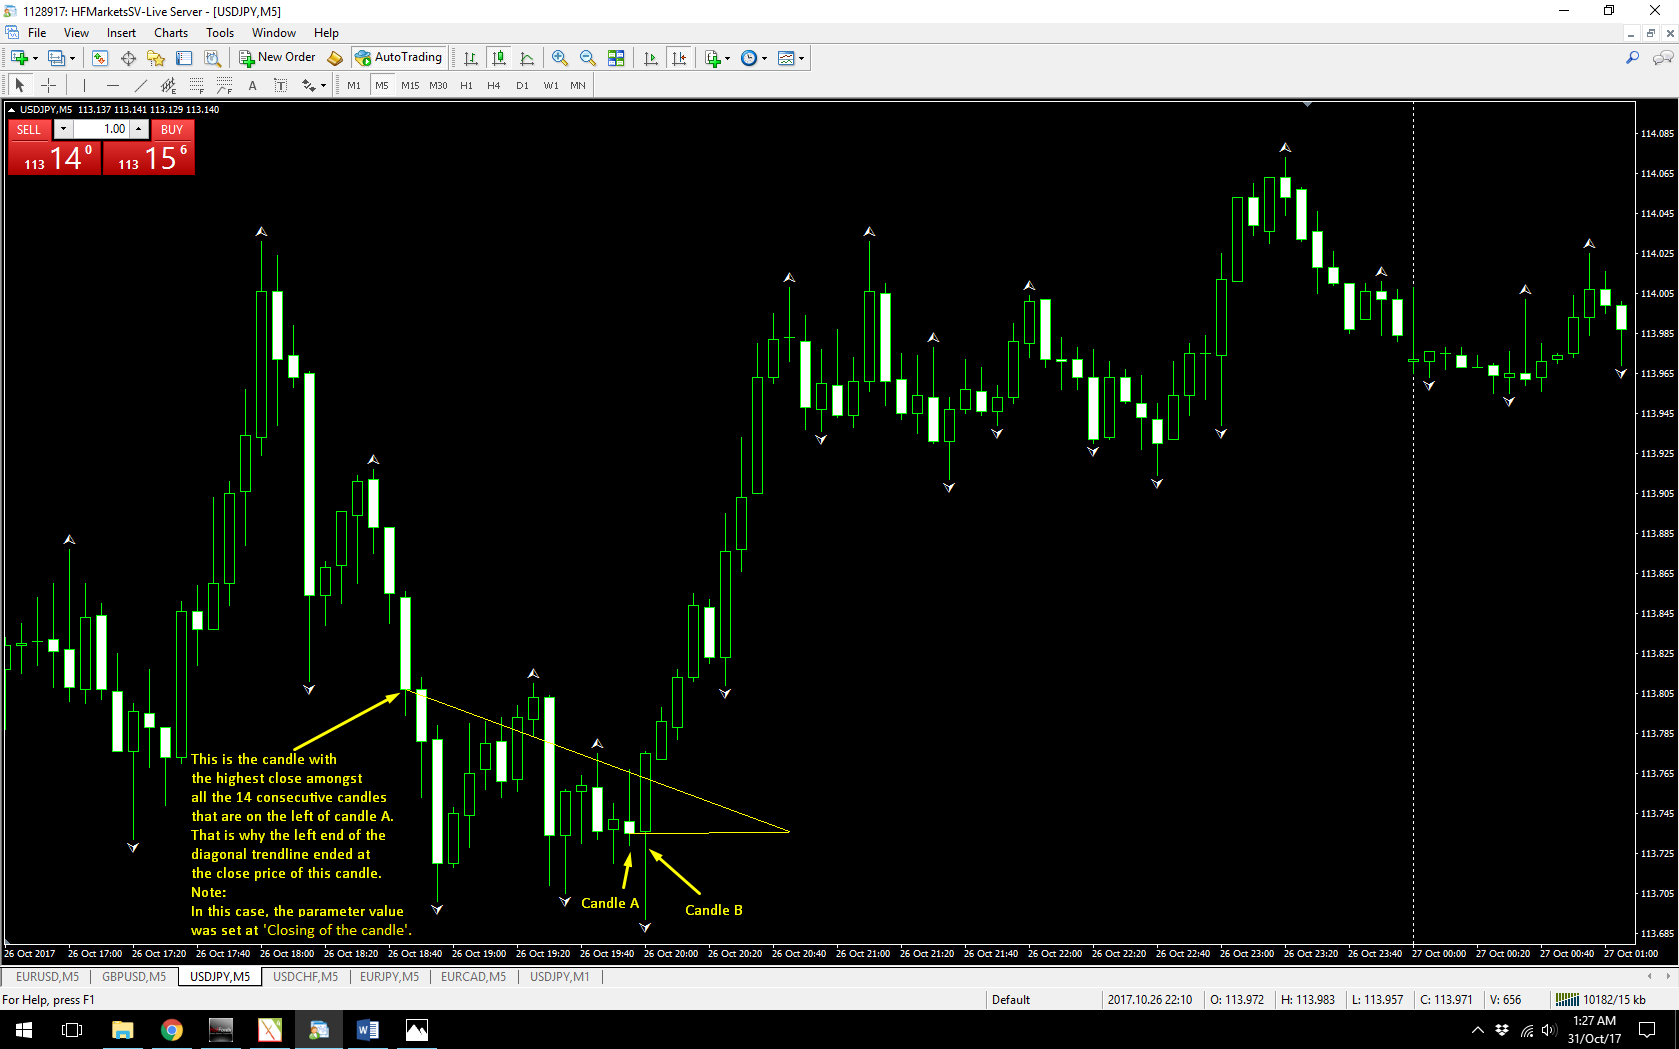
Another input parameter will be ‘Ending Point of Diagonal Trend Line’. This input can have 2 values: ‘Closing of the candle’ OR ‘High or Low of the candle’. The default value will be set at ‘Closing of the candle’.
When the value is set at ‘Closing of the candle’, then the left end of diagonal trendline will be at the close price of some candle.
When the value is set at ‘High or Low of the candle’, then the left end of diagonal trendline will be at the high/low of some candle.