Работа завершена
Техническое задание
Hey,
I think I have an easy task for you guys.
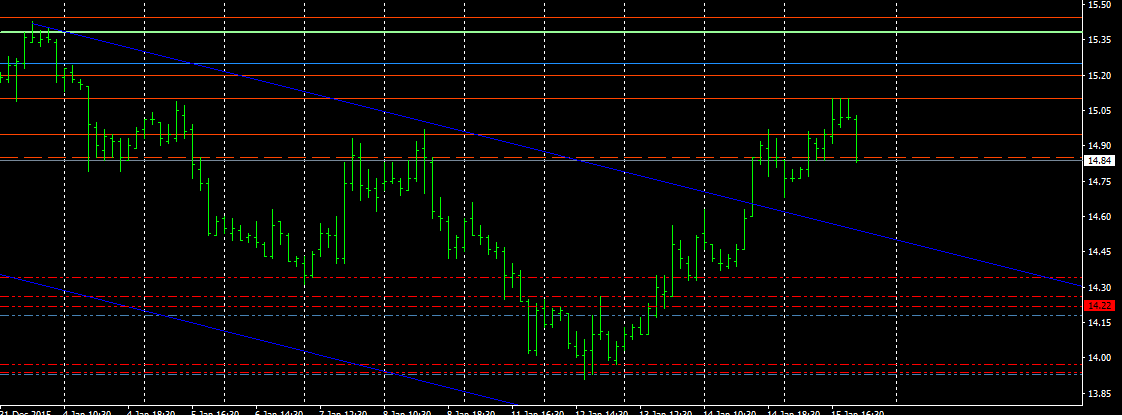
There is a need for an indicator which could draw multiple horizontal price lines (support and resistance lines) on the chart uploaded from an excel spreadsheet template.
Support prices will be classified into
two Main groups:
o Bullish
o Bearish
five sub-groups:
1. Yearly
2. Quarterly
3. Monthly
4. weekly
5. daily
And can have features(description):
A. 2
B. Major
C. Major2
D. Major3
E. Double
Excel template which will be used for upload, will have 4 different columns with support prices. Example:
|
Price |
Timeframe |
Bullish or bearish |
Description |
|
14.95 |
monthly |
Bearish |
Double |
|
15.1 |
weekly |
Bearish |
Major |
|
15.2 |
daily |
Bearish |
Major |
|
15.45 |
daily |
Bullish |
|
|
15.62 |
weekly |
Bullish |
Major2 |
|
15.89 |
monthly |
Bullish |
2 |
|
15.99 |
Quarterly |
Bullish |
Major3 |
|
16.08 |
Yearly |
Bullish |
*Price is the actual price at which horizontal line should be drawn.
Transferring excel template values to horizontal lines on MT4:
* A1,B1,C1,D1 are column names so referencing should start from A2,B2,C2,D2 boxes.
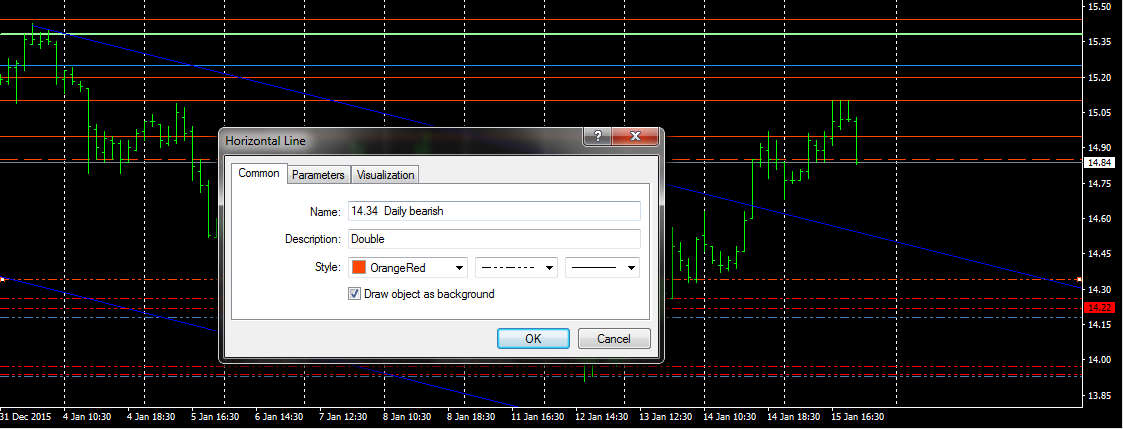
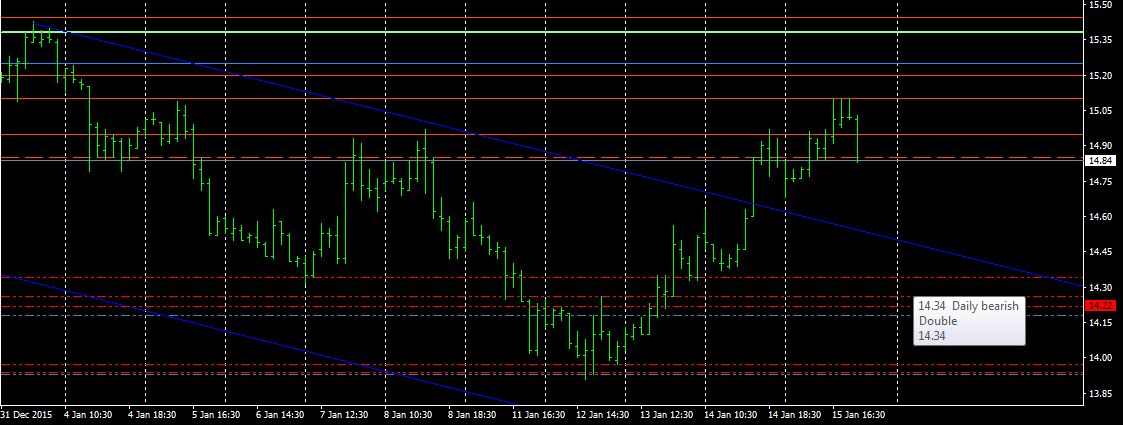
*Price, Timeframe and Status (bullish and bearish) should fill the "line name" text box space in MT4
*"Line description" should have the same text as "Description" value of the excel spreadsheet. If there is no text, then there is no extra text in this box. (attaching screenshot)
Requirements for upload and adjustments:
When uploading support prices from template I want have 10 tick boxes to enable/disable prices and choose [line colors] and styles [dashed,pointed...] for these groups:
|
1 |
daily |
Bearish |
6 |
daily |
Bullish |
|
2 |
weekly |
Bearish |
7 |
weekly |
Bullish |
|
3 |
monthly |
Bearish |
8 |
monthly |
Bullish |
|
4 |
quarterly |
Bearish |
9 |
quarterly |
Bullish |
|
5 |
yearly |
Bearish |
10 |
yearly |
Bullish |
[ On default all groups should be enabled]
Also I want to be able to choose [line width] based on "description" column value, for each one out of 6 different groups:
|
No value |
| 2 |
Major |
Major2 |
Major3 |
Double |
[on default it should be thinnest to thickest, Left to Right]
When uploaded, I don't want to see any price tags for these price lines on the chart.
[on default draw object on background function should be enabled]
That's basically good for start, later I would ask for more work, but that's most important.
Appreciate people with skills and always give more work for the same person who can deliver more than I expect ;)
Thank you!