Техническое задание
NOTE: Please apply only if you think you can do the job. MQL4 source file is attached for you to understand the task better.
[Also, please read the full job requirement first before you apply for the job]Hi. I have an indicator that I need you to modify.
The indicator displays horizontal lines on rounded price levels (at whole numbers, ex: 1.3450, 1.3500, 1.3550, 1940.50, etc). I have attached the indicator source file with this description.
I want you to modify 3 things in this indicator.
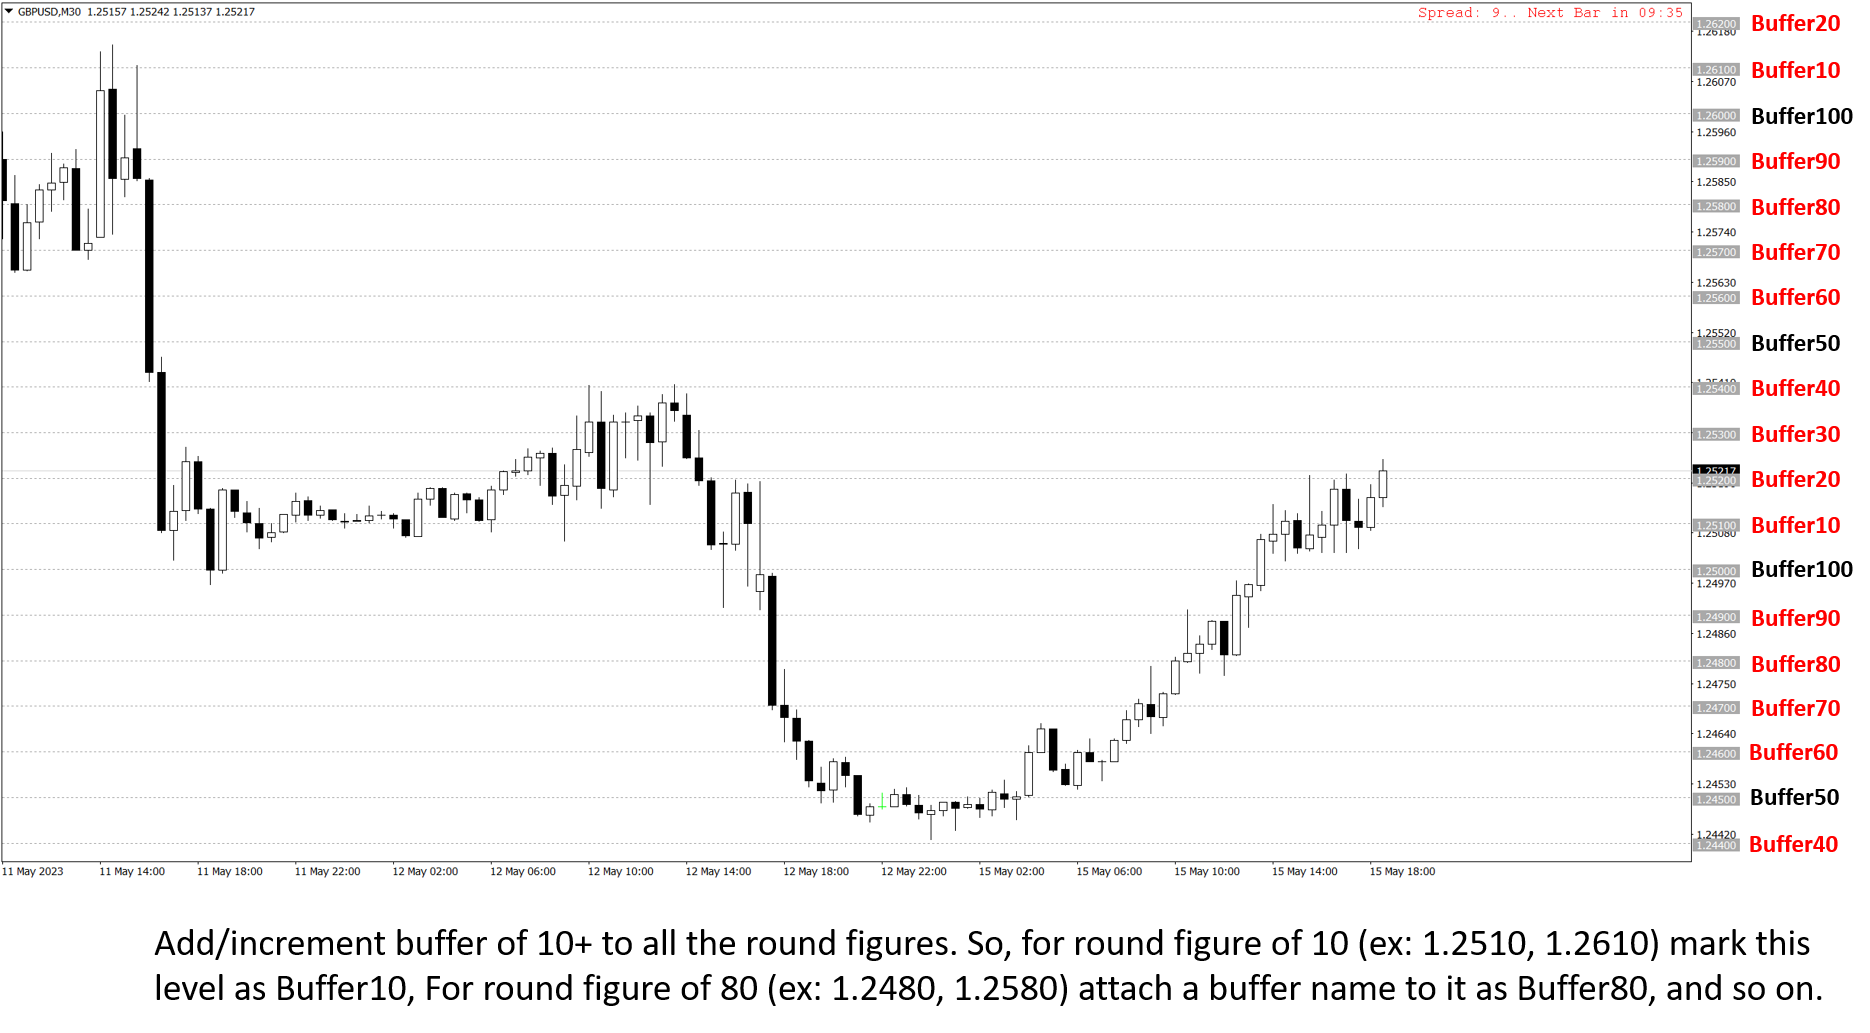
Task 1 - Attach 10 Buffers to each 10th round number ( From 00 to 90). So, add 1 buffer at price level of 00 with name "Buffer00" (example: Buffer00 = 1.2400, 1.2500, 1.1200, etc), Then add another Buffer of "Buffer10" to the rounded price level of 10 (example: Buffer10 = 1.2410, 1.2510, 1.2610,etc), Add another Buffer of 30 to price level of 30 as "Buffer30" (ex: Buffer30 = 1.2130, 1.2230)... And so on. I have attached an image with this message to show you what I mean by that. And also, Add 3 additional Buffers at price levels of 15(Buffer15. ex: 1.2515, 1.2115,etc), Price level of 25(Buffer25. Ex: 1.2125, 1.2625, etc), and 75 (Buffer75. Ex: 1.2575, 1.2275, etc). I will be using these buffers to call various rounded price levels to test and make strategies using EAbuilder platform.
As because on the chart there are more then one price levels at rounded price levels of 10/20/30,etc. I want at least 4 of these each price levels to have the same buffer (When current market price is at 1.2235 the "Buffer10" = 1.2110, 1.2210, 1.2310, 1.2410). If you want, please feel free to suggest any other ideas on that.
Task 2 - Modify the indicator code to display default rounded price levels based on chart timeframes. So, if I switch a chart timeframe it will display different price levels in the chart. Using the indicator, the default rounded price levels for each chart timeframe should be like this: For 1 minute chart: Show Horizontal Lines at 3 Pips or 3 Steps(1.2133, 1.2136, 1.2139, 1.2142, etc). For 5 minute chart: Display Horizontal Lines at 5 Pips or 5 Steps(1.2130, 1.2135, 1.2140, etc). For 15 Min Chart: 10 Pips/Steps For 30 Min Chart: 15 Pips/Steps For 1 Hour Chart: 25 Pips/ Steps For 4 Hour Chart: 50 Pips/ Steps For Daily Weekly Chart: 100 Pips/Steps For Monthly Chart: 500Pips/ Steps
Task 3 - Alert on each time price rises from below to top and touches the price levels of 45 (from 00 to 45 touch. Ex: From 1.2100 to 1.2145) and 95(Price rises from 50 to 95 touch. Ex: Alert when Price rises from 1.2150 to 1.2195). And when price falls from the top to bottom and touches the price levels of 55(from 00 to 55. ex: Price comes from 1.2300 to 1.2255) and 105(from 50 to 105. ex: price fell from 1.2350 to 1.2305). Only one alert at each of these price levels. No repeat alerts. Should have the option to switch on and off of these alerts, and an option to change the alert price values from within the indicator settings.
Let me know if you can do all these 3 tasks. If you have any questions or suggestions before applying for the job then please feel free to do so.
[Apply only if you think you can do the job. MQL4 source file is attached for you to understand the task better]
Thanks