RSI dashboard indicator

MQL4 Индикаторы

Работа завершена

Время выполнения 2 дня
Отзыв от заказчика
One of the best programmers ive come across. easy to commutate with and project was delivered ahead of time with no issues

Техническое задание

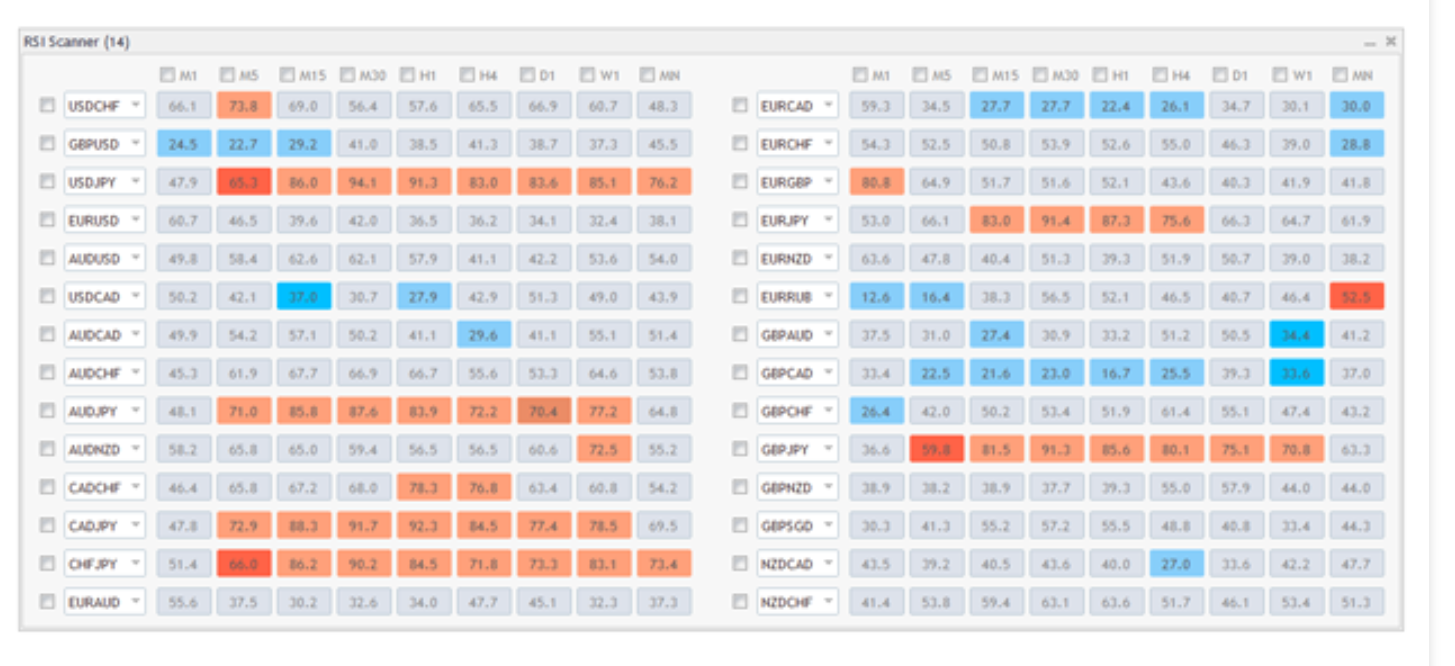
RSI Scanner is a multi symbol multi timeframe dashboard that monitors Relative Strength Index indicator in up to 28 symbols and 9 timeframes. needs to work will all instruments


RSI Scanner features:

  • Signals RSI entering and exiting the overbought and oversold zones.
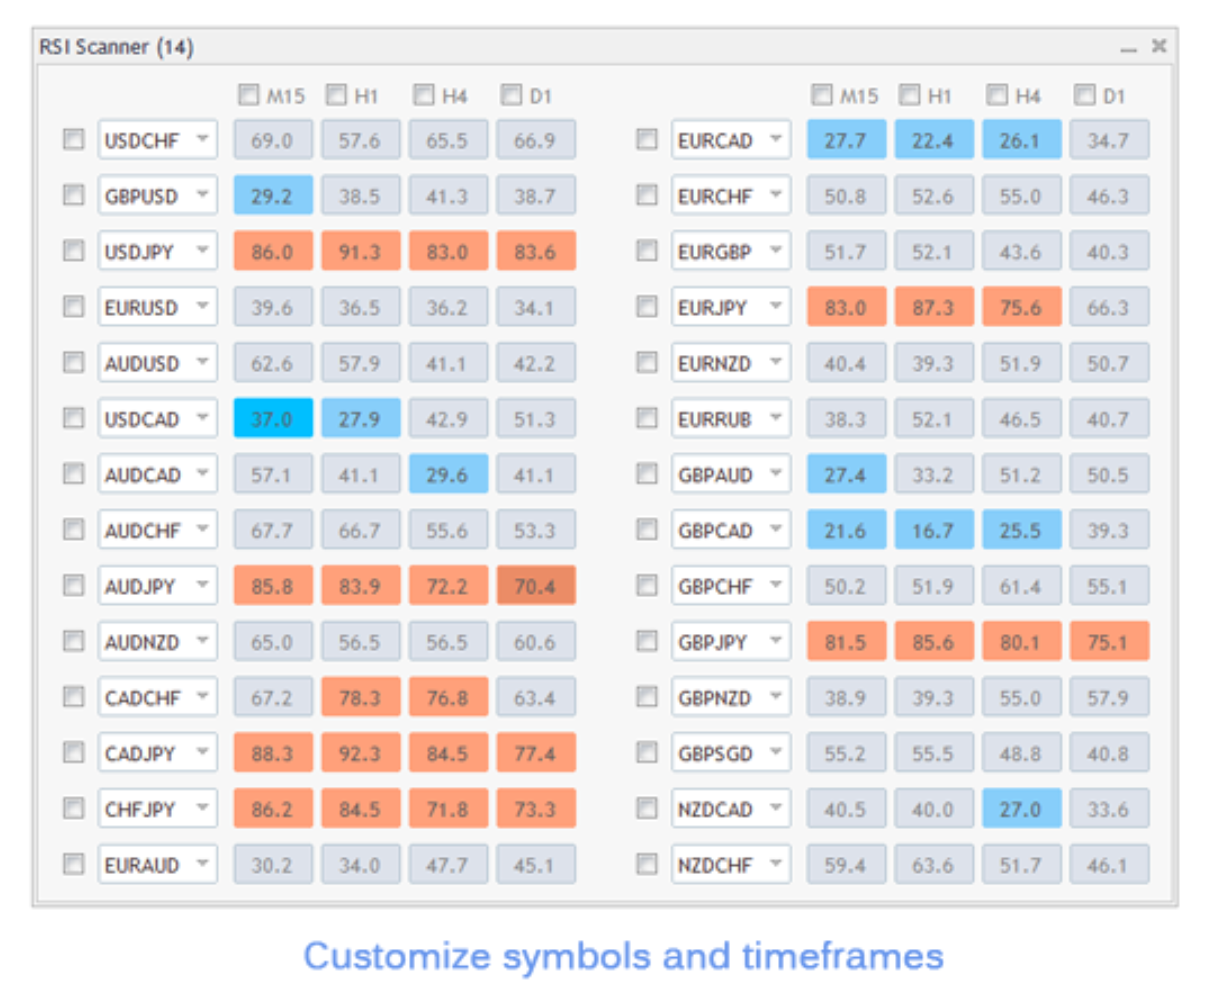
  • Monitors 28 customizable instruments and 9 timeframes at the same time.
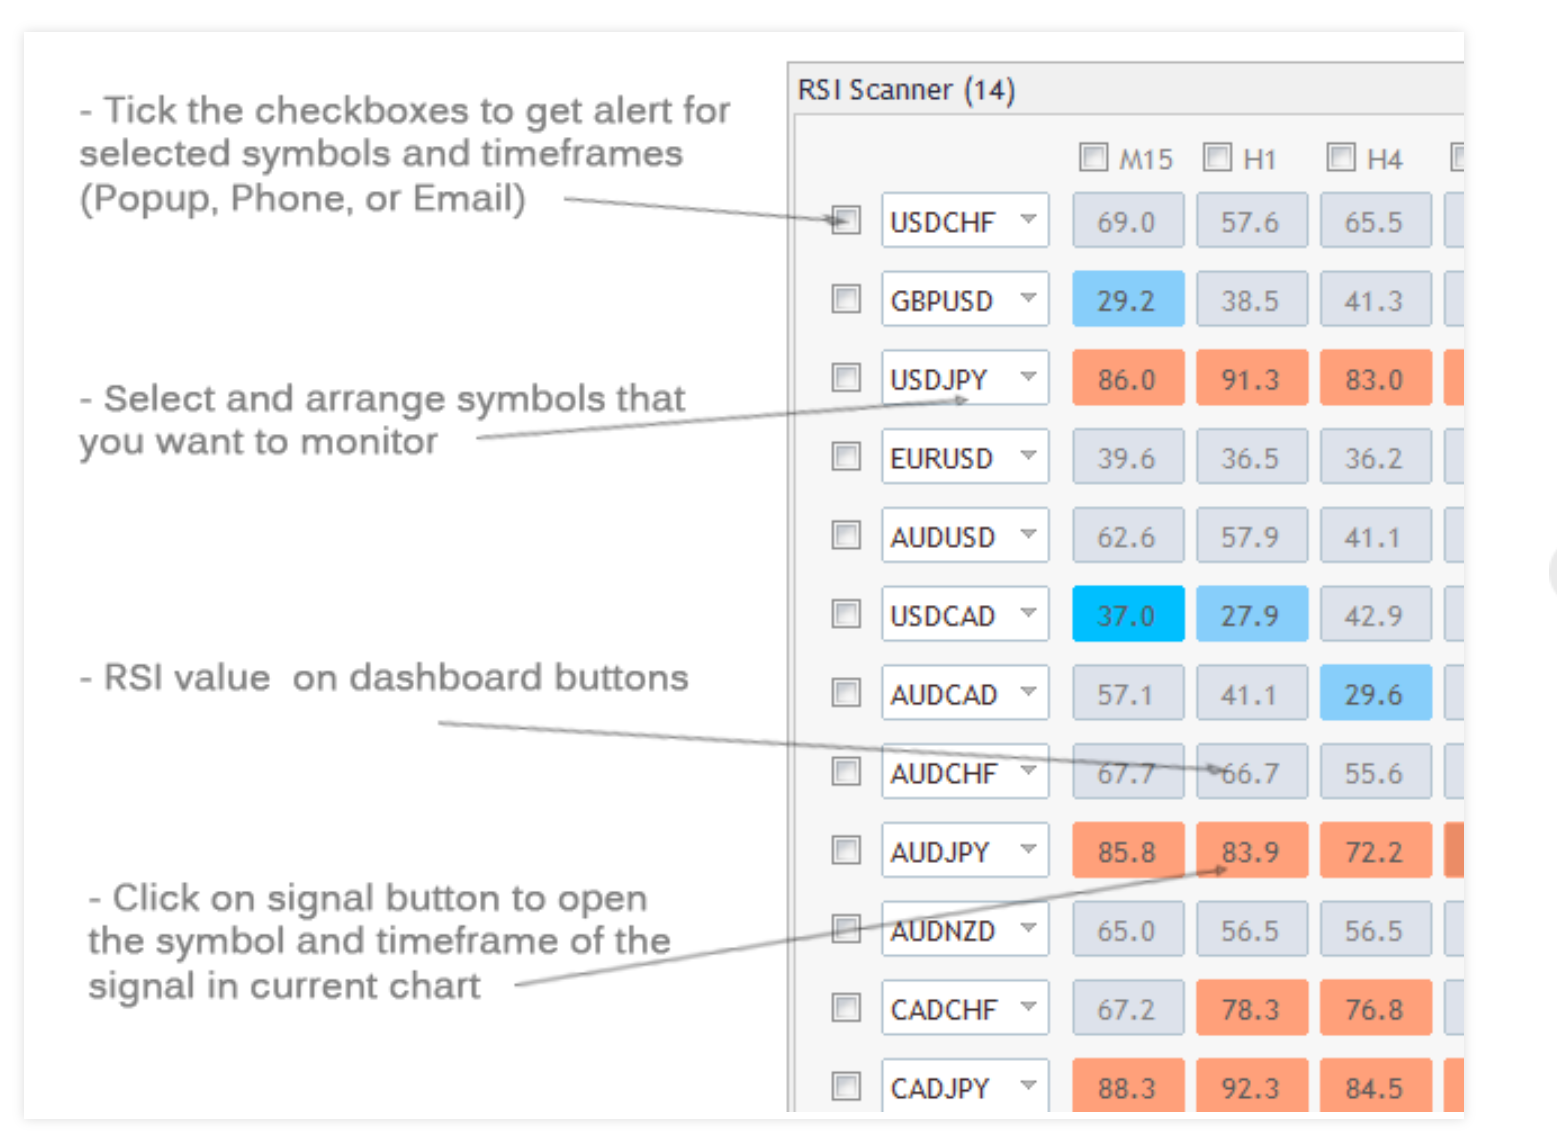
  • Popup, email, and phone notification alerts for selected symbols and timeframes.
  • Quick review of signals in the same chart by clicking on signal buttons.


Settings

RSI Settings

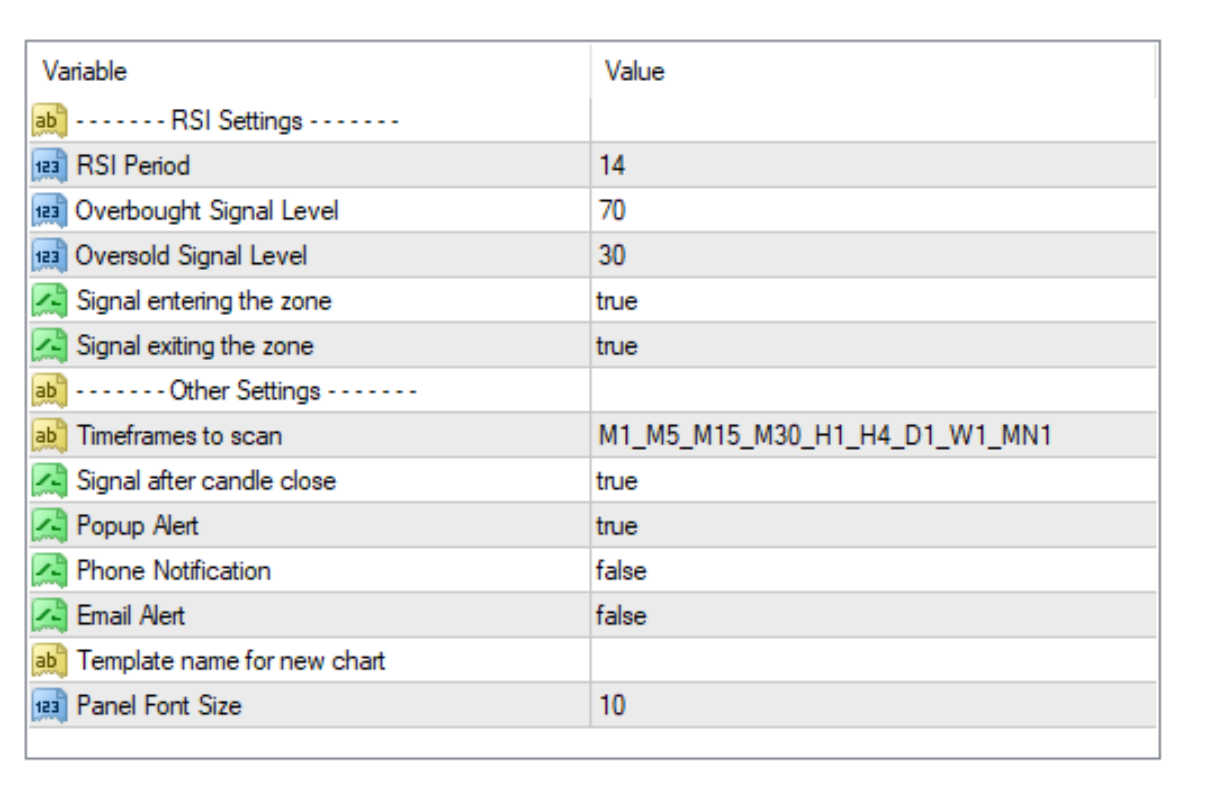
Enter RSI indicator settings such as period, and signal levels for the overbought/oversold zone here.

Other Settings

Timeframes to scan: You can type the name of timeframes (as shown in the MT4 toolbar) you want to monitor separated with the underline(underscore) "_" symbol. Reducing the number of timeframes for monitor reduces the calculations required and improves the dashboard performance.

Signal after candle close: If true dashboard waits until the close of the current candle and then checks the signal.

Popup Alert: To enable MT4 alert window informing dashboard signals on a symbol and timeframe. Select symbols and timeframes that you want to get alert for them by ticking their checkboxes on the panel.


Phone Notification: 


Email Alert: To receive indicator alerts via email. 

Template name for new chart: Enter the name of the template you want to apply to new charts opened by clicking on the dashboard buttons.


Panel Font Size: You can change the font size of labels and buttons info with this.


Notes

  1. The dashboard displays four signals in four colours. Light blue and light red for price entering the oversold or overbought zone, deep blue, and deep red are for RSI exiting oversold or overbought zone.
  2. If you want to monitor more than 28 instruments you can load the indicator on another chart and set different symbols for it.
  3. The symbols that you want to add to the dashboard must be visible in the MetaTrader market watch window. The first time you run the indicator or load a new symbol in the dashboard it might take a few seconds to update its data and show signals.


Файлы:

PNG
RSI1.PNG
569.7 Kb
PNG
RSI2.PNG
589.7 Kb
PNG
RSI3.PNG
386.6 Kb
PNG
RSI4.PNG
217.8 Kb

Откликнулись

1
Разработчик 1
Оценка
(599)
Проекты
932
46%
Арбитраж
31
39% / 29%
Просрочено
93
10%
Свободен
2
Разработчик 2
Оценка
(4)
Проекты
6
0%
Арбитраж
5
0% / 80%
Просрочено
2
33%
Свободен
3
Разработчик 3
Оценка
(41)
Проекты
77
39%
Арбитраж
0
Просрочено
0
Свободен
4
Разработчик 4
Оценка
(378)
Проекты
401
31%
Арбитраж
63
19% / 70%
Просрочено
51
13%
Загружен
5
Разработчик 5
Оценка
(320)
Проекты
523
66%
Арбитраж
52
21% / 38%
Просрочено
167
32%
Работает
6
Разработчик 6
Оценка
(356)
Проекты
590
70%
Арбитраж
14
43% / 7%
Просрочено
28
5%
Свободен
7
Разработчик 7
Оценка
(300)
Проекты
450
65%
Арбитраж
5
40% / 0%
Просрочено
4
1%
Свободен
8
Разработчик 8
Оценка
(50)
Проекты
55
60%
Арбитраж
2
0% / 0%
Просрочено
1
2%
Свободен
9
Разработчик 9
Оценка
(266)
Проекты
540
50%
Арбитраж
55
40% / 36%
Просрочено
224
41%
Работает
10
Разработчик 10
Оценка
(26)
Проекты
23
39%
Арбитраж
26
8% / 38%
Просрочено
0
Свободен
11
Разработчик 11
Оценка
(61)
Проекты
61
51%
Арбитраж
1
0% / 100%
Просрочено
1
2%
Свободен
12
Разработчик 12
Оценка
(62)
Проекты
193
73%
Арбитраж
4
100% / 0%
Просрочено
1
1%
Работает
Похожие заказы
I have an EA that need some changes including integrating the indicator code directly into the Expert Advisor. I will give the detailed doc once we settle on the candidate for the job . Please bid if you can work with the stated amount. Thanks
Hello, Need to convert Tradingview Indicator to MQL4 indicator. or if you have this one converted already, let me buy a copy please. If we're good, then will definitely buy it and ask to convert into EA on new order. Supertrend by KivancOzbilgic
Fix bug or modify an existing Trading view indicator to display correct. The indicator is working but not displaying/plotting all the information i want. So i want it adjusted to plot all the info
Here's a brief requirement you can use: **Description:** I am seeking an experienced MQL5 developer to create a (EA). The EA should include features for placing pending orders (Buy Stop and Sell Stop) based on market spread, managing trades effectively at the opening of new candlesticks, and implementing take profit and stop loss strategies. Additionally, I would like the option to adjust parameters based on market
I have an EA which i need to do below modifications. Variable Inputs to be added Order Type : Market , Pending Trade Type : Buy, Sell , Buy & Sell Pending Pips Step : ( Pips Value can be negative or positive to decide on what type of Pending Order ) // If trade type Buy is selected Close Type : Close All ( Bulk Close Option in MT5 ) , Close Individually Close Option : %of Equity , %of Balance , Amount $ , %of No
Add multiplier to grid recovery system. For example: Grid Trade 2-3 Spacing; 1.0 Multiplier Grid Trade 4-6 Spacing; 2.0 Multiplier Grid Trade 7+ Spacing; 1.6 Multiplier Need quick turn around. Need it done ASAP
Objects reader PIN 70 - 100 USD
Hi I have an indicator that create objects in the chart and using those following some rules the new indicator will create external global variables with value = 0 ( NONE ), = 1 ( BUY ) or = 2 ( SELL ). The global variable will use PIN external integer number . PINS are by now global variables (GV) whose name indicates the pair name and the PIN belonging and their value indicates it direction/action. PINS GV names
I want an indicator and its source code that returns the value of: - two moving averages in different selectable timeframes, with method Exponential and price calculation price_open; - Opening, closing, maximum and minimum of the candle in different timeframes And that returns the values ​​regardless in a chart of one minute. The input parameters: * select timeframe media1 = {1,2,3,4,5,...} * select timeframe media2
Hello, I want offline Renko chart based on pips and time. Trading View Renko chart is a perfect example of what I require, it prints renko bricks at close of time frame chosen which is more cleaner. The Trading View Renko chart wait until end of desired timeframe candle to close before final renko bricks are drawn. Best is to look at Trading View renko charts to see exactly how this works. I currently have an
A simple candle pattern indicator is required that makes a sound alert and draws an arrow when two consecutive bars have the same high or the same low. If two highs, the second bar is a down close and the bar immediately preceding the two highs is a lower high. Vis versa for 2 lows. The second bar is an up close and the bar immediately preceding the two lows is a higher low. Please see attached images for

Информация о проекте

Бюджет
35 - 80 USD
Исполнителю
31.5 - 72 USD