Muhammad Anas Zainal Abidin / Perfil
- Informações
|
5+ anos
experiência
|
0
produtos
|
0
versão demo
|
|
0
trabalhos
|
3
sinais
|
0
assinantes
|
Just a simple man who trades to fulfill one needs :)
Muhammad Anas Zainal Abidin

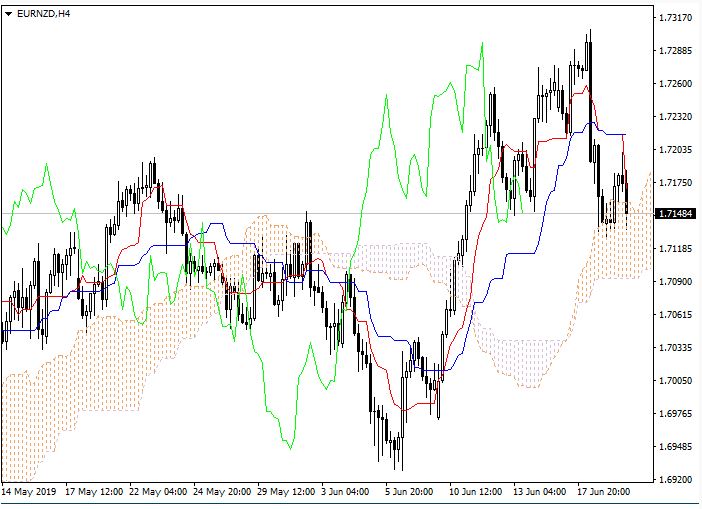
Let's look at the four-hour chart. Tenkan-sen line has crossed Kijun-sen from above, the red line is directed downwards, while the blue one remains horizontal. Confirmative line Chikou Span has crossed the price chart from above, current cloud is ascending. The instrument has entered the cloud. The closest support level is the lower border of the cloud (1.7092). The closest resistance level is the lower border of the cloud (1.7179).
On the four-hour chart the instrument is trading within the cloud. On the daily chart we can see the beginning of the trend reversal. It is not recommended to open positions at current price. Pending orders should be placed at the cloud’s borders: sell at the level of 1.7092, with Take Profit at 1.6996 and Stop Loss at 1.7179; buy at the level of 1.7179, with Take Profit at 1.7251 and Stop Loss at 1.7092.
On the four-hour chart the instrument is trading within the cloud. On the daily chart we can see the beginning of the trend reversal. It is not recommended to open positions at current price. Pending orders should be placed at the cloud’s borders: sell at the level of 1.7092, with Take Profit at 1.6996 and Stop Loss at 1.7179; buy at the level of 1.7179, with Take Profit at 1.7251 and Stop Loss at 1.7092.
Muhammad Anas Zainal Abidin
At the moment, the pair EURUSD is gaining 0.01% at 1.1277 and a breakout of 1.1347 (high Jun.7) would target 1.1360 (200-day SMA) en route to 1.1448 (monthly high Mar.20). On the other hand, the next support lines up at 1.1268 (low Jun.13) followed by 1.1219 (55-day SMA) and finally 1.1200 (low Jun.6).
Muhammad Anas Zainal Abidin
Publicado o postagem USD/CHF: technical analysis
On the 4-hour chart, the instrument trades within a sideways channel formed by the boundaries of Bollinger bands, the indicator cloud narrows. The MACD histogram is in the positive area, the signal line crosses the zero line upwards, forming a signal to open long positions...
Muhammad Anas Zainal Abidin

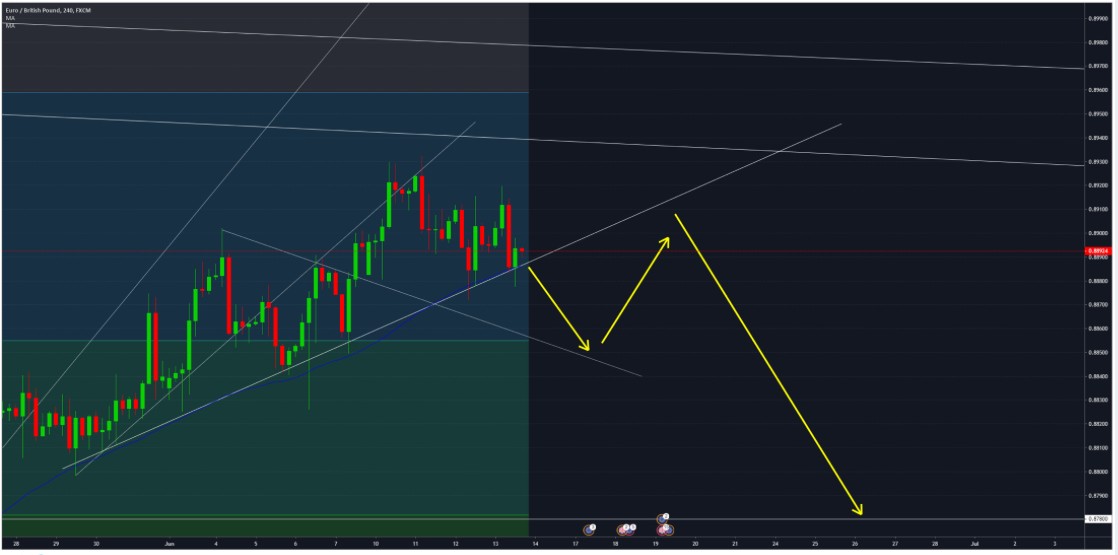
EURGBP Short Prediction..
Our first idea runs exactly like we showed..
What I now see at the moment is that it try to break the support line,
and more important, the 50 Moving average on the 4H chart and the 200 Moving average on the 1H chart.
If those 3 things line up, then retest and it fail, we can get a nice short.
Our first idea runs exactly like we showed..
What I now see at the moment is that it try to break the support line,
and more important, the 50 Moving average on the 4H chart and the 200 Moving average on the 1H chart.
If those 3 things line up, then retest and it fail, we can get a nice short.

: