• Visão global
  • Comentários (16)
  • Discussão (24)
  • O que há de novo

Full Stochastic

4.75

Full Stochastic - is Stochastic Oscillator which displays all three essential lines:

  • %K
  • Slow K
  • %D

Standard Stochastic Oscillators displays only Slow K and %D.


Why it is important to analyze all three lines in SO?

Standard SO users must choose if they want to use fast or slow SO. In case of fast SO traders set the slowing parameter typically to 1 or 2, or if they want to use slow SO, they set the slowing parameter usually to 3 or more.

With Full Stochastic you can have both!


Full Stochastic Parameters

  • K Period (Default: 89) - %K calculation period
  • Slow K Period (Default: 55)- Slow K calculation period
  • D Period (Default: 34)- %D calculation period
  • Indicator Name (Default: Minimal) - amount of name details
  • Line Description  (Default: Moderate) - amount of line info details 
  • K, Slow K, D Line visibility 


K-Line

The fastest line of the oscillator. It is displayed as a dotted blue line by default.


Slow K-Line

Medium speed line. It is slower than K-Line, but faster than D-Line. It is calculated as a moving average of the K-Line. By default it is displayed as a solid blue line.


D-Line

The slowest line of the oscillator. It is calculated as a moving average of a Slow K-Line. By default it is displayed as a full red line.


How to use Full Stochastic indicator?

Full Stochastic can be used in any way a standard Stochastic Oscillator can be used, but with an advantage because you can see both fast and slow oscillator at the same time. That means you can use your favorite strategy in a better way.

With Full Stochastic you can do even more - you can use it in ways you can not with standard SO.


Example strategy: Slow K and %D Crossover Above 80 or Below 20 and %K Crossing 50

The basic idea is to wait until Slow K and %D go out of the 20-80 range and for %K Line to be close by them. Then if Slow K and %D crossover each other, and %K line goes back and crosses level 50, and the price on main chart moves in the desired direction the position is opened. The movement of price is measured between the close of candle in which the crossing of Slow K and %D has occurred and the close of %K crossing level 50 candle.

Stop loss is to be set on the worst price level of the worst candle between the close of candle in which the crossing of Slow K and %D has occurred and the close of %K crossing level 50 candle. The worst price insures that the SL is the safest logically possible.

Position should be closed when Slow K and %K lines go to the opposite end and crossover each other out of the 20 - 80 range.

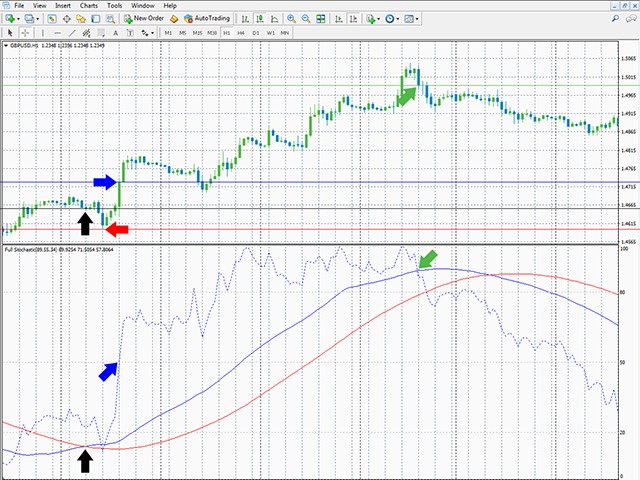
Example of a good signal can be seen on first screenshot. Black arrows are showing Slow K and %D crossing point and the candle in which the crossing has occurred. Black line shows the close price of the crossing candle. Because the crossing is below level 20, it is a BUY signal. Blue arrows are showing %K crossing level 50 and the candle in which that crossing has occurred. Blue line shows the close price of the %K crossing level 50 candle. Because it is a BUY signal, we check if the price has moved up between black and blue lines, and it has, so it is a confirmation that the BUY signal is valid and we open BUY position at the close price of blue arrow candle. Now we are looking at the candles between the black and the blue arrow, we search the farthest candle from the desired direction. Because it is a BUY signal, we look for the candle with the lowest low. Red arrow is showing the candle with the lowest low, and that low will be our Stop Loss. Red line is showing Stop Loss. At last, because it is a BUY order we wait for Slow K and %K to go all the way over level 80 and to crossover above it and that is when we close our position.

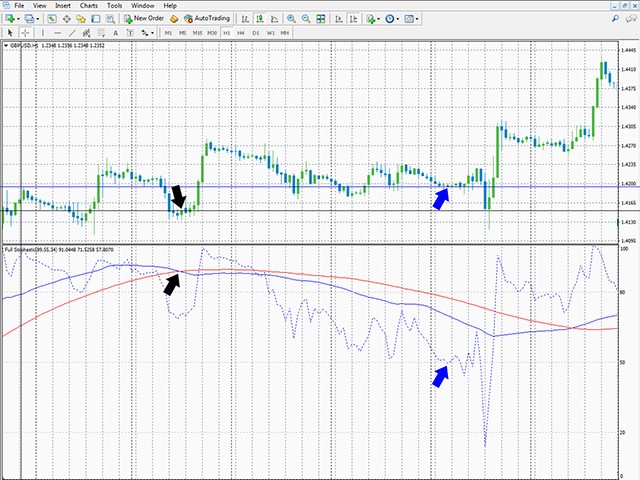
On the second screenshot we see a different situation: a false signal. Simply put - the signal is not valid because the price at the blue arrow is worse than the price at the black arrow. Slow K and %D had crossed above the 80 level, so it is a SELL signal, but the price at the moment %K is crossing the level 50 is higher than the price when SELL signal occurred, so we do not open SELL position. The price action is not in our favour so we pass this signal.

Above strategy is just a basic example, there are many more things to consider, and the best practice is to check for even more confirmations and pick only the very best trades. Always use a common sense while trading, trading is a risky business. As with all indicators, there is a margin for errors. Not all signals are valid.

Comentários 16
zofesu
350
zofesu 2023.04.02 16:52 
 

So far, the best stochastic that shows a long-term trend and at the same time a short-term reversal

maxfire54
269
maxfire54 2022.06.21 01:15 
 

in this system which I find interesting there is no reference to the periods suitable for it. You can suggest or tell us Thank you

boghrat21
152
boghrat21 2021.09.14 10:24 
 

wonderful

Produtos recomendados
FREE FOR A LIMITED TIME ONLY!!! The Ultimate Indicator For Trading Trend This indicator clearly shows you the strength of the market in one direction or the other, which means that you can trade knowing you are either with or against the market. When used in conjunction with the +3R principles you are sure to have some serious results. The +3R Principles Routine - This is when you trade and how often  Rules - This is the rule you follow  Risk:Reward - This is the percentage amount of your accoun
FREE
Discover the power of precision and efficiency in your trading with the " Super Auto Fibonacci " MT4 indicator. This cutting-edge tool is meticulously designed to enhance your technical analysis, providing you with invaluable insights to make informed trading decisions. Key Features: Automated Fibonacci Analysis: Say goodbye to the hassle of manual Fibonacci retracement and extension drawing. "Super Auto Fibonacci" instantly identifies and plots Fibonacci levels on your MT4 chart, saving you tim
FREE
MegaTrends
Sivakumar Subbaiya
1 (1)
Megatrends  Indicator   Time Frame: Suitable for any time frame.  Purpose: Trend Prediction. Blue and red color indicate the buy and sell call respectively. Buy: When the blue line is originating it is opened buy call. Sell: When the Red line is origination it is opened sell call Happy trade!! this indicator is suitable for all time frame, but our recommended time frame to use 1hour and 4 hours, suitable for any chart.
FREE
TrendPlus
Sivakumar Subbaiya
4.08 (12)
Trend Plus   Trendplus  Indicator   Time Frame: Suitable for any time frame.  Purpose: Trend Prediction. Blue and red candle indicate the buy and sell call respectively. Buy: When the blue candle is formed buy call is initiated. close the buy trades when the next red candle will formed.   Sell: When the Red candle is formed Sell call is initiated. close the Sell trades when the next blue candle will formed.   Happy trade!!
FREE
Email Drawdown Alert
Roman Starostin
5 (12)
Free informative Indicator-helper. It'll be usefull for traders who trade many symbols or using grid systems (Averaging or Martingale). Indicator counts drawdown as percent and currency separate. It has a number of settings: Count deposite drawdown according equity value and send e-mail or notifications to user if DD more than set; Sending e-mail when max open orders reached; Shows price and remaining pips amount before MarginCall on current chart and Account generally; Display summary trade lot
FREE
Rainbow MT4
Jamal El Alama
Rainbow MT4 is a technical indicator based on Moving average with period 34 and very easy to use. When price crosses above MA and MA changes color to green, it’s a signal to buy. When price crosses below MA and MA changes color to red, it’s a signal to sell. The Expert advisor ( Rainbow EA MT4) based on Rainbow MT4 indicator, as you can see in the short video below is now available here .
FREE
Extremum by trend
Anton Iudakov
5 (1)
Looking for entry points along the local trend without repaint! Arrows indicate entry points. Based on classic indicators. The indicator is easy to use. Settings Наименование Описание Frequency factor Signal frequency. The less, the more often. This affects the quality. Recommendations Recommended for use on major currency pairs. Timeframe from m5, m15, m30 Subscribe to my telegram channel, where we discuss intraday trading, ideas, indicators, etc., a link in my profile contacts.
FREE
Are you tired of drawing trendlines every time you're analyzing charts? Or perhaps you would like more consistency in your technical analysis. Then this is for you. This indicator will draw trend lines automatically when dropped on a chart. How it works Works similar to standard deviation channel found on mt4 and mt5. It has 2 parameters: 1. Starting Bar 2. Number of bars for calculation The   starting bar   is the bar which drawing of the trend lines will begin, while the   number of bars for c
FREE
Multi Divergence Indicator for MT4 - User Guide Introduction Overview of the Multi Divergence Indicator and its capabilities in identifying divergences across multiple indicators. Importance of divergence detection in enhancing trading strategies and decision-making. List of Indicators RSI CCI MACD STOCHASTIC AWSOME MFI ACCELERATOR OSMA MOMENTUM WPR( Williams %R) RVI Indicator Features Indicator Selection:  How to enable/disable specific indicators (RSI, CCI, MACD, etc.) for diverg
FREE
Trend arrow Indicator
NGUYEN NGHIEM DUY
3.33 (9)
Trend arrow Indicator is an arrow Indicator used as an assistant tool for your trading strategy. The indicator analyzes the standard deviation of bar close for a given period and generates a buy or sell signals if the deviation increases. It good to combo with Martingale EA to follow Trend and Sellect Buy Only/Sell Only for EA work Semi-Automatic. You can use this  Indicator with any EAs in my Products.
FREE
MTF Stochastic and RSI
Georgiy Gazaryan
5 (2)
A simple but effective helper that will allow you to track both global and local market trends. The indicator combines the work of two oscillators: Stochastic and RSI. Both indicators can be set to any timeframe. Advantages of Use Multitimeframe - you can adjust both indicators to the desired timeframes. To obtain the entry points, you can use the Elder's triple screen system. Highly customizable - you can configure not only the parameters of the indicators, but also their appearance (color an
FREE
Color Macd Tf
Syarif Nur Arief
MACD is well known indicator that still can be use for prediction where price will go next few minutes, hours or even weekly  With colored bar of Macd, your eyes can easily catch when color is changed based what market price movement to find any early trend on market. here is the parameter of the indicator: TF_MACD , default is 1 Hour , this mean you can see clearly MACD of 1 Hour TimeFrame on Lower TimeFrame. InpPrice , default is Price Close , this is original MACD parameter from Metaquotes st
FREE
QualifiedEngulfing
Ashkan Hazegh Nikrou
QualifiedEngulfing - é a versão gratuita do indicador ProEngulfing ProEngulfing - é a versão paga do indicador Advance Engulf, faça o download aqui. Qual a diferença entre a versão gratuita e paga do ProEngulfing ? A versão gratuita tem a limitação de um sinal por dia. Apresentamos o QualifiedEngulfing - Seu indicador profissional de padrões Engulf para o MT4 Desbloqueie o poder da precisão com o QualifiedEngulfing, um indicador de última geração projetado para identificar e destacar padrões En
FREE
RSI With Alert Relative strength index (RSI) indicator is a popular technical indicator in the family of oscillators. RSI oscillates between 0 and 100 and traders use it to spot overbought and oversold states in the market. Typically, a value above 70 means that the instrument is overbought and due to a retracement. A value below 30 means that the trading instrument is oversold. RSI indicator strategies This indicator allows you to get notifications when some conditions trigger. You c
FREE
HMA Trend
Pavel Zamoshnikov
4.6 (68)
A trend indicator based on the Hull Moving Average (HMA) with two periods. The Hull Moving Average is an improved variant of the moving average, which shows the moment of trend reversal quite accurately. It is often used as a signal filter. Combination of two types of Hull Moving Averages makes a better use of these advantages: HMA with a slow period identifies the trend, while HMA with a fast period determines the short-term movements and signals in the trend direction. Features The movement
FREE
The MT4 indicator that we are describing is designed to provide traders with an alert, notification, and email when Fibonacci levels are crossed. The Fibonacci levels are calculated based on the zigzag indicator, which helps to identify potential trend reversals in the market. When the indicator detects that a price has crossed a Fibonacci level, it will trigger an alert and send a notification to the trader's MT4 mobile app. Additionally, the indicator can be configured to send an email to the
FREE
KF Trix MT4
Sevgi Hilal Kilic
5 (2)
KF Trix V1.00 The triple exponential average (TRIX) indicator is an oscillator used to identify oversold and overbought markets and is also a momentum indicator. The triple smoothing of moving averages is designed to filter out price movements that are considered insignificant or unimportant. About Software details and MQL login link Copyright 2022, Forex KRAL
FREE
With this system you can spot high-probability trades in direction of strong trends. You can profit from stop hunt moves initiated by the smart money! Important Information How you can maximize the potential of the scanner, please read here: www.mql5.com/en/blogs/post/718109 Please read also the blog about the usage of the indicator: Professional Trading With Strong Momentum This FREE Version of the indicator works only on EURUSD and GBPUSD. The full version of the indicator can be found here:
FREE
Introducing the Consecutive Green/Red Candle Alert Indicator for MT4 - Your Trend Spotting Companion! Are you ready to take your trading to the next level? We present the Consecutive Green/Red Candle Alert Indicator, a powerful tool designed to help you spot trends and potential reversals with ease. Whether you're a new trader looking for clarity in the market or an experienced pro seeking additional confirmation, this indicator is your trusted companion. Key Features of the Consecutive Green/Re
FREE
Free automatic Fibonacci is an indicator that automatically plots a Fibonacci retracement based on the number of bars you select on the BarsToScan setting in the indicator. The Fibonacci is automatically updated in real time as new highest and lowest values appears amongst the selected bars. You can select which level values to be displayed in the indicator settings. You can also select the color of the levels thus enabling the trader to be able to attach the indicator several times with differe
FREE
Toby Strategy Indicator
Ahmd Sbhy Mhmd Ahmd ʿYshh
The indicator rely on The Toby strategy >> The mother candle which is bigger in range than the previous six candles. A vertical line shows the last Toby Candle with the targets shown up and down. The strategy is about the closing price out of the range of the toby candle to reach the 3 targets..The most probable to be hit is target1 so ensure reserving your profits and managing your stop lose.
FREE
CCI in MA
Nikolaos Pantzos
4.75 (4)
iCC in iMA is indicator to change color in iMA if iCCI crosses level up (up trend) or crosses level down (down trend). It is a useful tool to track when the upside and the downside iCCI on iMA. You can to get source code from here . Parameters MA_Periods —Period for iMA. MA_Method — Method for iMA. CCI_Periods —Period for iCCI. CCI_ApliedPrice — Price used for iCCI. CCI_LevelsUp — Level iCCI for up trend. CCI_LevelsDN — Level iCCI for down trend. BarsCount — How many bars will show the line.
FREE
Supply Demand Ribbon is an indicator with moving supply and demand lines that help you identify price zones more easily. The indicator helps you determine flexible entry, stop loss, and take profit areas. There are also strategies for algorithmically changing ribbon colors. From there you can come up with many trading strategies for yourself! MT5 Version:   Click here! You can explore many feature in   Advanced   version   here ! You can combine it with our indicators below to make your trad
FREE
The indicator shows/alerts divergences of RSI indicator.  note: You can check the free EA here that utilizes this indicator. repaint and lag issue Divergence indicators are usually repaint and lagging in their nature. You may have experienced in trading when you see a divergence on chart but the divergence continues further or just disappear. pivots_period input The smaller this value is the more and faster signals are generated. The greater this value you will have less and late signals. displa
FREE
Live Sup Res MT4
Claudia Ramona Angerer
4.5 (2)
Identification of support and resistance areas A useful indicator for traders completely free Can be used in all symbols Can be used in all time frames It has three different trends: short term, medium term, long term Settings: Clr1,2: You can change the color of the lines Type Trend: You can determine the trend Message me for questions, criticism and suggestions
FREE
Tipu Heikin Ashi Panel
Kaleem Haider
4.56 (18)
Tipu Heikin-Ashi Panel is the modified version of the original Heiken Ashi indicator published by MetaQuotes here . A professional version of this indicator is available here . Features An easy to use Panel that shows the Heiken Ashi trend of selected timeframe. Customizable Buy/Sell alerts, push alerts, email alerts, or visual on-screen alerts. Customizable Panel. The panel can be moved to any place on the chart or minimized to allow more space. Heikin means "the average", and Ashi means "foo
FREE
Traditional MACD MT4
Daniel Lewis
4.59 (56)
Indicador MACD em MetaTrader 4/5 parece diferente do que o MACD faz na maioria dos outros softwares gráficos. Isso é porque a versão MetaTrader 4/5 de MACD mostra a linha MACD como um histograma quando é tradicionalmente apresentado como uma linha. Além disso, a versão MetaTrader 4/5 calcula a linha de sinal usando uma SMA, no entanto de acordo com a definição, o indicador MACD supostamente é calculado com uma EMA. A versão MetaTrader 4/5 também não computa um verdadeiro Histograma MACD (a difer
FREE
IMA Finder MT4
Mubashir Mohamed Quraish Albarakat
This indicator is designed based on the Moving Origin indicator When the moving origin indicator breaks the price, this indicator gives a signal It is useful for better viewing of signals and analysis on them Attributes: Can be used in all symbols Can be used in all time frames Too many signals Simple and quick settings Easy way to work Settings: period: like moving average settings alarmShow: If you want to receive an alert in Metatrader after receiving the signal, enable this setting a
FREE
TrendNote
Sivakumar Subbaiya
Trend Note Indicator   Suitable for multi time frame market direction prediction. Blue and red color indicate the buy and sell call respectively. Blue indicator is denote buy call and Red indicator denote the sell call. Happy trade!! this indicator is suitable for all time frame, but our recommended time frame to use 1hour and 4 hours, suitable for any chart.
FREE
Check my paid tools they work great and I share Ea's based on them for free please r ate The Dual Timeframe RSI (Relative Strength Index) indicator is a novel trading tool that allows traders to monitor RSI readings from two different timeframes on a single chart. This dual perspective enables traders to identify potential trend confirmations and divergences more effectively. For instance, a trader might use a 1-hour RSI alongside a daily RSI to ensure that short-term trades align with the bro
FREE
Os compradores deste produto também adquirem
Gann Made Easy
Oleg Rodin
4.85 (82)
Gann Made Easy é um sistema de negociação Forex profissional e fácil de usar, baseado nos melhores princípios de negociação usando a teoria do sr. W. D. Gann. O indicador fornece sinais precisos de COMPRA e VENDA, incluindo níveis de Stop Loss e Take Profit. Você pode negociar mesmo em movimento usando notificações PUSH. Entre em contato comigo após a compra! Vou compartilhar minhas dicas de negociação com você e ótimos indicadores de bônus de graça! Provavelmente você já ouviu muitas vezes sobr
- Real price is 80$ - 40% Discount ( It is 49$ now ) Contact me for instruction, add group and any questions! Related Product:  Bitcoin Expert , Gold Expert Introduction The breakout and retest strategy is traded support and resistance levels. it involves price breaking through a previous level.  The break and retest strategy is designed to help traders do two main things, the first is to avoid false breakouts. Many false breakouts start with a candlestick that breaks out of a level but ends wi
Atomic Analyst
Issam Kassas
5 (2)
Primeiramente, vale ressaltar que este Indicador de Negociação não repinta, não redesenha e não apresenta atrasos, tornando-o ideal tanto para negociação manual quanto automatizada. Manual do utilizador: configurações, entradas e estratégia. O Analista Atômico é um Indicador de Ação de Preço PA que utiliza a força e o momentum do preço para encontrar uma vantagem melhor no mercado. Equipado com filtros avançados que ajudam a remover ruídos e sinais falsos, e aumentam o potencial de negociação.
Enigmera
Ivan Stefanov
5 (3)
ENIGMERA: O núcleo do mercado https://www.enigmera.com Introdução Este indicador e sistema de negociação é uma abordagem notável aos mercados financeiros. ENIGMERA utiliza os ciclos fractais para calcular com precisão os níveis de suporte e resistência. Mostra a autêntica fase de acumulação e dá direcções e objectivos.  Um sistema que funciona quer estejamos numa tendência ou numa correção.  Como é que funciona? O ENIGMERA é composto por três linhas: a linha de suporte/resistência, a linha
Gold Stuff
Vasiliy Strukov
4.89 (239)
Gold Stuff-um indicador de tendência projetado especificamente para o ouro, também pode ser usado em qualquer instrumento financeiro. O indicador não é redesenhado ou atrasado. O timeframe recomendado é H1. O EA Gold Stuff Expert Advisor está escrito neste indicador, você pode encontrá-lo no meu perfil. Importante! Entre em contato comigo imediatamente após a compra para obter instruções e bônus!  Você pode obter uma cópia gratuita do nosso indicador Strong Support e Trend Scanner, envie um
Trend Punch
Mohamed Hassan
4.95 (19)
This indicator is unstoppable when combined with our other indicator called  Support & Resistance . After purchase, send us a message and you will get it   for  FREE as a BONUS! Introducing Trend Punch , the revolutionary forex trend indicator that will transform the way you trade! Trend Punch is uniquely designed to provide precise buy and sell arrows during strong market trends, making your trading decisions clearer and more confident. Whether you're trading major currency pairs or exotic sym
Trend Screener
STE S.S.COMPANY
4.8 (87)
Indicador de tendência, solução única inovadora para negociação e filtragem de tendências com todos os recursos de tendências importantes construídos dentro de uma ferramenta! É um indicador multi-timeframe e multi-moedas 100% sem repintura que pode ser usado em todos os símbolos/instrumentos: forex, commodities, criptomoedas, índices e ações. OFERTA POR TEMPO LIMITADO: O indicador Support and Resistance Screener está disponível por apenas US$ 50e vitalício. (Preço original US$ 250) (oferta este
Scalper Inside PRO
Alexey Minkov
4.73 (56)
An exclusive indicator that utilizes an innovative algorithm to swiftly and accurately determine the market trend. The indicator automatically calculates opening, closing, and profit levels, providing detailed trading statistics. With these features, you can choose the most appropriate trading instrument for the current market conditions. Additionally, you can easily integrate your own arrow indicators into Scalper Inside Pro to quickly evaluate their statistics and profitability. Scalper Inside
TPSpro RFI Levels
Roman Podpora
4.82 (22)
INSTRUÇÕES         Russo   -        ENG       R   ecomendado para uso com um indicador       -       TPSpro   TREND PRO -   Versão MT4         Um elemento-chave na negociação são as zonas ou níveis a partir dos quais as decisões de comprar ou vender um instrumento de negociação são tomadas. Apesar das tentativas dos principais participantes de esconder sua presença no mercado, eles inevitavelmente deixam rastros. Nossa tarefa era aprender como identificar esses rastros e interpretá-los corretame
Dynamic Forex28 Navigator - A ferramenta de negociação Forex de última geração. ATUALMENTE 49% DE DESCONTO. Dynamic Forex28 Navigator é a evolução dos nossos indicadores populares de longa data, combinando o poder de três em um: Indicador Advanced Currency Strength28 (695 avaliações) + Advanced Currency IMPULSE com ALERTA (520 avaliações) + Sinais CS28 Combo (Bônus). Detalhes sobre o indicador https://www.mql5.com/en/blogs/post/758844 O que o Next-Generation Strength Indicator oferece?  T
TPSproTREND PrO
Roman Podpora
4.79 (19)
TPSpro TREND PRO   é um indicador de tendência que analisa automaticamente o mercado e fornece informações sobre a tendência e cada uma de suas mudanças, além de dar sinais para entrar em negociações sem redesenhar! O indicador utiliza cada vela, analisando-as separadamente. referindo-se a diferentes impulsos - impulso para cima ou para baixo. Pontos de entrada exatos em transações de moedas, criptomoedas, metais, ações, índices! Versão MT5                   DESCRIÇÃO COMPLETA DO INDICADOR    
FX Power MT4 NG
Daniel Stein
5 (13)
Receba a sua atualização diária do mercado com detalhes e screenshots através do nosso Morning Briefing aqui no mql5 e no Telegram ! O FX Power MT4 NG é a próxima geração do nosso medidor de força de moeda muito popular de longa data, o FX Power. E o que é que este medidor de força da próxima geração oferece? Tudo o que adorou no FX Power original MAIS Análise de força GOLD/XAU Resultados de cálculo ainda mais precisos Períodos de análise configuráveis individualmente Limite de cálculo personal
Actualmente 20% OFF ! A melhor solução para qualquer novato ou comerciante especializado! Este software de painel de instrumentos está a funcionar em 28 pares de moedas. É baseado em 2 dos nossos principais indicadores (Advanced Currency Strength 28 e Advanced Currency Impulse). Dá uma grande visão geral de todo o mercado Forex. Mostra valores avançados de força da moeda, velocidade de movimento da moeda e sinais para 28 pares de divisas em todos os (9) períodos de tempo. Imagine como a sua
MetaBands M4
Vahidreza Heidar Gholami
5 (2)
MetaBands utiliza algoritmos poderosos e únicos para desenhar canais e detectar tendências, a fim de fornecer aos traders pontos potenciais para entrar e sair de negociações. É um indicador de canal mais um indicador de tendência poderoso. Inclui diferentes tipos de canais que podem ser mesclados para criar novos canais simplesmente usando os parâmetros de entrada. O MetaBands usa todos os tipos de alertas para notificar os usuários sobre eventos de mercado. Recursos Suporta a maioria dos algori
TrendMaestro
Stefano Frisetti
5 (3)
note: this indicator is for METATRADER4, if you want the version for METATRADER5 this is the link:  https://www.mql5.com/it/market/product/108106 TRENDMAESTRO ver 2.4 TRENDMAESTRO recognizes a new TREND in the bud, he never makes mistakes. The certainty of identifying a new TREND is priceless. DESCRIPTION TRENDMAESTRO identifies a new TREND in the bud, this indicator examines the volatility, volumes and momentum to identify the moment in which there is an explosion of one or more of these data a
Stratos Pali
Michela Russo
5 (1)
Stratos Pali Indicator   is a revolutionary tool designed to enhance your trading strategy by accurately identifying market trends. This sophisticated indicator uses a unique algorithm to generate a complete histogram, which records when the trend is Long or Short. When a trend reversal occurs, an arrow appears, indicating the new direction of the trend. Important Information Revealed Leave a review and contact me via mql5 message to receive My Top 5 set files for Stratos Pali at no cost! D
Antes de tudo, vale ressaltar que esta Ferramenta de Negociação é um Indicador Não Repintante, Não Redesenhante e Não Atrasado, o que a torna ideal para negociação profissional. Curso online, manual do utilizador e demonstração. O Indicador de Conceitos de Ação de Preço Inteligente é uma ferramenta muito poderosa tanto para traders novos quanto experientes. Ele combina mais de 20 indicadores úteis em um único, combinando ideias avançadas de negociação como Análise do Trader do Círculo Interno e
Scalper Vault
Oleg Rodin
5 (27)
Scalper Vault é um sistema profissional de escalpelamento que fornece tudo o que você precisa para um escalpelamento bem-sucedido. Este indicador é um sistema de negociação completo que pode ser usado por comerciantes de forex e opções binárias. O período de tempo recomendado é M5. O sistema fornece sinais de seta precisos na direção da tendência. Ele também fornece sinais superiores e inferiores e níveis de mercado Gann. Os indicadores fornecem todos os tipos de alertas, incluindo notificações
ACTUALMENTE 31% DE DESCONTO!! A melhor solução para qualquer novato ou comerciante especializado! Este indicador é uma ferramenta comercial única, de alta qualidade e acessível, porque incorporámos uma série de características proprietárias e uma fórmula secreta. Com apenas UM gráfico, dá alertas para todos os 28 pares de moedas. Imagine como a sua negociação irá melhorar porque é capaz de identificar o ponto exacto de desencadeamento de uma nova tendência ou oportunidade de escalada! Con
Matrix Arrow Indicator MT4
Juvenille Emperor Limited
5 (3)
O Matrix Arrow Indicator MT4 é uma tendência única 10 em 1 seguindo um indicador multi-timeframe 100% sem repintura que pode ser usado em todos os símbolos/instrumentos: forex, commodities, criptomoedas, índices, ações. O Matrix Arrow Indicator MT4 determinará a tendência atual em seus estágios iniciais, reunindo informações e dados de até 10 indicadores padrão, que são: Índice de movimento direcional médio (ADX) Índice de canal de commodities (CCI) Velas clássicas de Heiken Ashi Média Móvel Di
Black dragon indicator
Ramil Minniakhmetov
4.85 (110)
O indicador de detecção de tendências complementará qualquer estratégia e também pode ser usado como uma ferramenta independente. Recomendações para trabalhar com o indicador, você pode baixar no comentário #8 Vantagens Fácil de usar, não sobrecarrega o gráfico com informações desnecessárias; Pode ser usado como filtro para qualquer estratégia; Possui níveis integrados de suporte e resistência dinâmicos, que podem ser usados ​​tanto para fins de lucro quanto para definir stop-loss; O indi
Ultimate Gold Advisor para MetaTrader 4 – Sua Ferramenta de Trading de Ponta para Sucesso Garantido! O Ultimate Gold Advisor é muito mais do que um simples indicador: é a joia tecnológica que revolucionará sua abordagem ao trading no MetaTrader 4. Projetado para atender às necessidades dos traders mais exigentes, este indicador de ponta combina precisão cirúrgica, análise sofisticada e funcionalidades poderosas para te oferecer uma vantagem competitiva imbatível nos mercados. Ideal para o tradin
Currency Strength Wizard é um indicador muito poderoso que fornece uma solução completa para uma negociação bem-sucedida. O indicador calcula o poder deste ou daquele par forex usando os dados de todas as moedas em vários intervalos de tempo. Esses dados são representados em uma forma de índice de moeda fácil de usar e linhas de energia de moeda que você pode usar para ver o poder desta ou daquela moeda. Tudo o que você precisa é anexar o indicador ao gráfico que deseja negociar e o indicador mo
FX Volume
Daniel Stein
4.58 (33)
Receba a sua atualização diária do mercado com detalhes e screenshots através do nosso Morning Briefing aqui no mql5 e no Telegram ! O Volume FX é o PRIMEIRO e ÚNICO indicador de volume que fornece uma visão REAL do sentimento do mercado do ponto de vista de um corretor. Ele fornece uma visão incrível de como os participantes do mercado institucional, como corretores, estão posicionados no mercado Forex, muito mais rápido do que os relatórios COT. Ver essas informações diretamente no seu gráfi
Entry Points Pro
Yury Orlov
4.62 (175)
Este é um indicador para MT4 que fornece sinais precisos para entrar em uma negociação sem redesenhar. Ele pode ser aplicado a qualquer ativo financeiro: forex, criptomoedas, metais, ações, índices. Ele fornecerá estimativas bastante precisas e informará quando é melhor abrir e fechar um negócio. Assista o vídeo (6:22) com um exemplo de processamento de apenas um sinal que compensou o indicador! A maioria dos traders melhora seus resultados de negociação durante a primeira semana de negociação c
Quantum Breakout Indicator PRO
Bogdan Ion Puscasu
4.96 (25)
Apresentando       Quantum Breakout PRO   , o inovador Indicador MQL5 que está transformando a maneira como você negocia Breakout Zones! Desenvolvido por uma equipe de traders experientes com experiência em negociação de mais de 13 anos,   o Quantum Breakout PRO   foi projetado para impulsionar sua jornada comercial a novos patamares com sua estratégia inovadora e dinâmica de zona de rompimento. O Quantum Breakout Indicator lhe dará setas de sinal em zonas de breakout com 5 zonas-alvo de luc
ACTUALMENTE COM 26% DE DESCONTO A melhor solução para qualquer novato ou comerciante especializado! Este Indicador é uma ferramenta comercial única, de alta qualidade e acessível, porque incorporámos uma série de características proprietárias e uma nova fórmula. Com apenas UM gráfico, pode ler a força da moeda para 28 pares de Forex! Imagine como a sua negociação irá melhorar porque é capaz de apontar o ponto exacto do gatilho de uma nova tendência ou oportunidade de escalada? Manual do u
Torne-se um Negociador Breaker e lucre com as mudanças na estrutura do mercado à medida que o preço reverte. O indicador de quebra de bloco de pedidos identifica quando uma tendência ou movimento de preço está chegando à exaustão e pronto para reverter. Ele o alerta sobre mudanças na estrutura do mercado, que normalmente ocorrem quando uma reversão ou uma grande retração está prestes a ocorrer. O indicador usa um cálculo proprietário que identifica rupturas e momento do preço. Toda vez que
IX Power MT4
Daniel Stein
5 (5)
O IX Power traz finalmente a precisão imbatível do FX Power para símbolos não-Forex. Determina com exatidão a intensidade das tendências a curto, médio e longo prazo nos seus índices, acções, mercadorias, ETFs e até criptomoedas favoritos. Pode analisar tudo o que o seu terminal tem para oferecer. Experimente e veja como o seu timing melhora significativamente quando negoceia. Características principais do IX Power Resultados de cálculo 100% precisos e sem repintura - para todos os símb
PowerBall Signals é um indicador de sinais de COMPRA/VENDA baseado na ideia de usar zonas de suporte/resistência. O indicador detecta padrões de reversão especiais com base em zonas de suporte/resistência e fornece esses sinais em seu gráfico. A ideia principal do indicador é usar a análise MTF (Multi Time Frame) e fornecer sinais com base nos níveis do seu período atual e do próximo período superior. Este método permite prever possíveis reversões de preços em qualquer mercado, seja ele de moeda
Filtro:
zofesu
350
zofesu 2023.04.02 16:52 
 

So far, the best stochastic that shows a long-term trend and at the same time a short-term reversal

maxfire54
269
maxfire54 2022.06.21 01:15 
 

in this system which I find interesting there is no reference to the periods suitable for it. You can suggest or tell us Thank you

iAMMT4
84
iAMMT4 2022.02.24 19:49 
 

thanks for sharing

boghrat21
152
boghrat21 2021.09.14 10:24 
 

wonderful

Junichi Sato
525
Junichi Sato 2021.07.29 09:14 
 

It's very good, but if you change the # 0 line from a dotted line to a normal line and then change the timeframe, it will return to the dotted line. I hope it will be repaired.

Dusan Resin
3245
Resposta do desenvolvedor Dusan Resin 2022.02.18 13:18
Thank you for the comment! That bug is fixed in the new version (1.1)
Roman Iakobson
120
Roman Iakobson 2021.01.21 18:26 
 

Super indicator

vghanem
244
vghanem 2020.03.26 12:31 
 

Great indicator. I have personally profited from incorporating this indicator into my swing trading method. What it lacks is push notification. Can you add alert for when 1. The fastest stochastic (dashed lines) line crosses in and out of OB/OS.

2. Crosses in and out of OB/OS and crosses at least one of the slower stochastic lines (solid lines)?

mark epsley
290
mark epsley 2019.07.31 16:53 
 

O usuário não deixou nenhum comentário para sua avaliação

Victor Manuel Valderrama Zamora
7811
Victor Manuel Valderrama Zamora 2019.04.10 21:23 
 

O usuário não deixou nenhum comentário para sua avaliação

sunnychow
8902
sunnychow 2019.03.17 17:36 
 

O usuário não deixou nenhum comentário para sua avaliação

Michael Vincent Caumban
117
Michael Vincent Caumban 2018.08.16 23:23 
 

O usuário não deixou nenhum comentário para sua avaliação

Matthew Todorovski
12938
Matthew Todorovski 2018.06.30 14:05 
 

O usuário não deixou nenhum comentário para sua avaliação

Gennadiy Voltornist
11909
Gennadiy Voltornist 2017.11.19 18:23 
 

O usuário não deixou nenhum comentário para sua avaliação

amfels07
493
amfels07 2017.11.11 04:56 
 

what an awesome indicator............thank you so much for your efforts they are amazing only if you feel the market condition or as I call it the waves!! Very useful tool

Ali irwan
5135
Ali irwan 2017.07.25 01:08 
 

O usuário não deixou nenhum comentário para sua avaliação

Berk Turker
417
Berk Turker 2017.07.01 15:36 
 

O usuário não deixou nenhum comentário para sua avaliação

Responder ao comentário
Versão 1.1 2021.11.30
- Better UX
- Speed Improvement
- Minor Bug Fix
- Used Latest Compiler