• Visão global
  • Comentários
  • Discussão
  • O que há de novo

Graphic Order Tool

Graphic Order Tool

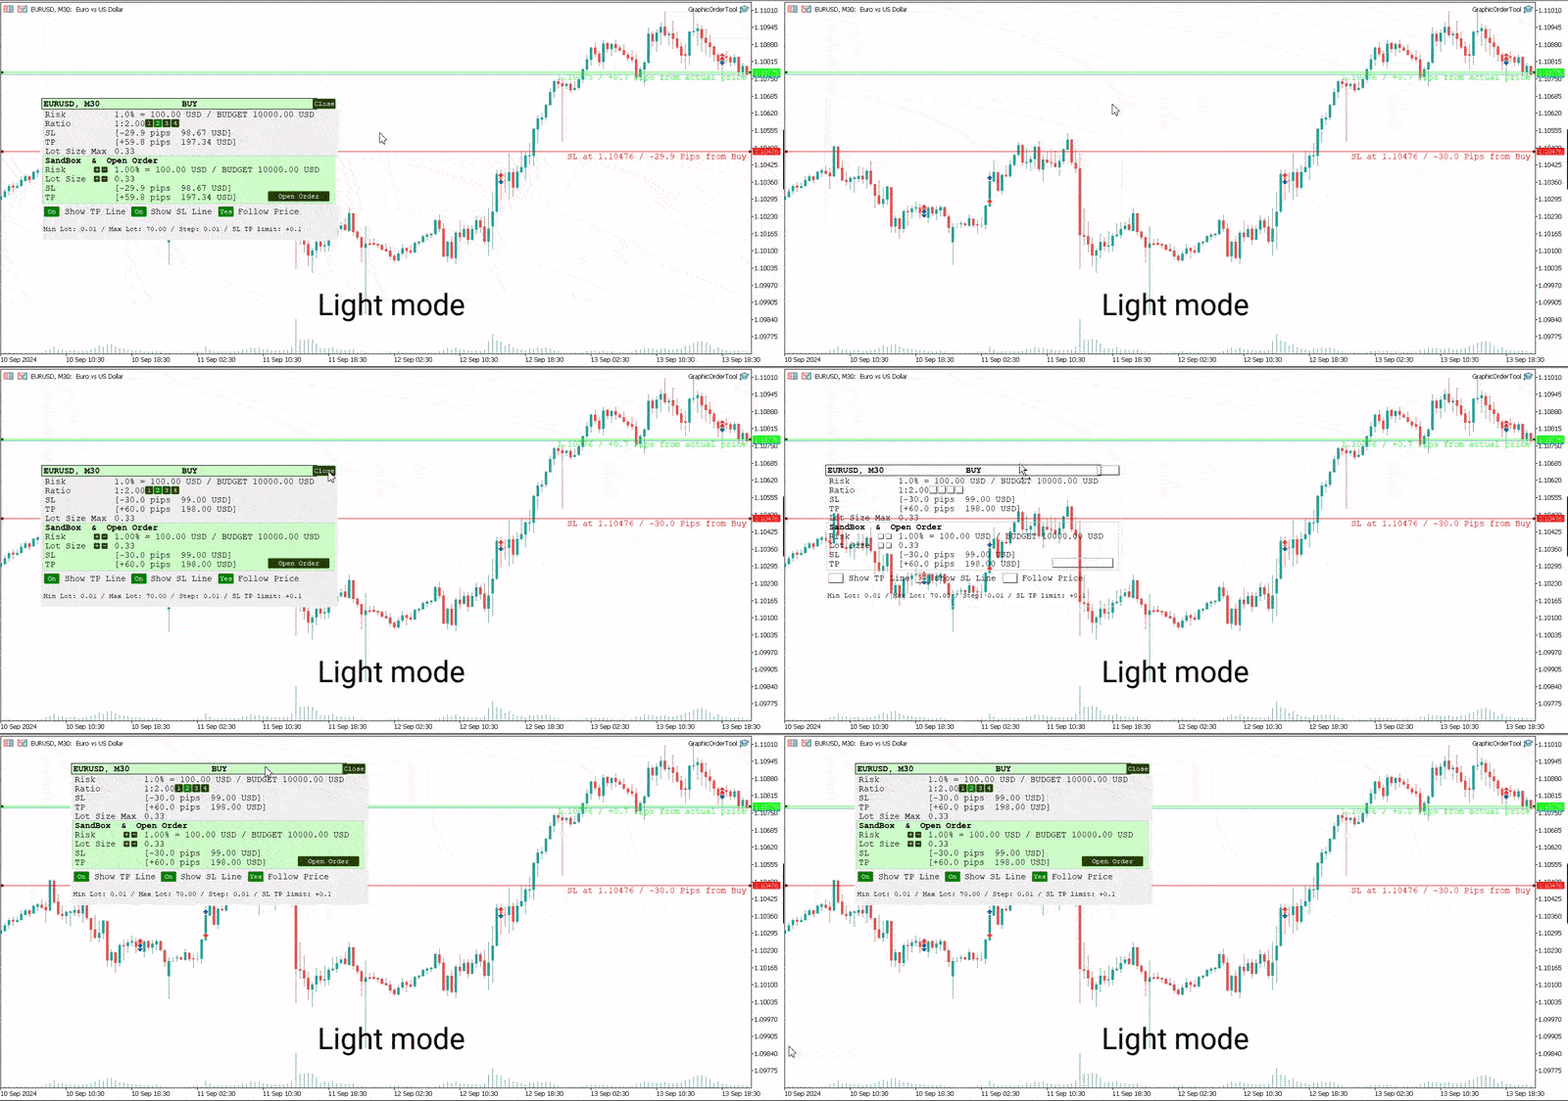
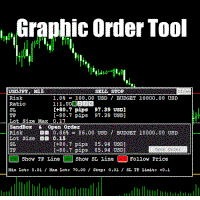
Graphic panel to help trader to make orders.

Drag TP line, SL line and/or ENTRY line with immediate calculation of the profit and loss in pips and USD.

Risk management: Set % of your balance you can risk in the order to make it safe for your money.

Automatically detect the type of possible order (BUY, SELL, BUY_STOP, SELL_LIMIT, BUY_LIMIT, SELL_STOP) depending on mode (BUY/SELL) and position of lines ENTRY, TP, SL.

Panel is semi-transparent, not to cover the main chart.

Description
  • Order Data Calculations
Graphic panel calculates all the data necessary to place an order:
- determines order type: BUY, SELL, BUY_STOP, SELL_STOP, BUY_LIMIT, or SELL_LIMIT,
- calculates volume of order in lots, depending on determined level of risk,
- allows to drag entry level ENTRY and calculates current line price and deviation from current security price in pips,
- set Stop Loss level SL (by default and by dragging) - determines price, deviation from ENTRY, amount of loss in USD and pips,
- set Take Profit level TP (by ratio to SL and by dragging)- price, deviation from ENTRY, amount of earning in USD and pips.
  • Risk Level
Choose the amount of money you are willing to risk in the order by setting the Risk Management information:
- initial budget:
  - BALANCE (the balance of your trading account at the time of settlement), or
  - EQUITY  (the equity of your trading account ), or
  - fixed budget as a basis of trading (BUDGET),
- % (percentage) of initial budget to apply to the order (example: 1%).

The value RISK = (BUDGET * Percentage) is used as the basis for calculating two mutually dependent values:
- the Stop Loss SL value (in USD), which should be less or equal to the RISK, and
- the volume of the order (in lots),  which will be determined in assumption that the whole RISK is applied.
  • Stop Loss Level
If SL level is approximately close to ENTRY level, volume can be larger, and as soon as SL line moves away from the ENTRY, volume decreases and can reach a minimal value, usually = 0.01 lot. (The minimal lot value is determined for each security).

The initial value of SL in pips is a parameter to set when the tool is activated.    
Anyway, this value can easily be changed by dragging the SL line in any direction: closer to ENTRY or further from ENTRY.
Usually the trader sets the SL line looking at Support and Resistance levels.
  • Take Profit Level
Take Profit level is determined by the Ratio parameter. The initial value is set to Ratio = 2.0, which means that the trader expects to earn 2 times more than to (possibly) lose. There are buttons 1 - 2 - 3 - 4 to set one of the fixed ratio levels (1.0, 2.0, 3.0 or 4.0).

Example: If ratio is equal to 3 - TP level is set to earn 3 times more than to lose.

Anyway, the trader can manually drag TP line, increasing or decreasing the expected profit of the order. After each TP line movement the current Ratio value is recalculated and displayed on the Ratio line.
  • Trade Modes
Two modes of tool usage are supported: BUY and SELL.
Actual price of the security is set to "Ask" in BUY mode and to "Bid" in SELL mode.  

BUY mode includes three options: BUY, BUY_STOP, and BUY_LIMIT.

Basic mode is : BUY. But if manually drag ENTER line UP or DOWN - the order turns into postponed order
- BUY_STOP : to ask a broker to open a long position at a price higher than the current price
- BUY_LIMIT : respectively to open a long position at a price lower than the current price.

The same for SELL mode:
- SELL_STOP : to open a short position at a price lower than the current price.
- SELL_LIMIT : to open a short position at a price higher than the current price.

Each time you drag the ENTER line, the Follow Price button turns red, indicating that the ENTER line is moved beyond the current price line. To return to the basic mode (just BUY, or SELL), press Follow Price button, it will turn green.
  • Sandbox and Open Order Action
Sandbox is used to play with order volume.

Use buttons "+" and "-" to increase/decrease values of Risk and Lot Size:
- increasing Risk you want to earn more: lot Size is increased too.
- increasing/decreasing Lot Size you set order volume to the value you want. Risk is recalculated after every change of Lot Size.

After all the lines and risk settings are set you will see that the following data on the Graphic Tool are settled:
- trade mode;
- entry level (don't forget, after dragging ENTRY line you set the order type);
- Stop Loss  level;
- Take Profit level;
- Lot Size,

you can press *Open Order* button to open order you just configured.
  • UI
- Title
  - security name (symbol), time-frame;
  - order type;
- Order information
  - risk calculation base;
  - ratio for Take Profit calculation;
  - Stop Loss info;
  - Take Profit info;
  - order volume calculation
- Sandbox
  - risk percentage variation
  - order volume variation
  - Stop Loss info
  - Take Profit info
  - Open Order button
- Buttons
  - Show TP Line
  - Show SL Line
  - Follow Price
- Lot size information
  • UX
- Keyboard buttons
  - "B" - keyboard button "B" activates BUY mode and displays the Graphic Tool
  - "S" - keyboard button "S" activates SELL mode and displays the Graphic Tool
  - "C" - keyboard button "C" removes the Tool from the screen (except the SL, TP and ENTRY lines)
- Mouse
  - drag the Tool to move it (grab by the header)
  - button "Close" on the right top corner of the Tool
- Tool buttons
  - "Show TP Line" :
  - "Show SL Line" ON/OFF
  - "Follow Price" ON/OFF
  • Instructions
  1. Download *GraphicOrderTool* to MT5 terminal (**Experts** folder).
  2. Activate *GraphicOrderTool* on some security graph.
    1. Fill parameters - set BALANCE/EQUITY or BUDGET.
    2. If BUDGET is chosen - populate value of budget.
    3. Choose Risk percentage.
    4. Choose initial TP level in pips.
    5. Press OK.
  3. Place mouse on the graph canvas (to allow *GraphicOrderTool* to handle graph events)
  4. Press "B" or "S" on the keyboard - *GraphicOrderTool* is appeared on the canvas
  5. Drag SL line to the preferred price level
  6. Choose risk ratio level or drag TP line
  7. Inspect calculated values of SL and TP in the USD currency
  8. Use Sandbox to play with values of risk and lot size


Drag ENTER line if you prefer to use deferred orders


You can manually drag the TP line, SL line and ENTRY line with immediate calculation od the profit and loss in USD.

Risk management: You can set % of your balance you can involve into the order to make it safe for your money.

Application automatically detects the type of possible order (BUY, SELL, BUY_STOP, SELL_LIMIT, BUY_LIMIT, SELL_STOP) depending on position of lines ENTRY, TP, SL.
  • Development
Basic idea and initial solution is taken from William Roeder MT4 Order Tool. Graphics is fully reworked into MT5 style using graphic objects and C++ classes.

Produtos recomendados
DM IND Exclusive
Sergio Vidal Prado
Indicador Para Opções Binarias. Indicator for Binary Options Usa dois gales. Instalar em mt5 Esse indicador é para ser usado no tempo de vela de 5 minutos e em M5. Este também funciona em M1, porém é mais eficiente em M5. Só descompactar e copiar os arquivos na pasta de dados do seu MT5. Arquivos indicator na pasta MQL5 - Indicator. Baixe também a Media Movel totalmente gratis: https://www.mql5.com/pt/market/product/50400 Esse Indicador é para a próxima vela. Apareceu a seta, só aguardar a pr
Pivots Lines
Abakou Nazaire Ayelenou
Desenha pontos pivôs Traditionnal, Fibonacci, Woodie, Classic, Demark, Camarilla para qualquer período de tempo Apoiar todo o tipo de pivot Traditionnal, Fibonacci, Woodie, Classic, Demark, Camarilla Apoiar qualquer período de tempo (M1...H1...D1...MN1...Anualmente) Servidor de apoio Horário de Verão Apoio forex secção diária de Sydney aberta para os EUA Fechar Apoiar o comércio Crypto Preencher a lacuna entre o pivot e a tendência, muito útil Os pontos pivot mostram a direcção da tendência
FREE
ClickDrag desenha linhas e move objectos no gráfico facilmente. Clique e depois Drag para começar a desenhar uma linha de tendência. Movendo o rato na horizontal, desenha uma linha de preço. Movendo o rato na vertical, desenha uma linha de data. As linhas e objectos existentes podem ser movidos pela Click&Drag. Mostra o preço e a diferença de tempo entre o ponto inicial e o ponto final. Após o ponto inicial Click&Drag, Sacudir a esquerda e a direita para mudar a cor.
FREE
Utilities
Douglas Lucio De Araujo
Indicador com 3 funcionalidades - Relógio : Relógio independente do gráfico, não para a contagem mesmo com o mercado fechado. - Template : Após definir uma configuração em qualquer gráfico, seja padrões de cores, indicadores, zoom... A configuração será copiada para todos os gráficos ativos. - TimeFrame : Defina o TimeFrame em um gráfico, e com apenas um clique todos os gráficos ativos serão alterados para o mesmo TimeFrame.
"Battles between bulls and bears continue to influence price development long after the combat has ended, leaving behind a messy field that observant technicians can use to manage risk and find opportunities. Apply "trend mirror" analysis to examine these volatile areas, looking for past action to impact the current trend when price turns and crosses those boundaries." RSI Mirrors and Reflections is a robust technique using multiple RSI periods, mirrors and reflections based on RSI values to ind
Bar Sequential
Maximiliano Frisione Figueroa
This indicator can help you clearly identify trend changes in both bullish and bearish markets. The indicator compares the closing price of the last candle with the closing price of the candle "X" periods ago (input parameter). In an uptrend, an initial number '1' is plotted if a candle closes higher than the closing of a candle "X" periods ago. In a downtrend, an initial number '1' is plotted if a candle closes below the closing of a candle "X" periods ago. Subsequent numbers are plotted when e
FREE
A useful feature may be to determine the normal frequency of round-sized trades, and monitor deviations from that expected value. The ML algorithm could, for example, determine if a larger-than-usual proportion of round-sized trades is associated with trends, as human traders tend to bet with a fundamental view, belief, or conviction. Conversely, a lower-than-usual proportion of round-sized trades may increase the likelihood that prices will move sideways, as silicon traders do not typically hol
Controles do Telegram (Telecontrol)   — vincula o   bot do Telegram   e o terminal   MetaTrader 5   , fornecendo sinais de negociação avançados no Telegram e integração MT5 para Telegram . Ele ajuda a agregar dados de vários terminais e gerenciá-los usando um bot no   Telegram . O serviço é conveniente para trabalhar com vários terminais MT5, permitindo que cada terminal seja configurado individualmente para uma exibição e percepção otimizadas das informações. Todos os dados do terminal são cole
FREE
Trend Dynamics
Oleksandr Powchan
Trend Dynamics Expert Advisor is a level trader designed to be as precise as possible. Because of the extreme accuracy of the entries and the algorithms ability to filter out bad trades, the system does not take new trades every day. The system was not optimized and has fixed indicator settings as its universally adaptable. Be aware, that its recomended to run multiple pairs on the same account for more profit. Our Goal is to help you be way more profitable and way more stress free, so yo
As estruturas de mercado são aquelas que, quando quebradas em um período de tempo mais alto, podem ajudar a limpar uma tendência para um trader. 1. Este indicador irá desenhar o ZigZag para apenas 2 últimas estruturas (alta e baixa anterior do ZigZag) e uma nova barra do ZigZag só será formada quando ocorrer a quebra da estrutura 2. Dá notificação de terminal e push sobre quebra de estrutura 3. Aumente e diminua a profundidade do ZigZag das teclas [ e ] para ajustar o balanço 4. Alte
Ice Pivot points
Benbyaanda Silvere Henri Sedric Kabore
Pivot points have been a trading strategy for a long time, originally used by floor traders. Using this method, you can understand where the market is going in a day through a few simple calculations. The pivot point in the pivot point method is the turning point of the market direction during the day. A series of points can be obtained by simply calculating the high, low and closing price of the previous day. These points may form key support and resistance lines. The pivot point, support an
FREE
AutoLevels
Maxim Kuznetsov
Automatic calculation and marking of resistance and price reversal levels. The script will perform statistical calculations and plot a regular grid on which the quote moves on the graph. These levels are very stable. Use them in trading planning and for placing pending orders. Just select a timeframe and AutoLevels will indicate the important places of the chart in the form of horizontal lines. Solid lines indicate more "dense" areas - areas of price reversal, where the quote happens more o
The utility draws pivot levels for the selected timefram in classic method. Pivot = (high + close + low) / 3 R1 = ( 2 * Pivot) - low S1 = ( 2 * Pivot) - high R2 = Pivot + ( high - low ) R3 = high + ( 2 * (Pivot - low)) S2 = Pivot - (high - low) S3 = low - ( 2 * (high - Pivot)) you can change the timeframe, colors and fontsize. also you can change the text for the levels. Have fun and give feedback...
FREE
Start Display N Bars
Ricardo Almeida Branco
5 (1)
Você já conhece o Display N Bars? Já conhece a ferramenta Start (dos indicadores Midas)? Neste indicador unificamos as duas ferramentas permitindo que você possa definir em qual candle vai começar a contagem, ou utilizar a numeração automática que já era disponível na versão anterior. Segue descrição do utilitário: Display N Bars O utilitário Display N Bars é uma ferramenta simples que tem o objetivo de ajudar na identificação dos candles. Se um trader tenta compartilhar o conhecimento com
The   ICT Propulsion Block   indicator is meant to detect and highlight propulsion blocks, which are specific price structures introduced by the Inner Circle Trader (ICT). Note: Multiple Timeframe version avaiable at here  Propulsion Blocks are essentially blocks located where prices interact with preceding order blocks. Traders often utilize them when analyzing price movements to identify potential turning points and market behavior or areas of interest in the market.   USAGE (fingur
VWAP Cloud
Flavio Javier Jarabeck
4.22 (9)
Do you love VWAP? So you will love the VWAP Cloud . What is it? Is your very well known VWAP indicator plus 3-levels of Standard Deviation plotted on your chart and totally configurable by you. This way you can have real Price Support and Resistance levels. To read more about this just search the web for "VWAP Bands" "VWAP and Standard Deviation". SETTINGS VWAP Timeframe: Hourly, Daily, Weekly or Monthly. VWAP calculation Type. The classical calculation is Typical: (H+L+C)/3 Averaging Period
FREE
High And Low MT5
Dmitriy Parfenovich
On the current chart, this indicator displays candlestick highs and lows of another time frame. Input Parameters: TimeFrame - chart time frame whose data will be displayed on the current price chart (by default, H12). Time Zone - shift of the indicator by time zone relative to the broker's time (by default, Broker-1). If the broker's time zone is UTC+1 and the Time Zone parameter is set to Broker-1, the bends of the indicator will be plotted in multiples of Greenwich Time. Indicator buffer value
NEW VERSION 2023 1.5v B UPDATED 13/01/2024 Rastreador de Agulhadas. PROMO 6 MESES POR 30 USD!!! Este utilitário é um scanner de mercado com base no indicador do índice Didi. Ele pode digitalizar todos os quadros de tempo de Símbolos no Market Watch, o cliente pode personalizar de acordo com a demanda, pode escanear um único símbolo ou mais de 100. Link do Manual: LINK_driver Link do Manual Video: LINK O scanner informa quatro tipos de sinais, todos os alertas fornecidos pelo indicador Didi
SupportResistence
Eduardo Borges Mariani
SupportResistance é um indicador de suporte e resistência dinâmico baseado na máxima e na mínima dos candles anteriores. Os parâmetros de cálculo são configuráveis. Pode-se usar como referência os valores máximos e mínimos do candle anterior ou se pode usar a máxima e a mínima de um grupo de candles anteriores. O indicador utiliza de uma linha vermelha para indicar a resistência e uma linha verde para indicar o suporte. Quando um suporte ou uma resistência é rompida, sua linha fica pontilhada, s
Mt5RiskReward
Santiago Garcia Sanchez
5 (1)
This indicator will help you define the entry, stop loss and take profit by means of horizontal lines on a chart. In addition, it is also possible to calculate the size of a position according to the percentage of the risk that you want to assume. For this purpose, a panel consisting of the following elements is available: Button to show or hide the tool on the chart. A text box to enter the number of contracts to be used for the calculations. A text box to enter the risk/reward ratio you wa
Este indicador de painel de divergência de vários períodos de tempo e vários símbolos envia um alerta quando uma ou duas divergências diferentes foram identificadas em vários intervalos de tempo e não em divergências únicas. Ele pode ser usado com todos os intervalos de tempo de M1 a MN. No máximo 9 períodos de tempo podem ser mostrados no painel ao mesmo tempo. É possível habilitar o filtro de tendência de média móvel, RSI ou bandas de Bollinger para filtrar apenas as configurações mais fortes.
Este indicador de multitemporal e símbolo múltiplo identifica formações superiores / inferiores duplas ou triplas ou um rompimento do decote seguinte (superior / inferior confirmado). Ele oferece RSI, barra de pinos, engolfante, pinça, filtros de estrela da manhã / noite, bem como opções de filtro de divergência, o que torna possível filtrar apenas as configurações mais fortes.       O indicador também pode ser usado no modo de gráfico único. Por favor, leia mais sobre esta opção no produto   bl
Ratio
Radim Kucera
3.67 (3)
This indicator shows ratios between extremes on the chart. You can specify your own ratios (e.g. Fibonacci). Parameters Most important Density - how much in details to search ratios in extremes. Bigger number means less details, smaller number means more details. Base unit is 1 bar on the chart. History - how far to go in history while searching. When you set -1, the indicator processes all bars from history. Base unit is 1 bar on the chart. Range - how far search ratios from given extreme. Ba
FREE
Whether you're an analyst looking for a Fibonacci charting platform for Fibonacci Ratio analysis, or a trader looking for an advanced Fibonacci trading tool, Ultimate Fibonacci  has what you need. Ultimate Fibonacci   has the most advanced and full-featured Fibonacci charting and trading software on the market. GIVE ME A GOOD RATING! Ultimate Fibonacci  measures and calculates Fibonacci projections and Retracement levels for you, as well as Price projections (like Wave 2 vs. 1 or Wave 4 vs. 2
FREE
Este quadro de tempo múltiplo e indicador de vários símbolos procura barras de pinos, estrelas da manhã / noite, engolfamentos, pinças, três linhas de ataque, barras internas e flâmulas e triângulos.   O indicador também pode ser usado no modo de gráfico único. Por favor, leia mais sobre esta opção no produto   blog .   Combinado com suas próprias regras e técnicas, este indicador permitirá que você crie (ou aprimore) seu próprio sistema poderoso. Recursos Pode monitorar todos os símbolos visív
The   Pivot Point indicator   automatically calculates and displays the pivot point line and support and resistance levels. Pivot can be calculated according to the Classic, Floor, Fibonacci, Woodie, Camarilla or DeMark formula. It is also possible to select the period for calculating the indicator. A trader can choose from daily, weekly, monthly, or user-defined periods. Types of pivots Classic Floor Fibonacci Woodie Camarilla DeMark Main features The indicator shows the current and histor
FREE
Horizontal Level indicator - reflects, using a histogram, the horizontal volumes of transactions at a certain price without reference to time. At the same time, the histogram appears directly in the terminal window, and each column of the volume is easily correlated with the quote value of the currency pair. The volume of transactions is of great importance in exchange trading, usually an increase in the number of concluded contracts confirms the trend, and their reduction indicates an imminent
FibExtender
Syed Oarasul Islam
This Indicator draws Fibonacci Extension levels in two different ways. You can select whether to draw Fibonacci Extension levels based on your favourite ZigZag settings or you can let the indicator to draw Fibonacci Extension  level based on given number of Bars or Candles.  You can also set Mobile and Email notification for your favourite Extension  levels individually. With this indicator you will not have to feel lonely as the it can generate Voice alerts, which will keep you focused on your
OneClick Screenshot MT5
Kyra Nickaline Watson-gordon
Description : A utility to create and save screenshots automatically and send to a chat/group/channel on telegram. The saved/sent image file will include all objects that exist on the chart and also all indicators are displayed on the chart. Features: Save screenshot of chart including all objects, indicators, ... Send screenshots to a telegram chat/group/channel Wide range options to select when create screenshots Logo and text adding feature Inputs and How to setup the EA : Variou
CandleBot
Mithlesh Kumar Mandal
Apresentando o CandleBot - Sua Ferramenta Definitiva e Gratuita para Identificar e Negociar Padrões de Candlestick! Com o CandleBot, aproveite a vantagem nos mercados reconhecendo facilmente sinais de engolfo de alta e baixa, estrela da manhã e da noite, e padrões de martelo. Padrões de candlestick, derivados dos preços de abertura, máxima, mínima e fechamento ao longo de um período específico, servem como representações visuais dos movimentos de preços, auxiliando traders na análise do sentimen
FREE
Os compradores deste produto também adquirem
Trade Assistant MT5
Evgeniy Kravchenko
4.38 (164)
Ajuda a calcular o risco por comércio, a fácil instalação de uma nova encomenda, gestão de encomendas com funções de fecho parcial, trailing stop de 7 tipos e outras funções úteis. Atenção, o aplicativo não funciona no testador de estratégia. Você pode baixar a versão Demo na página de descrição  Manual, Description, Download demo Função de linha Mostra no gráfico a linha de Abertura, Stop Loss, Take Profit. Com esta função é fácil definir uma nova ordem e ver as suas características adicion
Você acha que em mercados onde o preço pode mudar em uma fração de segundo, colocar os pedidos deve ser o mais simples possível? No Metatrader, cada vez que você deseja abrir uma ordem, você deve abrir uma janela onde você insere o preço de abertura, stop loss e take profit, bem como o tamanho da negociação. Ao negociar nos mercados financeiros, a gestão de capital é essencial para manter seu depósito inicial e multiplicá-lo. Portanto, quando você deseja fazer um pedido, provavelmente se pergunt
TradePanel MT5
Alfiya Fazylova
4.85 (114)
Trade Panel é um assistente comercial multifuncional. O aplicativo contém mais de 50 funções para negociação manual e permite automatizar a maioria das ações de negociação. Antes de comprar, você pode testar a versão Demo em uma conta demo. Demonstração aqui . Instruções completas aqui . O aplicativo foi concebido como um conjunto de painéis interconectados: Painel para comércio. Projetado para realizar operações comerciais básicas: Abertura de ordens e posições pendentes. Abertura da grade de o
Local Trade Copier EA MT5
Juvenille Emperor Limited
4.99 (68)
Experimente uma cópia de negociação excepcionalmente rápida com o Local Trade Copier EA MT5 . Com sua fácil configuração de 1 minuto, este copiador de negociações permite que você copie negociações entre vários terminais MetaTrader no mesmo computador Windows ou em um Windows VPS com velocidades de cópia ultra rápidas de menos de 0.5 segundos. Seja você um trader iniciante ou profissional, o   Local Trade Copier EA MT5   oferece uma ampla gama de opções para personalizá-lo de acordo com suas ne
The product will copy all telegram signal to MT5 ( which you are member) , also it can work as remote copier.  Easy to set up, copy order instant, can work with almost signal formats, image signal,  s upport to translate other language to English Work with all type of channel or group, even channel have "Restrict Saving Content", work with  multi channel, multi MT5 Work as remote copier: with signal have ticket number, it will copy exactly via ticket number. Support to backtest signal. How to s
Trade Dashboard MT5
Fatemeh Ameri
4.96 (47)
Tired of complex order placement and manual calculations? Trade Dashboard is your solution. With its user-friendly interface, placing orders becomes effortless, by a single click, you can open trades, set stop loss and take profit levels, manage trade lot size, and calculate risk to reward ratios, allowing you to only focus on your strategy. Say goodbye to manual calculations and streamline your trading experience with Trade Dashboard. Download  Demo Version  right now. You can find  Details of
MT5 to Telegram Signal Provider é uma utilidade fácil de usar e totalmente personalizável que permite o envio de sinais especificados para o chat, canal ou grupo do Telegram, tornando sua conta um fornecedor de sinais . Ao contrário da maioria dos produtos concorrentes, ele não usa importações de DLL. [ Demonstração ] [ Manual ] [ Versão MT4 ] [ Versão Discord ] [ Canal do Telegram ] Configuração Um guia do usuário passo a passo está disponível. Não é necessário conhecimento da API do Telegra
Exp COPYLOT CLIENT for MT5
Vladislav Andruschenko
4 (22)
Copiadora de comércio para MT5 é um  comércio   copiadora para a plataforma МetaТrader 5 . Ele copia negociações forex  entre   qualquer conta   MT5  - MT5, MT4  - MT5 para a versão COPYLOT MT5 (ou MT4  - MT4 MT5  - MT4 para a versão COPYLOT MT4) Copiadora confiável! Versão MT 4 Descrição completa +DEMO +PDF Como comprar Como instalar    Como obter arquivos de log    Como testar e otimizar    Todos os produtos da Expforex Você também pode copiar negociações no terminal МТ4 ( МТ4  - МТ4, МТ
Copie os sinais de qualquer canal do qual você seja membro (incluindo privados e restritos) diretamente para o seu MT5.  Esta ferramenta foi projetada com o usuário em mente, oferecendo muitos recursos que você precisa para gerenciar e monitorar as negociações. Este produto é apresentado em uma interface gráfica fácil de usar e visualmente atraente. Personalize suas configurações e comece a usar o produto em minutos! Guia do usuário + Demo  | Versão MT4 | Versão Discord Se deseja experimentar
Attention: this is a multicurrency EA, which trades by several pairs from one chart!  Therefore, in order to avoid duplicate trades, it is necessary to attach EA only to one chart, ---> all trading in all pairs is conducted only from one chart! we can trade simultaneously in three different pairs, as by default (EURUSD + GBPUSD + AUDUSD), which take into account the correlation when entering the market for all three; we can trade only EURUSD (or any currency pair) and at the same time take into
Hedge Ninja
Robert Mathias Bernt Larsson
5 (1)
Make sure to join our Discord community over at www.Robertsfx.com , you can also buy the EA at robertsfx.com WIN NO MATTER IN WHICH DIRECTION THE PRICE MOVES This robot wins no matter in which direction the price moves by following changing direction depending on in which direction price moves. This is the most free way of trading to this date. So you win no matter which direction it moves (when price moves to either of the red lines as seen on the screenshot, it wins with the profit target yo
YuClusters
Yury Kulikov
4.93 (41)
Atenção: A versão demo para revisão e teste está aqui . YuClusters é um sistema profissional de análise de mercado. O trader tem oportunidades únicas para analisar o fluxo de pedidos, volumes de negociação, movimentos de preços usando vários gráficos, perfis, indicadores e objetos gráficos. O YuClusters opera com base em dados de Tempos e Negócios ou informações de ticks, dependendo do que está disponível nas cotações de um instrumento financeiro. O YuClusters permite que você crie gráficos com
Trade copier MT5
Alfiya Fazylova
4.44 (25)
Trade Copier é um utilitário profissional projetado para copiar e sincronizar negociações entre contas de negociação. A cópia ocorre da conta / terminal do fornecedor para a conta / terminal do destinatário, instalada no mesmo computador ou vps. Antes de comprar, você pode testar a versão demo em uma conta demo. Versão de demonstração aqui . Instruções completas aqui . Principais funcionalidades e benefícios: Suporta a cópia de MT5> MT5, MT4> MT5, MT5> MT4, incluindo contas "MT5 netting". Os mod
Mentfx Mmanage mt5
Anton Jere Calmes
4.25 (8)
The added video will showcase all functionality, effectiveness, and uses of the trade manager. Drag and Drop Trade Manager. Draw your entry and have the tool calculate the rest. Advanced targeting and close portions of a trade directly available in tool (manage trades while you sleep). Market order or limit order on either side with factored spread. Just draw the entry, the tool does the rest. Hotkey setup to make it simple. Draw where you want to enter, and the stop loss, the tool calculates al
Trade Manager para ajudá-lo a entrar e sair rapidamente de negociações enquanto calcula automaticamente seu risco. Incluindo recursos para ajudar a evitar negociações excessivas, negociações de vingança e negociações emocionais. As negociações podem ser gerenciadas automaticamente e as métricas de desempenho da conta podem ser visualizadas em um gráfico. Esses recursos tornam este painel ideal para todos os traders manuais e ajudam a aprimorar a plataforma MetaTrader 5. Suporte multilíngue. Vers
Set price targets, and leave everything else to HINN Lazy Trader! This tool is designed for automatic position sizing from specified levels to designated targets. Using a VPS is recommended (*). The demo version   limited in functionality, be sure to watch this video before using -->  https://youtu.be/geLQ6dUzAr8 A community for users, product discussion, update news, and first line of support are organized in a free Discord: https://discord.gg/zFhEZc7QDQ Use Webmoney For payments in cryptocu
News Filter Tool
Apex Software Ltd
5 (1)
Melhore Seu Trading com Insights de Eventos de Notícias No mundo acelerado do trading, eventos de notícias podem impactar significativamente os preços de mercado. Compreender como esses eventos influenciam os movimentos de preço é crucial para gerenciar suas operações durante períodos voláteis. A ferramenta News Tool EA foi projetada para fornecer insights sobre eventos de notícias passados e futuros, ajudando você a tomar decisões de trading mais informadas. Este EA não pode ser executado no
Trade Assistant 38 in 1
Makarii Gubaydullin
4.89 (18)
Ferramenta multifuncional: 65+ funções, incluindo: calculadora de lote, Price Action, proporção R/R, gerenciamento de trade, zonas de suporte e resistência Versão Demo   |   Manual de usuário   |    Versão MT4 O utilitário não funciona no testador de estratégia: você pode baixar a versão Demo AQUI para testar o produto. Contate-me   para perguntas / ideias de melhorias / caso encontrar algum erro Os trades automáticos serão permitidos se estiverem habilitados na plataforma e na corretora Simpli
The News Filter MT5
Leolouiski Gan
4.5 (8)
Este produto filtra todos os consultores especializados e gráficos manuais durante o horário das notícias, para que você não precise se preocupar com picos de preços repentinos que possam destruir suas configurações de negociação manuais ou negociações realizadas por outros consultores especializados. Este produto também vem com um sistema de gerenciamento de pedidos completo que pode lidar com suas posições abertas e ordens pendentes antes do lançamento de qualquer notícia. Depois de comprar o
-25% discount ($199 -> $149) Advanced trading tool: One click smart orders that execute under your conditions Developed by trader for trading community:  position size calculator (lot size), open position after price action, strategy builder, set and forget trading, mobile notifications... Risk Management -  Risk percentage position size calculator, gain percentage, target risk reward ratio, spread and commissions are included in calculations 7 Advanced order types  - Set and forget trading w
RiskGuard Management
MONTORIO MICHELE
5 (13)
ATTENTION the expert does not work in strategy tester, for a trial version visit my profile. Manual RiskGuard Management   RiskGuard management was born with the idea of ​​helping traders from their initial journey to becoming expert and aware traders. Compatible with any operating system whether Mac or Windows. The operations panel is integrated into the graph giving the possibility to choose size and position between right and left, while the various buttons light up when they can be used,
Painel de negociação para negociação em 1 clique. Trabalhando com posições e pedidos! Negociar a partir do gráfico ou do teclado. Com nosso painel de negociação, você pode executar negociações com um único clique diretamente no gráfico e realizar operações de negociação 30 vezes mais rápido do que com o controle MetaTrader padrão. Cálculos automáticos de parâmetros e funções tornam a negociação mais rápida e conveniente para os traders. Dicas gráficas, rótulos informativos e informações completa
Adam FTMO MT5
Vyacheslav Izvarin
5 (2)
ADAM EA Special Version for FTMO Please use ShowInfo= false for backtesting ! Our 1st EA created using ChatGPT technology Trade only GOOD and checked PROP FIRMS  Default parameters for Challenge $100,000 Tested on EURUSD and GBPUSD only  Use 15MIN Time Frame Close all deals and Auto-trading  before Weekend at 12:00 GMT+3  Friday For Prop Firms MUST use special Protector  https://www.mql5.com/en/market/product/94362 -------------------------------------------------------------------------------
Grid Manual MT5
Alfiya Fazylova
4.87 (15)
"Grid Manual" é um painel comercial para trabalhar com uma grade de ordens. O utilitário é universal, possui configurações flexíveis e uma interface intuitiva. Ele trabalha com uma grade de pedidos não apenas na direção da média das perdas, mas também na direção do aumento dos lucros. O trader não precisa criar e manter uma grade de pedidos, tudo será feito pelo ""Grid Manual". Basta abrir um pedido e o "Grid manual" criará automaticamente uma grade de pedidos para ele e trabalhará com ele até q
Cerberus Equity Watcher
Samuel Bandi Roccatello
5 (2)
Cerberus the Equity Watcher é uma ferramenta de gerenciamento de risco que monitora constantemente o patrimônio da sua conta e evita grandes perdas, causadas por EAs defeituosos ou por seu comportamento emocional. É extremamente útil para traders sistemáticos que dependem de EAs que podem conter bugs ou que podem não ter um bom desempenho em condições de mercado inesperadas. Cerberus permite que você defina um valor mínimo de patrimônio e (opcionalmente) um valor máximo, se qualquer um deles for
The  Easy Strategy Builder (ESB)  is a " Do It Yourself " solution that allows you to create a wide range of the automated trading strategies without any line of codes. This is the world’s easiest method to automate your strategies that can be used in STP, ECN and FIFO brokers. No drag and drop is needed. Just by set conditions of your trading strategy and change settings on desired values and let it work in your account. ESB has hundreds of modules to define unlimited possibilities of strategi
The top-selling EAs on the market cost a lot and one day they are suddenly gone. This is because one strategy will not work in the forex market all the time. Our product is unique from all others in the MQL Marketplace because our EA comes with 34+ built-in indicators that allow develop strategies every time.  You build your strategy and keep updating it. If one strategy does not work, simply build another all using only one EA. This is All-In-One EA   in this market place. You can use as trade
Unlimited Trade Copier Pro MT5 is a tool to copy trade remotely to multiple MT4, MT5 and cTrader accounts at different computers/locations over internet. This is an ideal solution for you if you are a signal provider and want to copy your trades to other receivers globally on your own rules. One provider can copy trades to multiple receivers and one receiver can get trade from multiple providers as well. The provider can even set the subscription expiry for each receiver, so that receiver will n
O UTM Manager é uma ferramenta intuitiva e fácil de usar que oferece uma execução de negociação rápida e eficiente. Um dos recursos de destaque é o modo "Ignorar spread", que permite negociar ao preço das velas, ignorando completamente os spreads (por exemplo, permite negociar pares de spread mais alto em LTF, evitando ser retirado de negociações por spread). Outro aspecto importante do UTM Manager é sua copiadora comercial local exclusiva, permitindo a flexibilidade de executar diferentes estra
Este é um painel de negociação visual que ajuda você a realizar e gerenciar operações facilmente, evitando erros humanos e aprimorando sua atividade comercial. Ele combina uma interface visual fácil de usar com uma abordagem sólida de gerenciamento de riscos e posições. [ Guia de instalação | Guia de atualização | Solução de problemas | FAQ | Todos os produtos ] Surpreendentemente fácil de usar Negocie facilmente a partir do gráfico Negocie com gerenciamento preciso de riscos, sem complicações
Filtro:
Sem comentários
Responder ao comentário
Versão 1.1 2024.09.26
1. Added Demo Version capabilities to run in the Strategy Tester. Dragging and keyboard pressing are not allowed in Strategy Tester, so small panel with 3 buttons "B", "S". "C" added. Screenshot with demo run is presented.
2. Fixed bugs, related to Stop Loss Line value calculated,