T3 Signal AM
- Indicadores
- Andriy Matviyevs'kyy
- Versão: 26.6
- Atualizado: 23 outubro 2023
- Ativações: 5
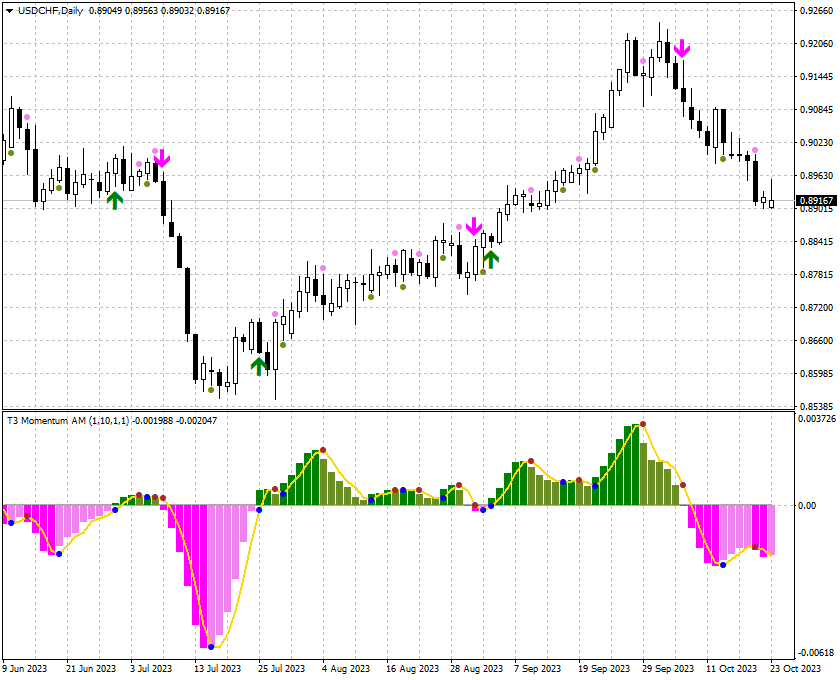
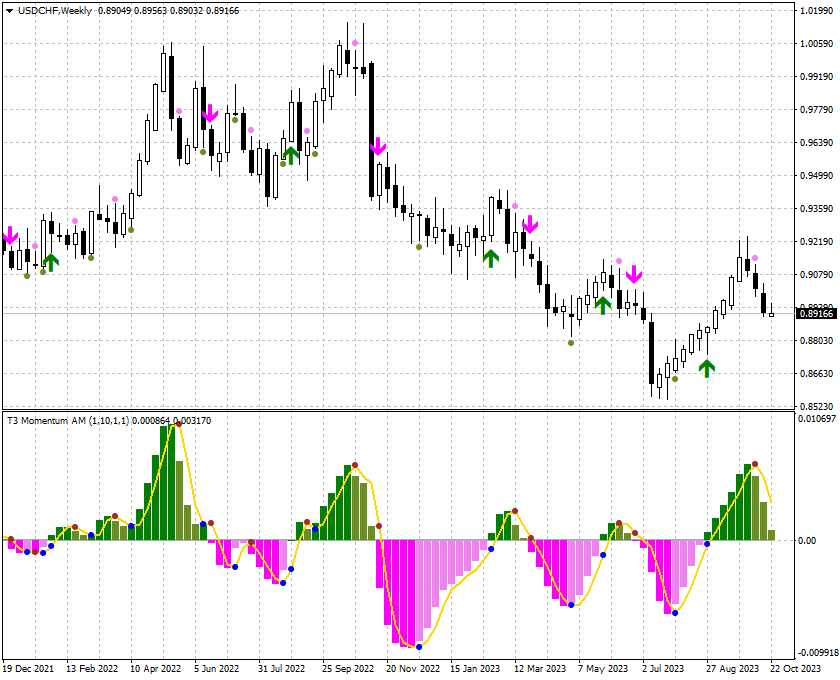
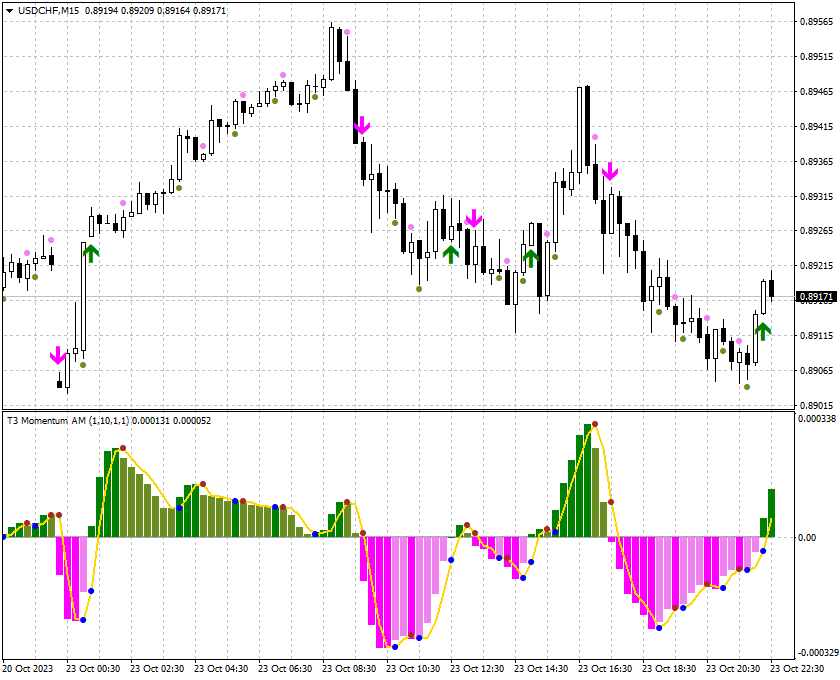
The presented indicator marks signals on the price chart with arrows in accordance with the data of the T3 Momentum AM indicator.
The indicator gives a signal and sends a notification to the mobile terminal and email.
The indicator is part of a series of indicators - T3 Line AM, T3 Momentum AM, T3 Candles AM, T3 Signal AM .
For a better understanding of the operation of each of the indicators, it is recommended to start working with them by using them together on one chart.
The T3 Momentum AM indicator represents the difference between the current price and the price some number of periods ago.
The difference from the classic indicator Momentum is the preliminary smoothing of prices according to the method T3.
Confirmation of the indicator signals is usually the price breaking the high (for buying) or low (for selling) of the bar on which the signal was given.