Conheça o Mercado MQL5 no YouTube, assista aos vídeos tutoriais
Como comprar um robô de negociação ou indicador?
Execute seu EA na
hospedagem virtual
hospedagem virtual
Teste indicadores/robôs de negociação antes de comprá-los
Quer ganhar dinheiro no Mercado?
Como apresentar um produto para o consumidor final?
Pagamento de Expert Advisors e Indicadores para MetaTrader 5 - 82

This is Advanced NotifyMe version with large interface.
Overview
The Expert Advisor allows you to receive notifications to the mobile phone (or tablet PC), mailbox or play the sound alert when some events occured: opening or closing position (also closing all positions), placing or deleting pending order; changing open price, stop loss or take profit; the account balance, equity, margin level, free margin or drawdown has reached the user specified level. You can specify a notification interval

Overview
The Expert Advisor allows you to receive notifications to the mobile phone (or tablet PC), mailbox or play the sound alert when some events occured: opening or closing position (also closing all positions), placing or deleting pending order; changing open price, stop loss or take profit; the account balance, equity, margin level, free margin or drawdown has reached the user specified level. You can specify a notification interval, notification text template and audio file for sound ale

The Expert Advisor helps in manual trading or closes the positions of another Expert Advisor. He is designed to automatically close position or group positions when the total conditions is reached. He does not open deals on his own. The EA can close positions on one symbol, on the entire account or on a specified magic number. You can specify in the settings the general Take and the general StopLoss for a group of positions for close. If you have any questions, comments or suggestions, write me

Wrote for yourself a good expert for profitable trading, which can help you to increase your deposit. He can track all or selected trading instruments of your broker for sharp price hikes. Stocks are best suited for tracking and trading as more trendy instruments than Forex, and are more predictable in their movements, especially on strong positive or negative news. For example, the Tesla stocks increased 60 percent in two weeks after the split was announced (screenshot with chart attached), and

Triple Threat is the latest offering from Algotrading_za It uses Bollinger Bands and RSI to determine entry positions with MACD as confirmation of trend. It also has a time filter to define trading times. This EA is highly configurable and can be optimized to be used on most currencies.
The money management section is also highly configurable and does not make use of any risky strategies like martingale etc..
EnkiSoft Trade Clone EA
User description in MQL5 blog New version 1.57 Read updates MT4 version download here
With Trade Clone EA you can trade on multiple MetaTrader 4 and MetaTrader 5 accounts simultaneously, clone the trades of any trading robot from server account to your friends and family accounts. Note: All MetaTrader 4 and MetaTrader 5 must run in same computer, or you need copy the trade file to the Client computer. You can run multiple Trade Clone EA as server, and
EnkiSoft Trade Clone EA new!
User description in MQL5 blog
You can use it on unlimilted clients for unlimited time! MT4 version download here
With Trade Clone EA you can trade on multiple MetaTrader 4 and MetaTrader 5 accounts simultaneously, clone the trades of any trading robot from server account to your friends and family accounts. Note: All MetaTrader 4 and MetaTrader 5 must run in same computer, or you need copy the trade file to the Client computer. You can run multip
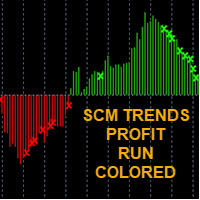
-EASY TO FOLLOW TRENDS -RED SELL / GREEN BUY -CROSS SIGNAL IS MEAN "TRENS WARNING" TO EXIT ORDER (WEAK TRENDS)
-WITH AUDIBLE ALERT ON/OFF
SCM indicator with different colors at levels 0, 100 and -100. The cross is a signal for " Exit" This exit signal is effective especially in short-term breakout trades, because it prevents early exiting at small corrections.
*****TIP EURUSD/BTC TF 10 min is work very Well****
****** GOLD TF15min is work very Well***** (after TF 15min show exit buy an

A estratégia do robô é baseada na ensinada pelo Stormer. Segue a explicação da mesma:
Quando o RSI fica abaixo de 25, compramos nos últimos 15 minutos do pregão a mercado e o stop de ganho fica na maior máxima dos dois últimos dias. Sendo o mesmo movimentado até ser atingido ou ir para baixo da entrada (quando encerramos a posição a mercado, independente de termos atingido o número máximo de dias).
Como utilizo?
Configura o Lote e configure a hora e minuto que o EA deve operar. O mesmo só

Mir Station MT5 it is a Secure Automated Software for trade Forex market and indices.
The architecture is a Fully Automatic Autonomous Robot Expert capable of
independently analyzing the market and making trading decisions Mir Station MT5 Have neurals nets to used the correct algoritm in the correct market situation
Mir Station MT5 It is an advanced trading system. This is a fully automatic Expert Advisor.
Mir Station MT5 is a plug and play system Mir

Данный индикатор предназначен для мониторинга торговой активности вашего счета. Особенно полезен будет тем, кто торгует сразу на нескольких инструментах. В одном окне индикатора собрана наиболее важная информация о счете с детализацией по инструментам и мониторингом заработка. Описание настроек: Start from date history - с какой даты индикатор будет обрабатывать торговую историю Max symbol on screen - индикатор берет данные по символам из обзора рынка. В данной настройке вы можете ограничить

Индикатор Analytic Trade - это полноценная торговая система. Он состоит из 4 частей: Первая - это стрелочки, показывающие наиболее оптимальные точки открытия и закрытия ордеров. Стрелка вверх - сигнал на покупку, вниз - на продажу. Вторая - это информационная панель в правом верхнем углу. Крупным шрифтом обозначена текущая цена, над ней показаны: максимум дня, расстояние от текущей цены до него и разность максимума и минимума (в пунктах). Под ней расположены: минимум дня, расстояние до минимума,

Fast closing of all positions in one click. A very useful button when you use position averaging, adding new orders, and when the price returns for a few seconds to the desired point, and there are more than 10 orders, it is very important to have time to close all of them. The second time the price may not return. Super fast execution. Orders are closed asynchronously without waiting for the previous result. The utility allows you to add a button to any window. Multiple buttons can be added fo

PanelCME - это инструмент для помощи трейдеру в ручной торговле. Данная панель автоматически выставляет стоп лосс и тейк профик к каждому ордеру. Имеет функцию перевода позиции в безубыток и функцию трала стоп лосса. Основное преимущество данной панели то, что тейк профит выставляется встречным лимитным ордером , что позволяет избежать проскальзывания при закрытии позиции. Данная панель делалась для скальпинга на СМЕ, но может так же работать и на форексе.
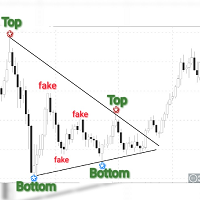
Obaforex Tops & Bottoms is a trading tool born out of a personal need to accurately filter tops and Bottoms and ensure consistency in the way tops and bottoms are picked for technical analysis. Mt4 version https://www.mql5.com/en/market/product/53637
It does not repaint (once top or bottom is printed, it don't disappear) It only prints tops and bottoms after a specified No of bars or candles to the right
This tool is expected to significantly improve the decision making of almost any form o

The Premier League indicator links the price in a cyclical-wave relationship. Crossing points can be used as potential market reversal points. Thus, all crossing points will be optimal points at which the movement changes taking into account the indicator period. But do not forget that the approach must be complex, the indicator signals require additional information to enter the market.

Easy Scalper MT5
LAUNCH PROMO: ONLY FEW COPY OUT OF AT $99!
Next price: 299$ Easy scalper designed to calculate the best time to buy or sell using many different techniques. The EA does not use grid, martingale, arbitrage. The trading system is suitable for both experienced traders and beginners. The EA includes protection against high spreads, and allows you to trade with a fixed or automatic lot size.Feel free to get in touch with me for any questions.
Monitoring : https://www.mql5.co
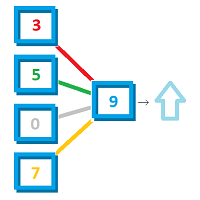
V3 RELEASED!
Promotional price: $30 - price will increase with the number of copies sold! PickyTrader V3
The EA is based on 3 WPR and 1 RSI and a Bollinger Bands indicator. The Bollinger Bands is the main filtering indicator, the EA trades can set to trade either when bands widen or when bands narrows. If Bollinger Bands allows a trade, the values of the other indicators are fed into a 3 layer neural network to filter the signal. If this neural network indicates that setup is tradable, the ve

Excellent dashboard for analytics. The panel helps to analyze the values of the Momentum indicator and its signals.
With this panel you can: watch the current signal from Momentum on all timeframes; watch the current signal from Momentum for different symbols; watch the current Momentum value; several types of signals for analytics.
Values in a table cell: value of Momentum
Signal type: Momentum crosses "100" line Momentum upper/lower "100" line Momentum direction
Work option:
GG Signal Scanner ATR base on ATR, MA and RSI indicators to determine trade times and entry points. The indicator scans all currency pairs in Market Watch or according to the list of currency pairs. The entry points will be listed of alerts and sent to the phone or email. Indicators are for use on one chart only and should not be used in conjunction with other indicators. Indicator should be used for M15 - H1 - H4 timeframe. In the strategy tester, the indicator only checks for 1 currency pair

Description
Range Detector is an indicator that identifies impulses in the market and displays their slope angles on the chart.
Recommendations
You can use this indicator to determine a trend and, accordingly, to determine the direction of opening a position or closing an opposite position.
Parameters
===== _INDICATOR_SETTINGS_ ===== - indicator settings
Maximum History Bars - maximum number of history bars for calculating the indicator. Average True Range Period - ATR indicator peri

Lows Highs Finder
Трендовый индикатор, дающий точные сигналы для входа в сделки. Идеальные точки входа в сделки для валют, крипты, металлов, акций, индексов. Наилучшие результаты на таймфрейме M15\H1 и выше!
Бывает на бирже маркетмейкер, не пускает цену у какого то уровня. С точностью до пункта. Вы хотите увидеть где? Индикатор находит и показывает на каком уровне цена ударилась в одно и то же место 2 или 3 раза! После этого, на следующей свече стрелкой указывает вход. + Свечной GA
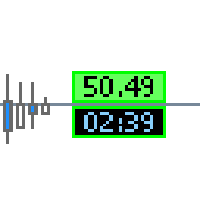
This tool gives you several informations about your broker and the current market events.
The top Infolabel shows the current spread price .
You can set whether the label should be displayed or hidden.
You can adjust price levels for automaticly change of background color.
The lower Infolabel shows the candle timer of the current time frame.
You can set whether the label should be displayed or hidden.
The bordercolor change to red if:
1. you have no connection to the tradeserver
2. y
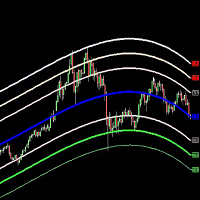
Belkhayate Gravity Center MT5 Custom
The Belkhayate center of gravity indicator is best used to confirm major turning points, and distinguish price extremes. Generally if price reaches the upper or lower levels one should expect a turn around coming soon, or at least a pull back towards the centre line if there is a strong trend. The upper and lower levels are red and green lines.
Our indicator use the same parameters as the well known trader M.Mostafa Belkhayate the inventor of the indi

The indicator determines a special pattern of Joe Dinapoli. It gives very high probability buy and sell signals. Indicator does not repaint. Indicator Usage Buy Signal ''B'' Entry : Market buy order at signal bar close Stop : Low of signal bar Take Profit : First swing high Sell Signal ''S'' Entry : Market sell order at signal bar close Stop : High of signal bar Take Profit : First swing low Indicator Parameters Fast EMA : External Parameter (should be kept as default) Slow EMA: External Param

The Squat is a function of the range of a given price bar and the volume, or TIC volume, that occurs while that range is being created. The basic idea is that high volume and little price movement indicate substantial support or resistance. The idea behind the approach to this indicator is to first look for likely Fibonacci support and resistance and then see if Squat manifests when that point is reached. The indicator determines one of the high probability patterns of DiNapoli. It does not re

Very special indicator of Joe Dinapoli which is a derivative from traditional MACD indicator. It shows the precise price, at which MACD will show line crossing and trend shifting. Also, this level is known one period ahead of time.You can constantly reassess your current position by looking at this studying a variety of timeframes. When you are in a trade, you have a feel for how much time you have for the trade to go your way by looking at the distance between the MACD Predictor line and the

Very special indicator of Joe Dinapoli which is a derivative of a Detrended Oscillator. Through a set of parametric equations, a predicting oscillator is created that forecasts, one period ahead of time, overbought and oversold conditions. The resulting predictor values are expressed as bands on the bar chart, both above and below the market. It may be mistaken as a Bollinger Band but has no resemblance to it whatsoever. The Predictor bands may be used in a variety of ways to aid in entering an

The indicator monitors the Dinapoli MACD trend in multiple timeframes for the all markets filtered and shows the results on Dashboard.
Key Features Indicator can be used for all markets Monitors every timeframe, from 1 Min to Monthly
Parameters
UseMarketWatch: Set true to copy all symbols available in market watch MarketWatchCount : Set the number of symbols that you want to copy from the market watch list. CustomSymbols: Enter the custom symbols that you want to be available in dashboard.

The indicator scans for Dinapoli thrust pattern in multiple timeframes for a specific market. Key Features Indicator can be used for all markets It can scan for thrust pattern on W1, D1, H4, H1, M30, M15 and M5 timeframes Ability to choose number of bars required above/below displaced moving average to define thrust Able to move display label on chart by single click Parameters Minimum Bars: Least amount of bars to account for Thrust DMA Period: Moving average period DMA Shift: Number or bars re
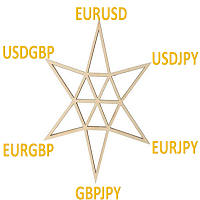
Six Stars it is a Secure Automated Software for trade 6 values simultaneously. Six Stars It is optimized for the majors Do not use this robot at the same time as others, it is a multi-value robot, therefore it manages 6 pairs simultaneously. The architecture is a Fully Automatic Autonomous Robot Expert capable of independently analyzing the market and making trading decisions
Six Stars Have 6 neurals nets to used the correct algoritm in the correct market situation Six Stars It

What you can do with CandleStick CandleStick is a useful indicator for doing MTF analysis. This indicator displays the CandleStick of another time frame on the chart . By understanding the information in multiple time charts at the same time, it is easier to understand the overall market view. It is also a useful tool for validating and studying past quotes and trades. There are similar products made by others, but I designed and developed it so that it is easy for me to use.
Features of Candl

O indicador White's Candle Color (by volume) vai colorir os candles com base no volume do candle atual em comparação com a média móvel do volume. Isto vai permitir você enxergar de modo claro se o volume (real ou tick) está dentro da normalidade, se é elevado ou baixo e trazer uma informação muito importante sobre o mercado. Espero que este indicador possa ajudar no seu operacional.
Sucesso e bons trades!

It is a utility (Expert Advisors) that you can easily tweet from MetaTrader Support for "Twitter API v2 OAuth 2.0 with PKCE".
Just add a few lines of code to the Indicator , EA or Script you create TweetHelper will tweet a message for you.
Preparation: Please apply for a developer account to access the Twitter API. Please refer to the following for setting details and procedures.
Example of code (script) for using TweetHelper https://www.mql5.com/ja/code/31044
MetaTrader settin

Indicador com foco no ZigZag do mercado adicionando também outros 2 indicadores já consagrados: Book de Ofertas e Saldo Agressor (Time & Trades), este indicador permite em detectar o melhor gatilho (compra ou venda) de preço nas regiões do Book de Ofertas incluindo filtros importantes como Agressão no Candle. Uso recomendado na iBovespa B3 brasileira, mas serve também em Forex desde que os ativos tenham informações do Book, no caso do Forex não é possivel usar o filtro de Agressão por Candle po

O indicador permite determinar instantaneamente a tendência atual por cor e níveis de Fibonacci. O painel HTF mostra a tendência atual de períodos mais altos, ajudando a determinar a força da tendência. Negocie na tendência ao mudar a cor das velas ou negocie contra a tendência quando o preço rompe os níveis extremos do indicador FIBO Trend PRO Benefícios do FIBO Trend PRO: O indicador nunca repinta ou altera seus valores Muito fácil de usar e intuitivo Aplicável a qualquer símbolo: FX-moedas, a

IntradayMagic predicts the nature of ATR and tick volumes for 1 day ahead. The indicator does not redraw and does not lag behind. Using Intraday Magic, you can significantly improve the quality of trading and avoid unnecessary risks. According to its indications, you can detect the crisis state of the market and the moments of trend reversal, specify the moments and directions of entries. How the indicator works Periodic events, exchange schedules, Bank schedules, expirations, and other similar

Vostok MT5 it is a Secure Automated Software for trade Forex market and indices.
The architecture is a Fully Automatic Autonomous Robot Expert capable of
independently analyzing the market and making trading decisions Vostok MT5 Have a neural net to used the correct algoritm in the correct market situation
Vostok MT5 It is an advanced trading system. This is a fully automatic Expert Advisor.
Vostok MT5 is a plug and play system Vostok MT5 It is a 100% automatic syste
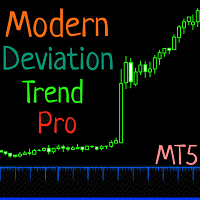
The EA uses a strategy based on strong price deviations, trading is carried out on major currency pairs. For this strategy, the author's indicator "Indicator Maximum Price Deviation" was developed - the algorithm detects deviations in timeframes: M5 and H1 , and if deviations are found, then the advisor opens the first order and then if the price moves in a positive direction, then the adviser opens additional orders on each bar (a total of 9 additional orders are supported). The EA does not inc

Deixe que o robô examine todo o mercado para você e identifique as melhores oportunidades de negociação enquanto você vive sua vida normal.
O Market Deviation Scanner mede o desvio de preços de uma determinada média em porcentagem.
A configuração recomendada para todas as médias é uma MÉDIA DE MOVIMENTO SIMPLES DE 200 DIÁRIOS, no entanto, qualquer parâmetro pode ser modificado à vontade - o scanner é totalmente personalizável.
Existe a possibilidade de definir um e-mail, push MQL ou n
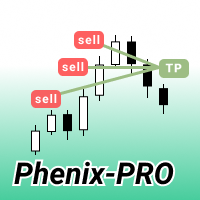
Phenix - PRO MT 5 – это полностью автоматизированный торговый робот. Данный робот торгует на хорошо известной валютной паре EUR JPY . По умолчанию параметры подобраны для валютной пары EUR JPY с Т аймФреймом 1М. Стратегия основана на системе мартингейла. В качестве точки входа в рынок советник использует математическую модель, основанную на значениях индикатора скользящей средней. Дополнительно можно настроить робота, чтобы он торговал с учетом баланса, для этого необходимо вкл AutoLot и Auto

No Demand No Supply This indicator identifies No Demand –No Supply candles to your chart and plots volume bars colored according to the signal. It can be applied to all timeframes or to a specific one only. It can also be used as regular volume indicator with exceptional future of WEIGHTED VOLUME. Furthermore is has an alert notification, sound and email when a signals occurs. The indicator does not repaint but the alert will come on two candles back due to the definition of No Demand No Su

Excellent dashboard for analytics. The panel helps to analyze the values of the Parabolic SAR indicator and its signals.
With this panel you can: watch the current signal from Parabolic SAR on all timeframes; watch the current signal from Parabolic SAR for different symbols; watch the current Parabolic SAR value; several types of signals for analytics.
Values in a table cell: value of Parabolic SAR
Signal type: Parabolic SAR crosses Price Parabolic SAR upper/lower Price
Work

O indicador analítico BodySizeHistogram foi projetado para observar o movimento real da taxa de câmbio no corpo da vela. O corpo da vela é uma ferramenta universal para analisar o gráfico de preços sem o uso de indicadores que usam fórmulas matemáticas. Na minha opinião, o corpo da vela é praticamente tudo o que é necessário para entender o evento que está acontecendo com o preço. Este indicador exibe histogramas de corpos de velas em pontos. Quanto maior o histograma, maior o corpo da vela e vi

Indicator of the colour display of the zones of buyers and sellers in the bar with a change of colour as the volume increases.
From bar maximum to bar closing - this is the sellers' zone.
From bar closing to bar minimum - this is the buyers area.
As the bar volume increases in comparison to the previous bar, the respective zones are coloured in a different colour.
Input parameters volumes (tick or real)

PROMO: ONLY 10 LEFT AT $90!
Next price: $199 Price will be kept high to limit number of users for this strategy.
This EA starts trading at the open of London (UK) Session . It is based on analysis of advanced statistical distributions combined with short to medium term reversal patterns which have mean-reversion attributes. The EA includes several smart features and allows you to trade with a fixed or automatic lot size. The EA is not sensitive to spreads but can be backtested on bo
O especialista em negociação CatchPositionByStopOrder foi projetado para trabalhar no mercado de tendências quando a direção do comércio é conhecida, você pode negociar ordens SELLSTOP e BUYSTOP, você pode confiar a escolha da direção ao próprio especialista. Coloca ordens STOP pendentes e move-as atrás do preço para determinar o ponto de entrada mais eficaz. O prazo recomendado para negociação é M5/M15 / H1. No EA, você pode trabalhar com S/l E T/p fixos e com a ajuda de uma rede de arrasto, s

Общие сведения Советник определяет наиболее вероятные места движения графика и открывает ордера на Buy или Sell. Не использует высокорискованные стратегии, такие как Мартингейл. Ордера закрываются по наиболее возможному профиту или небольшой потерей. Что имитирует Take Profit и Stop Loss. Мультивалютный.
Важно перед запуском прочитать! Для запуска советника достаточно запустить его на одном единственном графике например EURUSD. Во вкладке "Обзор рынка" в идеале отобразить все символы для

https://youtu.be/Ze9zPpYtIrI
GridCatchCandleLimitOrderOneSymbol-Expert Advisor plano de grade, para abrir ordens dos limites do canal para o centro, funciona em reversões do nível de suporte e nível de resistência, do indicador de largura de canal personalizado TMA, com fixo S / L E T / P. O EA é projetado para negociar a partir de níveis quando não há um movimento de tendência específico e você duvida da continuação da tendência, os níveis mudam automaticamente para o preço ao longo dos limi

Max ScalperSpeed MT5 is a fully automated expert advisor. This system has been developed to improve the efficiency of generating more returns. Rely on scalping trading strategies and recovery strategies with appropriate trading frequencies, and also able to work well in all market conditions, whether trend or sideways, able to trade full time in all conditions. Enable or disable news filtering according to user needs. Added a proportional lot size adjustment function, where users can choose t
Indicator summary Индикатор информационная панель отображает значения и торговые действия, а так же выводит сводную информацию о торговых действиях, основанных на 11 встроенных индикаторах. Встроенные индикаторы:
RSI (Relative Strength Index )- пересечение зоны перекупленности сверху вниз - сигнал на продажу. Пересечение зоны перепроданности снизу вверх - сигнал на покупку. При колебаниях в зоне между перекупленостью и перепроданостью сигнал формируется в зависимости от нахождения значения о

This indicator is an extended implementation of Weis waves. It builds Weis waves on absolute volumes (which is the classical approach) or delta of volumes (unique feature) using different methods of wave formation and visualization. It works with real volumes, if available, or with tick volumes otherwise, but also provides an option to use so called "true volume surrogates", as an artificial substitution for missing real volumes (for example, for Forex symbols), which was introduced in correspo

Victory Price Direction I'm glad to present you my new indicator.
This indicator includes all the best strategies that I have researched. When developing and optimizing, I used ML algorithms. The indicator is very easy to use.
Now the indicator has 3 basic strategies and the ability to customize your own strategy. I am constantly looking for better strategies.
You get: A simple and effective indicator of reversals. The indicator will help you place Take Profit correctly. It w

Excellent dashboard for analytics. The panel helps to analyze the values of the Alligator indicator and its signals.
With this panel you can: watch the current signal from Alligator on all timeframes; watch the current signal from Alligator for different symbols; watch the current Alligator value; several types of signals for analytics.
Values in a table cell: Jaw Teeths Lips Jaw - Teeth Jaw - Lips Teeth - Lips
Signal type: Lips - Teeth - green line (lips) crosses red line (

Consultor FOREX HERO usando a estratégia de grade (abertura de negócios contra o movimento da tendência) e piramidação (abertura de negócios com a tendência). O EA funciona apenas com ordens de mercado. A abertura das primeiras transações ocorre na quebra de extremos no tempo alocado, onde se concentra N número de ordens limitadas (o preço testou este nível várias vezes). Se o preço quebrar o nível, mas o número N de pints não passar em N segundos, o sinal será considerado falso.
Versão MT4 -

A vwap do dia anterior é utilizada por alguns traders como ponto de suporte e resistência, afinal é uma das maneiras de considerar o preço justo daquele ativo ou daquele par no dia anterior. Possíveis defesas podem ocorrer nesta região indicando uma reversão, ou acionamento de stops iniciando um novo movimento mais direcional. É uma questão de analisar como vai somar ao seu operacional.
Para evitar ficar desenhando manualmente as vwaps do dia anterior e ganhando tempo para suas análises, use o

WT Vwap 5 Bands
O indicador WT Vwap Bands é um indicador que combina o preço e o volume, ajudando a mostrar se está o preço está dentro do "preço justo", sobrecomprado ou sobrevendido.
O código do indicador foi pensado visando o desempenho e já testado em conta real de negociação.
Além dos inputs visuais (cor, espessura e estilo da linha), o usuário pode definir um valor % que depende do preço.
Os valores default trabalham com a banda mais afastada a 1% do preço e depois dividindo est
Sputnik it is a Secure Automated Software for trade Forex market and indices.
The architecture is a Fully Automatic Autonomous Robot Expert capable of
Independently analyzing the market and making trading decisions
Sputnik It is an advanced trading system. This is a fully automatic Expert Advisor. Sputnik is a plug and play system Sputnik It is a 100% automatic system, The system is self-sufficient, performing all the work. You can download the demo and test it yours

新機能:Ver3.5 28通貨ペアの強弱も表示するようにしました。 監視ペアで最強、最弱の通貨ペアとなった場合、四つ葉のマークが出るように変更しました。 15分足、1時間足、4時間足単位での通貨ペアの強弱を表示するようにしました。
詳細な情報はこちらにサイトがあります。 https://toushika.top/tc-cs-plus-cfd/
注:こちらはTitanのデモ口座で動作します。 XMで使用したい場合は こちらのでセットファイル を使用してください。
機能: 一目で現在の通貨の方向性と強弱が確認できます。 15M,1H,4Hでの方向性を表示します。 15M,1H,4Hでの方向が揃った場合にドットが表示されます。 通貨の相関が揃った場合にドットが表示されます。 ※相関はピアソン相関係数を使用しています。 より詳しい情報につきましてはこちらを参照してください。 https://www.mql5.com/ja/articles/5481 通貨の強弱を表示します。 現時点でのボラリティーの状況を表示します。 過去20日/過去5日/今日のボラリティーを

SR Breakup Indicator é um indicador baseado em suporte e resistência . Torna os níveis de rompimento de preços visíveis , abrindo a mente do trader para identificar oportunidades de mercado.
Atenção!!! Este indicador pode ser usado em qualquer período de tempo.
Sugestão de uso Espere até que as linhas de suporte e resistência estejam horizontais e mais próximas . Trade de compra: se preço romper o nível de resistência (linha de fora) para cima. Trade de venda: se o preço romp

O indicador de VolumeTick https://youtu.be/tmHZKdMCMGo
feito para a memorização de determinar os possíveis pontos de reversão, quando as condições de consolidação e multidirecionais de negociação, o número de volumes existentes no mercado aumenta drasticamente, o que mostra o interesse dos participantes mudar a direção do movimento da ferramenta de mercado e considera o número de tiques em cada bar, é concebido como um oscilador. Portanto, nós temos a possibilidade de fornecer parar de negoc

Hello This Indicator will draw Green (Up) and Red (Down) small arrows from Multi TimeFrames based in ( Ichimoku ) to help you to take decision to buy or sell or waiting If there 4 green arrows in same vertical line that's mean (Up) and If there 4 Red arrows in same vertical line that's mean (Down) and the options contain (Alert and Mobile , Mail Notifications). Please watch our video for more details https://youtu.be/MVzDbFYPw1M and these is EA for it https://www.mql5.com/en/market/product/590

Excellent dashboard for market analytics. The panel helps to analyze the values of the Stochastic indicator and its signals.
With this panel you can: watch the current signal from Stochastic on all timeframes; watch the current signal from Stochastic for different symbols; watch the current Stochastic value; several types of signals for analytics.
Values in a table cell: Stochastic - Main line Stochastic - SIgnal line Stochastic - Main line minus signal line
Signal type: Sto
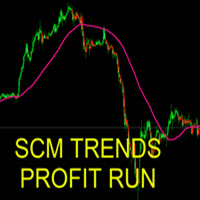
The indicator can be used in several ways. The simplest is to buy when the SCM Trends Profit Run line is painted green and sell when it is red. This indicator that allows you to detect several changes and dynamics in price that many traders can’t estimate or see without an indicator, which highlights its essence and usage.
Accordingly, traders can draw conclusions and make estimates about how the prices will change based on the information they have and then they can modify their strategy fo

Hello This Indicator will draw Green (Up) and Red (Down) small arrows from Multi TimeFrames based in ( MACD ) to help you to take decision to buy or sell or waiting If there 4 green arrows in same vertical line that's mean (Up) and If there 4 Red arrows in same vertical line that's mean (Down) and the options contain (Alert , Mobile and Mail Notifications). Please watch our video for more details https://youtu.be/MVzDbFYPw1M and these is EA for it https://www.mql5.com/en/market/product/59092 G

É um indicador de Gráfico e de Tendência que traz várias vantagens.
Elimina o ruído.
Facilita a identificação de tendências. Pode ser utilizado como um indicador de força direcional. Identifica lateralização: candles com abertura e fechamento próximos. Identifica alta volatilidade: candles com sombras maiores que o corpo. Atenção!!! Funciona em qualquer ativo e em qualquer timeframe.
Fácil configuração Símbolo: Qualquer um Time frame: Qualquer um Parâmetros: C

O novo indicador é um preditor de tendência para o gráfico atual, bem como outros símbolos e prazos. Todos os botões do quadro são interativos. Por padrão, você tem 20 pares de moedas na lista de observação e três prazos (M5, H1, D1), mas você pode escolher os períodos e símbolos que deseja exibir no menu. Se o indicador for azul, indica o início de uma tendência de alta. Se for vermelho, indica o início de uma tendência de baixa. Na captura # 3 (modo Luz do dia) explicarei cada elemento em deta

Você já conhece o Display N Bars? Já conhece a ferramenta Start (dos indicadores Midas)? Neste indicador unificamos as duas ferramentas permitindo que você possa definir em qual candle vai começar a contagem, ou utilizar a numeração automática que já era disponível na versão anterior.
Segue descrição do utilitário:
Display N Bars O utilitário Display N Bars é uma ferramenta simples que tem o objetivo de ajudar na identificação dos candles. Se um trader tenta compartilhar o conhecimento com

O Indicador CoioteChart foi construído pra facilitar desde a leitura de contexto de mercado até a micro estrutura do candle, facilitando ajustes operacionais e tomadas e decisão com alta eficácia.
Possui um controle para habilitar e desabilitar a visualização das pocs, vwap, zonas de máxima e mínima negociação, pode ser utilizado data sources de tempos gráficos para cálculos ou utilizado os ticks de agressão do time and trades, funciona com volume real e volume de ticks.
As colorações são at

Esse indicador é baseado nas médias móveis das máximas e mínimas, para identificação de tendências e/ou condução de stop loss.
Como o indicador funciona? O indicador plota os pontos de tendência de alta até que haja um fechamento abaixo da média móvel das mínimas. Quando isso acontece, inicia-se uma tendência de baixa e os pontos são plotados até que haja um fechamento acima da média móvel das máximas. Quando isso acontece, outra tendência de alta se inicia. E assim vai.
Como usar o indicad
O Mercado MetaTrader é o melhor lugar para vender robôs de negociação e indicadores técnicos.
Você apenas precisa desenvolver um aplicativo para a plataforma MetaTrader com um design atraente e uma boa descrição. Nós vamos explicar como publicar o seu produto no Mercado e oferecer a milhões de usuários MetaTrader.
Você está perdendo oportunidades de negociação:
- Aplicativos de negociação gratuitos
- 8 000+ sinais para cópia
- Notícias econômicas para análise dos mercados financeiros
Registro
Login
Se você não tem uma conta, por favor registre-se
Para login e uso do site MQL5.com, você deve ativar o uso de cookies.
Ative esta opção no seu navegador, caso contrário você não poderá fazer login.