Conheça o Mercado MQL5 no YouTube, assista aos vídeos tutoriais
Como comprar um robô de negociação ou indicador?
Execute seu EA na
hospedagem virtual
hospedagem virtual
Teste indicadores/robôs de negociação antes de comprá-los
Quer ganhar dinheiro no Mercado?
Como apresentar um produto para o consumidor final?
Pagamento de Expert Advisors e Indicadores para MetaTrader 5 - 72
This Expert Advisor Makes efficient use of market fluctuation using multiple criteria. Initial deposit value is criteria for final return of the EA. we recommend using at least $500. Along with increasing initial deposit value, it s recommended to increase trading lot size relatively. Other input parameters are optimized for GBPUSD. To be used for other pairs it must be optimized separately.

Version 1.0 The Trend Snatcher is Multi timeframe indicator that can be used to catch swings on the price market chart The indicator uses two lines that targets the highest buying and lowest selling levels , the signal indicated by the two lines crossing The indicator is suitable for scalping and Swing trading, It can also be used as additional Confluence to enter a trade when Price is at a significant level of supply and demand or Trendline touch
HOW IT WORKS? Buying : Place your Buy

OBTENHA OUTROS EAs DE GRAÇA!!! OBTENHA OUTROS EAs DE GRAÇA!!! OBTENHA OUTROS EAs DE GRAÇA!!! OBTENHA OUTROS EAs DE GRAÇA!!! OBTENHA OUTROS EAs DE GRAÇA!!!
O RSI Grid é baseado nas condições de sobrecompra e sobrevenda do RSI e abre uma grade quando a negociação está no lado perdedor do mercado. O RSI fornece aos traders técnicos sinais sobre o momento de alta e baixa dos preços, e geralmente é plotado abaixo do gráfico do preço de um ativo. Um ativo é geralmente considerado sobrecomprado quan

An indicator of patterns #35 and #36 ("Pipe bottoms" and "Pipe tops") from Encyclopedia of Chart Patterns by Thomas N. Bulkowski. Parameters: Alerts - show alert when an arrow appears Push - send a push notification when an arrow appears (requires configuration in the terminal) PeriodBars - An indicator period (number of bars that form a top/a bottom) K1 - an additional parameter that influences the accuracy of pattern shape recognition K2 - an additional parameter that influences the accuracy

Taka Taka Scalper Pro is a simple expert advisor that can be configured according to moving averages signals, such as triple, double or exponential moving average . Trigger signals are configured when these averages crosses. Besides, there is a important ATR filter to trade only on such volatility. A trend filter can also be configured according to averages. Takeprofit and stoploss are calculated according to ATR multiplier , even for long or short trades. You can also configure a non scalper mo

Half Trend TPSL Buy Sell Indicator calculates the open and close of the price bars over the selected period of time and applies its own calculation method to find an average line of the price movement. ATR based Take Profit and Stop Loss ATR is a measure of volatility over a specified period of time. The most common length is 14, which is also a common length for oscillators, such as the relative strength index (RSI) and stochastics. A higher ATR indicates a more volatile market, while a lowe

EA Gold River was created specifically for trading on gold (XAUUSD) time frame M5-H1.
EA Gold River uses signals from a unique Gold River indicator (you do not need to buy separately, the indicator is built into the Expert Advisor).
I will not show beautiful drawn screenshots and super edited videos. If you are using my EA TradeBooster , then you will like EA Gold River .
The standard set is good for trading, but you can always come up with your own set for higher profits.
Happy Trades

O indicador avalia o grau de volatilidade dos preços e identifica os componentes que levam ao crescimento e queda. Usando a Variatividade, você pode determinar onde o movimento muda, bons momentos para negociar com a tendência ou contra a tendência. Acompanhe as transações abertas. Exibição
O indicador exibe 3 linhas: VARIATIVITY - linha cinza fina. Volatilidade total dos preços. O crescimento da linha indica um aumento na atividade do mercado. O declínio indica a possibilidade de negociação co

O que voce espera de um Robo? Confira as contas live e veja por voce mesmo! Live - EURUSD - Agressivo Live - EURUSD - Moderado Live - EURUSD - Conservador Live - Multiplas paridades EA simples e rentavel!
Kraken FX usa tecnicas de scalper e martingale alem dos indicadores RSI e Volume para operar.
Paridades recomendadas: AUDCAD, EURAUD, EURGBP, EURUSD, GBPCAD, GBPUSD e USDCHF Quanto maior o timeframe, menor o risco!
Timeframe recomendado: H1 Clique aqui para obter os SETs.

Multi Time Frame Sub Panel for MT5. Monitor multiple time frames from a single chart window.
Here are some of the options available with the MTF Moving Average: Select the timeframes to be displayed (can manually type in other TF's) Customize the amount of timeframes to be displayed Define the width (number of bars) for each timeframe box Modify all the colors Display two moving averages
MTF, MA, Multi-TF, Multiple TF, Moving Average, SubPanel, Sub-panel,

One Period EA is the expert advisor that uses only ONE PERIOD to be configured on Diretional Movement Index DMI . Besides this, ATR indicator must be configured to filter some trades and to calculate Takeprofit and Stoploss , either for long or short trades. A partial execution system can be optimized to save profits. Autolot function and number of opened orders and spread can also be optimized. Optimized EA is on EURUSD , H1 . Please download it and don´t let to try and test other EA on my prof

There is a very simple rule
It is Always difficult to cross high pressure areas and easy to cross low pressure areas
MT4 version is available here
This is definitely true for price
It was so simple, it was not!
So let's get started
This indicator shows you the amount of pressure in that area according to the bars that it shows. The longer the bar, the higher the pressure in that area It also marks the most pressed area with a rectangle
From now on you can simply decide on the

Não! Essas não são as ‘Banda de Bollinger”.
Identifica a CONTINUIDADE do movimento entre Máximas, Mínimas e Fechamento. As 'duas bandas' em uma cor sinalizam a CONTINUIDADE do movimento de alta ou de baixa. Com essa ferramenta, seguir a direção do preço, ficou fácil até para quem é Café com Leite no Mercado!
Lembre-se:
Todas as nossas ferramentas funcionam em conjunto, indicadores exclusivos e robô para gestão de risco. De forma automática, elas identificam os diferentes padrões na dinâmi

Quando você abrir uma operação, mover o Stop Loss para o ponto de entrada (Break-Even) sempre que a operação andar favoravelmente 75 pontos, é uma obrigação! Isto significa que, quando sua operação atingir 75pts você moverá o Stop Loss para 10pts do ponto de entrada, desta forma, basicamente você vai colocar o Stop Loss em um preço 'melhor' que o preço de entrada (Break Even), ou seja, no lucro. Na pior das hipóteses, você sairá no “zero a zero”. A ideia é não deixar que uma operação parcialment

Conta o tempo de vida de do Candle Extra até seu fechamento. É utilizada para auxiliar na entrada das operações...
...Operamos no fechamento dos Candles de um minuto, ou seja, quando o cronometro estiver em 00:xx:01. Abrimos uma ordem, e o valor dessa operação também é exibida pela ferramenta.
Extra: Para 'destravar' a escala dos preços. Clique duas vezes na escala e o gráfico será 'centralizado horizontalmente'.
Além de possibilitar a expansão e a contração da escala de preço, podemos naveg
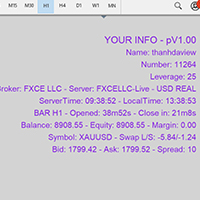
Show Account Information Custom showing your MT5 account information Indicators add account information to chart. Profit, Balance, Equity, Free Margin, Margin and Margin Level % Profit.... Hide account information: Click anywhere on account information text.
The hide/show response is dependent on incoming ticks or chart refresh. In tick scarce or closed markets the indicator hide/show click will appear not to function while waiting for a tick or chart refresh. It is only necessary to att

Kroko Trader EA is a trading system that uses William´s Alligator indicator as trend and trigger signals. Also, as a filter, ATR can be configured to trade only in certain volatility. Takeprofit and Stoploss are calculated according to multiplier of ATR values, resulting in a dynamic stop function. Optimized EA was on EURUSD , H1 . But, it´s possible to optimize on other timeframes and currencies, such as EURUSD , M15 Scalper . Please download it and don´t let to test other expert advisors of my

Introdução Este é um indicador de lucratividade diária
Característica As estatísticas podem ser baseadas em moeda, número mágico e notas As estatísticas podem ser baseadas no tempo Disponível para todas as moedas, todos os períodos Existem temas em branco e preto Classificação reversa A taxa de atualização pode ser ajustada Você pode definir o tempo de atualização para o mais recente
Parâmetro nD = 30; // Número de dias StartTime =

A lot of professional traders use high quality divergence signals as a part of their strategy to enter a position. Spotting correct divergences quickly can often be hard, especially if your eye isn’t trained for it yet. For this reason we’ve created a series of easy to use professional oscillator divergence indicators that are very customisable so you get only the signals you want to trade. We have this divergence indicator for RSI, MACD, Stochastics, CCI and OBV. RSI: https://www.mql5.com/en/

Description
This is a utility tool for MT5, and it exerts a strong power for entry operations and fund management in discretionary trading. Although the standard trading panel provided by MT5 is very simple, it lacks some features that are considered particularly important for discretionary trading.
This tool compensates for the lack of functions, but we have paid close attention not to implement excessive functions.
Benefits of the Flexible Trading And Money Management MT5 Simple and Intu

Description
This is a Utility tool for MT5 which will keep us away from a chart in a nice manner, letting us know only a good trading opportunity. It is said that from novice to experts, one of the common and obviously the most important things to do is to “WAIT” for good trading opportunities to come. On the other hand, it is not always that case that we are sitting in front of the chart when the trading opportunity comes. Thinking about chart analysis, at the same time, major tools used t

Description This is a Utility tool for MT5 which will make our chart analysis task quite more efficient and save large amount of time. As for chart analysis, some are watching out several symbol simultaneously with single timeframe and others are trading only one single pair with multi timeframe analysis. For both, a common troublesome issue is “scroll chart to look back” or “draw chart objects” in multi charts at the same time. Especially for those who are trading with multi timeframe soluti

Plumbum This is a grid Expert Advisor. It detects the most probable points of stop/pullback/reverse of a trend and places a grid of limit orders. Uses the Martingale system. Uses stop losses. That is why long waiting out for unprofitable positions is out of the question. Optimize the EA on open prices (it works with open prices)
Settings: CommentToOrder - comment to orders; start_lot - initial lot; distance - distance between limit orders in points; level - number of pending orders; multiplier

Madx Cobra Madx Cobra Indicator. Create to traders both experienced and inexperienced to use it because it is a basic indicator
How to use : Setting Indicator 1. MA Fast : Moving Average fast (10) 2. MA Slow : Moving Average Slow control trend markets.(200) 3. ADX : Control trend(5) 4. For alert you can set to alert Next bar or instant bars.
When arrow sky blue show or arrow up, you can entry order "Buy" or "Long" and arrow red show or arrow down, you can entry order "Sell" or "Short"

The indicator automatically calculates the level and real volume Point of control, and also displays the market profile for an array of candles, within the boundaries of a rectangle. If your strategy is based on taking profit on a rebound from price accumulations, the Range profile indicator will become the main tool in scalping trading. Point of control is calculated based on the total volume for each tick or minute candles, depending on the settings and trading timeframe. In the abse

A lot of professional traders use high quality divergence signals as a part of their strategy to enter a position. Spotting correct divergences quickly can often be hard, especially if your eye isn’t trained for it yet. For this reason we’ve created a series of easy to use professional oscillator divergence indicators that are very customisable so you get only the signals you want to trade. We have this divergence indicator for RSI, MACD, Stochastics, CCI and OBV. RSI: https://www.mql5.com/en/

A lot of professional traders use high quality divergence signals as a part of their strategy to enter a position. Spotting correct divergences quickly can often be hard, especially if your eye isn’t trained for it yet. For this reason we’ve created a series of easy to use professional oscillator divergence indicators that are very customisable so you get only the signals you want to trade. We have this divergence indicator for RSI, MACD, Stochastics, CCI and OBV. RSI: https://www.mql5.com/en/

A lot of professional traders use high quality divergence signals as a part of their strategy to enter a position. Spotting correct divergences quickly can often be hard, especially if your eye isn’t trained for it yet. For this reason we’ve created a series of easy to use professional oscillator divergence indicators that are very customisable so you get only the signals you want to trade. We have this divergence indicator for RSI, MACD, Stochastics, CCI and OBV. RSI: https://www.mql5.com/en/
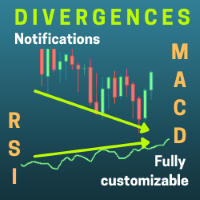
This expert advisor finds divergences and opens a buy or sell position taking into account the input parameters set by the user. Positions are opened once the divergence is detected and the pullback signal is triggered. The condition for a divergence to occur, is that the price moves in a different direction to the MACD and RSI. The type of divergences and the frequency at which they are detected depends entirely on the inputs entered by the user.
Features Functional for any symbol or period
A lot of professional traders use high quality divergence signals as a part of their strategy to enter a position. Spotting correct divergences quickly can often be hard, especially if your eye isn’t trained for it yet. For this reason we’ve created a series of easy to use professional oscillator divergence indicators that are very customisable so you get only the signals you want to trade. We have this divergence indicator for RSI, MACD, Stochastics, CCI and OBV. RSI: https://www.mql5.com/en/ma

Moving Average Crossover Scanner and Dashboard For MT5 Advanced Moving Average Scanner Moving Averages Crossover Dashboard MT4 Version of the product can be downloaded: https://www.mql5.com/en/market/product/69260 The indicator scans the market and sends signals and alerts for Moving Average crossovers, death cross and golden cross.
Crossovers are one of the main moving average ( MA ) strategies.
MA Crossover ( cut ) strategy is to apply two moving averages to a chart: one longer and one s

Simple and fast MACD oscillator with MACD and signal lines and two-color histogram.
I wasn't happy with the Meta Trader MACD oscillator as it's not immediate to read and the other ones I tried felt a bit laggy or added unneeded features on top, so I decide to make one that feels familiar to me. I hope you will find it useful!
Contact me for any issues or bugs and I will try to help the best I can.

Midnight Scalper is based on a sound trading principle. It is made to trade during times when the market is at low volatility. From 23:00 to 00:00 is best. It uses multiple indicators for precise entry and exits with a basic fixed stop loss and take profit as part of its money management strategy.It does not put your funds at high risk with such methods as martingale, grid, averaging positions or no stop loss trading. ECN broker is required with a tight spread and low commission. NOTE : After a

Master MA EA MT5 is an advisor with an adaptive system for "Resolving" a basket of orders can also be used to restore unprofitable positions on the account. The signal uses the direction of the exponential moving averages, average daily volatility, then builds an order grid if the price deviates. The grid step is configurable, and if the price goes against us, then after a certain number of orders, the account recovery function (Drawdown Reduction) is activated, the most distant unprofitab
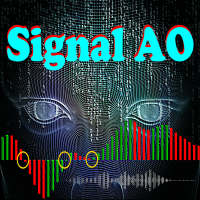
Signal AO is a simple informational utility. It gives a signal about crossing the zero mark by the Awesome Oscillator (AO) indicator.
Signals will be received depending on the chart on which the utility is located.
The settings are pretty simple:
SYGNAL TYPE: ALERT - The signal gives alert. SOUND - Voice notification. ALERT_AND_SOUND - Alert together with voice notification.
LANGUAGE: Select the language in which the Signal AO will communicate.

Average True Range (ATR) é um indicador comumente usado que mede a quantidade de movimento no preço ao longo de uma duração definida. No entanto, o valor que ele fornece não é definido dentro de nenhum tipo de limite, o que torna quase impossível usá-lo para qualquer outra coisa que não seja stop loss ou cálculos de lucro. Este indicador é o seu indicador ATR padrão, mas introduzimos demarcações de percentil para que você possa ver os extremos. Você pode escolher entre Percentis e algo que chama
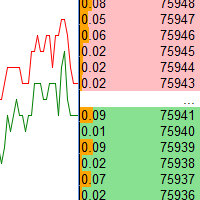
Depth of market display. Up to sixteen instruments can be displayed. There is auto-scrolling of prices, which can be turned off by clicking on "A" at the top of the window. It is quite a beautiful indicator, it can act as a splash screen, it will not be so boring to look like a regular chart, just right for meditation, especially after big losses in the market. The indicator is not for trading, so your deposit will be more complete. The video displays fast playback of previously saved data. Atte
3 standard indicators are used within this expert advisor and all their parameters are configurable and optimizable . The default settings are set for the GbpUsd pair on M15 timeframe , more settings can be found in #Post 1 in the Comments section of the product . Results are obtained using the combined power of the 3 standard indicators ( MACD , Moving Average and Stochastic ) by using diferrent decision power of the indicators and optimized values of each indicator setting . Only one order at

Violet Panther Scalper MT5 is specially designed to work as scalper and a trend trade system. Panther strategy is based on two moving average crosses and candlestick reader relative to theses averages. A trade in filter based on ATR values can be configured to make EA works only on true trends. So, if trigger condition is true, Panther strat to trade on each new condition achieved. An aditional trend filter can be configured based on TRIX indicator , making possible to confirm such trend behavio

///////////////////////////////////////////////// / /////////////////////////////////// Este indicador exibe um canal de regressão polinomial não linear. Ele funciona muito rápido como um raio. Especialmente ao usar a tecnologia de aceleração OpenCL. Uma versão especial deste indicador estará disponível em breve, que também prevê o preço para algum tempo à frente. São linhas coloridas adaptáveis e suaves. Existem quatro opções para este indicador: 1) 1 segundo período de tempo 2) Prazo de 2 s

O esgotamento do intervalo ocorre quando o preço atinge ou excede o intervalo esperado para o período atual. Nesses níveis, o preço começa a perder seu ímpeto em relação ao início do período, portanto, é bom garantir que você não esteja assumindo novas posições. Este indicador mostrará onde é provável que isso aconteça em seu gráfico, mostrando os níveis para os períodos Diário, Semanal e Mensal. Quando você vê o preço excedendo esses níveis de exaustão, está dizendo que o momento por trás do mo

Uma das melhores ferramentas para se analisar o volume, o Weis Wave foi idealizado por David Weis para facilitar a leitura do fluxo direcional.
Para os discípulos do método Wyckoff, isso significa uma evolução, facilitando uma leitura preditiva do mercado, sempre buscando zonas de Acumulação e Distribuição dos ativos negociados.
Para melhor compreensão, neste indicador tentamos abrangir toda leitura de ESFORÇO (volume negociado) versus RESULTADO (alteração de preços). Assim, você poderá apli

Preço promocional de 1 dia: $ 49 Ativação: 30
Preço promocional de 10 dias: $ 59 ativação: 20 Introdução Olhada rápida
Verifique rapidamente a lucratividade por um período de tempo e exiba as estatísticas
Filtre rapidamente as transações históricas e faça estatísticas com base no tempo, número mágico, moeda e comentários
As estatísticas incluem Lucro Líquido, LotTotal, Fator de Lucro, Negociações Curtas (% de vitória), Negociações Longas (% de vitória), Negociação de Lucro Médio, etc.

Unlike any indicator you’ve seen, Trend Volley is an advanced purpose-built trend trading charting system that has been successfully used in nearly every tradable market. It is unique in many ways. Trend Volley’s internal trend detector algorithm studies the market and dynamically chooses the right values for the internal parameters, to adapt to the price and to decrease consecutive trend failures. It can be applied to any financial assets: forex, cryptocurrencies, metals, stocks, indices. ITS

Why choose GBot? Very fruitful EA that trades gold, it can be tested in this site and contact me if you need the source code and the application file. The strategy used is used internally with minimum data to be as input from the user. In the past 10 years the EA has been able to maintain the minimum of 30% return per month. Well in the past 3 - 5 years it obtained very impressive results. The maximum balance drawdown in the past 10 years has been around 5 %. Advantages Controlled risk. Good ret

//////////////////////////////////////////////////// // //////////////////////////////////////
Este indicador exibe a faixa de mudanças de preço em 1 minuto. Ótimo para gerenciamento de risco. Esta é uma versão aprimorada do indicador Average True Range para Tick Chart.
Isso agora é o dobro da precisão e uma linha de média colorida.
A configuração é bastante simples - você só precisa alterar as cores se necessário.
É muito fácil entender as leituras deste indicador, o significado é o me
//////////////////////////////////////////////////// // //////////////////////////////////////
Uma versão melhorada do indicador Average True Range.
Isso agora é o dobro da precisão e uma linha de média colorida.
A configuração é bastante simples - você precisa especificar o período principal e o período de média.
É muito fácil entender as leituras deste indicador, o significado é o mesmo que o do intervalo médio verdadeiro padrão.
////////////////////////////////////////////////////

(Gráficos de criptomoeda)
Ele traz o histórico tanto quanto o número de barras que você especifica e começa a mostrar os dados instantâneos diretamente.
Oferece a oportunidade de trabalhar em todos os prazos.
Permite que você trabalhe com vários símbolos.
Este aplicativo é um serviço de segundo plano.
Ele baixa o histórico de todos os símbolos começando com "S" na tela de observação do mercado e mostra os dados dos ticks.
Transfere automaticamente dados de negociação em temp

Você não pode parar o mercado, mas agora pode sair dele com um botão! O mercado não para por ninguém, ele não dá uma pausa e não tem piedade de quem dorme. Encerrar seus trades abertos manualmente pode ser demorado e levar uma parte preciosa do seu capital, por isso lançamos o Emergency Stop Button, um botão de emergência de alta tecnologia que encerra todos os trades abertos com apenas um toque. Tecnologia de encerramento inteligente
Construído com codificação avançada, apenas com comandos n

Binance é uma bolsa de criptomoedas de renome mundial! Para facilitar o rastreamento de informações de profundidade e mudanças de tick, o programa fornece as seguintes funções:
1. Importe automaticamente todas as variedades comerciais na zona de negociação de futuros da Binance USD-M, com prefixos de produtos personalizáveis (para evitar conflitos com nomes de produtos existentes), ou importação personalizada de variedades específicas;
2. Use o websocket para vincular a negociação de futu

Binary MA Cross MA Cross indicator by 4Umbella
Create for traders both experienced and inexperienced to use it because it is a basic indicator
How to use : 1. MA Fast : Moving Average fast (Period 4 upto 50) 2. MA Middle : Moving Average Middle (Period 10 upto 100) 3. MA Slow : Moving Average Slow (Period 50 upto 200) to control trend markets.
and trader can be set for Apply to price (Close, Open,Low,High,Median,Typical,weightd)
For alert you can set to alert Next bar or instant bar

Description
Trend Influencer is an indicator that determines the potential dynamics of the influence of trend wave movements on the market. The indicator is based on the value of moving averages corrected by the standard deviation. The indicator is displayed as a main dash-dotted moving average and a signal solid moving average. The signal moving average is colored blue or red depending on what type of trend is currently observed in the market. The indicator also draws inhibition levels - blue
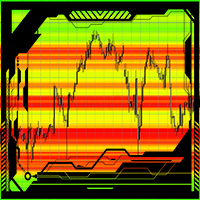
J.M.T.I
This indicator automatically shows a level or support and resistance in the currant market. Can be used on any time frame Can be used on any currency pair Works on the active bars in the window To add more bars one can simply zoom out. Red zones can be strong liquidity pools. Green zones usually is where an possible break out might occur. The higher the contrast of the colors the stronger the support or resistance levels will be. The indicator has an option to refresh on each tick
OCTOBER SALE!!! OCTOBER SALE!!! OCTOBER SALE!!!
Heiken Ashi Short Grid is an EA that is using the Heiken Ashi Indicator for the initial trade and uses grid trades when the the trade is on the losing side.
OPTIMIZED SETTINGS ARE AVAILABLE IN THE COMMENT SECTION!!! Optimized Currency Pairs: - AUDCAD - USDCAD - AUDUSD
Parameters: - Initial Volume 1 = 0.01 Lot will not open a martingale system 3 = 0.03 Lot for every $10,000 - Grid Size - Multiplier - Take Profit HEIKEN ASHI SETT

A média aritmética ou mediana pode ser usada para determinar a medida da tendência central de uma série temporal. Ambos os métodos apresentam algumas desvantagens. A média aritmética é calculada pelo indicador Simple Moving Average. É sensível a emissões e ruído. A mediana se comporta de forma mais estável, mas há perda de informação nos limites do intervalo. A fim de reduzir essas desvantagens, a filtragem de sinal pseudo-mediana pode ser usada. Para fazer isso, pegue a mediana de um pequeno c

O Indicador BOPCoiote é uma releitura do indicador Balance of Power proposto por Igor Livshin em Agosto de 2001, publicado na Stocks and Commodities Magazine. Uma média móvel de 14 períodos é recomendada para gráficos diários. Embora o número de períodos possa variar dependendo da natureza do mercado e dos prazos.
O nível em que ele agrupa seus fundos e topos é considerado uma das propriedades mais importantes do indicador BOP.
Durante as tendências de alta, suas máximas frequentemente tocam

Super Bollinger EA is an exclusive expert advisor that uses Bollinger Bands as indicator. It´s possible to configure the EA to trade as a low frequency or high frequency one - Scalping expert advisor. A Stochastic Oscillator filter is implemented to have some specific trades on Bollinger Bands. Takeprofit and Stoploss are calculated according to Bollinger Bands width or even with fixed TP and SL ( in points ). A trail and trade out system can also be configured and optimized. A number of orders

EMA Crossover Pro MT5 this EA uses two exponential moving average crossover, a slow ema, and a fast ema on which it takes buy/sell decision.
A default ema configuration is 12 and 35 where 12 is the value of slow ema, and 35 is the value of fast ema.
Expert advisor parameters:
stop loss (greater than 40, but some brokers accept stop loss under 40)
take profit (greater than 40, but some brokers accept stop loss under 40)
trailing_stop (set it as 0 for disabling trailing stop)
slow ema (21 by

Get a free complementary EA after your purchase! Contact me and ill provide it for you.
MT4 Version: https://www.mql5.com/en/market/product/61215
Some users are very comfort 2 able keeping their trades for ages, while other users are happy to get the least and leave :)
If you cannot wait on your trades, then this expert will be the best for you!
The expert tries to enter trades on a high probability of success, and in most cases it do catch the right wave. If not , don't worry

The EA is based on a scalping strategy in a calm market time. In quiet times, the price on the chart is almost always in the Flat, and the EA trades in the flat. The EA provide a variety of filters to filter out trend situations and trade only during flat price periods. Each trade uses a stop loss and take profit. Also, smart filters for fixing the transfer of stops to profit. To create a strategy, we used historical data with a history quality of 99.9%. The EA has the following features: Uses a
An indicator of patterns #7 and #8 ("Bump-and-Run" and "Bump-and-Run Reversal") from Encyclopedia of Chart Patterns by Thomas N. Bulkowski. Parameters: Alerts - show alert when an arrow appears Push - send a push notification when an arrow appears (requires configuration in the terminal) PeriodBars - indicator period K - an additional parameter that influences the accuracy of pattern shape recognition ArrowType - Character: from 1 to 17 ArrowVShift - vertical shift of arrows in pixels ShowL

EQUITY DRAWDOWN MONITOR This is a simple mt5 advisor that monitors the drawdon levels Features:
Easy to use Useful for money managers How to Use Load the EA once a single chart Type the maximum drawdown desired in inputs
Leave the EA alone and never close that chart The EA monitors all trades and magic numbers in your account.
Input Parameter Drawdown Percent: Maximum drawdown in percentage terms allowable in the account. When the drawdown level is surpassed, the EA will close all tra

You can think of these indicators as moving pivot points. MasterChartsTrading Price Action Indicators show good price levels to enter or exit a trade. The Blue indicator line serves as a Bullish Trend setter. If your instrument closes above the Blue line, we think about going Long (buying). When your trading instrument closes below the Red line, we think about Shorting (selling). It is very easy to read price action if you have a reference point. These support/resistance lines are there to help
An indicator of patterns #37 and #38 ("Rectangle Tops" and "Rectangle Bottoms") from Encyclopedia of Chart Patterns by Thomas N. Bulkowski. Parameters: Alerts - show alert when an arrow appears Push - send a push notification when an arrow appears (requires configuration in the terminal) PeriodBars - indicator period VertexCount - the number of tops and bottoms: 2, 3, 4. ArrowType - a symbol from 1 to 17 ArrowVShift - vertical shift of arrows in piхels ShowLevels - show levels ColUp - colo
Advanced Exponential VWAP Para detectar a atividade de grandes jogadores, estendemos o indicador VWAP padrão com novos elementos.
Este indicador calcula a média móvel da solução consistente de EMA[VWAP]=VWAP[EMA].
O desvio padrão é calculado com os mesmos pesos.
O parâmetro denominado "strain" é uma constante linear que move o resultado (strain)xSD(VWAP[EMA]).
Tanto o preço definido quanto o volume definido foram estendidos Figura:
9,[0,+1,+2],PlotMaximum,Density
9,[0,-1,-2],Plot

DYJ Tradays Economic Calendar is calendar Indicators of macroeconomic events for fundamental market analysis. Therein you will find financial news and indicators for the largest global economies – from the US and the EU to Australia and Japan, a total of 23 economies, involving more than 60 currency pairs. More than 800 macroeconomic indicators and events are collected from public sources in real time. Historical, current and forecast values, as well as importance characteristics are available

An indicator of patterns #11 and #12 ("Diamond Tops" and "Diamond Bottoms") from Encyclopedia of Chart Patterns by Thomas N. Bulkowski. Parameters: Alerts - show alert when an arrow appears Push - send a push notification when an arrow appears (requires configuration in the terminal) PeriodBars - indicator period K - an additional parameter that influences the accuracy of pattern shape recognition ArrowType - a symbol from 1 to 17 ArrowVShift - vertical shift of arrows in pixels ShowLevels - s
An indicator of patterns #39 and #40 ("Rounding Tops" and "Rounding Bottoms") from Encyclopedia of Chart Patterns by Thomas N. Bulkowski. Parameters: Alerts - show alert when an arrow appears Push - send a push notification when an arrow appears (requires configuration in the terminal) PeriodBars - indicator period K - an additional parameter that influences the accuracy of pattern shape recognition. Changes from 0 to 1 ArrowType - a symbol from 1 to 17 ArrowVShift - vertical shift of arrows
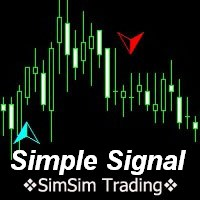
MT5 trend indicator works without redrawing. Provides signals for entering trades, works on charts of any instrument. Трендовый индикатор МТ5, работает без перерисовки. Выдает сигналы для входа в сделки, работает на графиках любого инструмента. Input parameters are for styling and messages only. / Входные параметры только для оформления и сообщений. All original signal calculations do not need additional parameters. / Все оригинальные расчеты сигнала, не нуждаются в дополнительных параметрах.

Let the KING trades!!!
KING of TRADES is a trading system that can be optimized according to: - Trend indicator: Ichimoku Kinko Hyo (either in different timeframe) - Trigger system: Fractals - Filter - trade in: Stochastic Oscillator (values and upper and lower limits) - Stops definition: ATR (period and long and short takeprofit and stoploss) - General: magic number, autolot (% balance), symbol digits, max spread and max number of openned orders Default configuration on EURUSD, H1.
O Mercado MetaTrader oferece um local conveniente e seguro para comprar aplicativos para a plataforma MetaTrader. Faça download de versões de demonstração gratuitas de Expert Advisors e indicadores a partir do seu terminal para testes no Testador de Estratégia.
Teste os aplicativos em diferentes modos para monitoramento do desempenho e assim fazer um pagamento para o produto que você deseja, usando o sistema de pagamento MQL5.community.
Você está perdendo oportunidades de negociação:
- Aplicativos de negociação gratuitos
- 8 000+ sinais para cópia
- Notícias econômicas para análise dos mercados financeiros
Registro
Login
Se você não tem uma conta, por favor registre-se
Para login e uso do site MQL5.com, você deve ativar o uso de cookies.
Ative esta opção no seu navegador, caso contrário você não poderá fazer login.