Conheça o Mercado MQL5 no YouTube, assista aos vídeos tutoriais
Como comprar um robô de negociação ou indicador?
Execute seu EA na
hospedagem virtual
hospedagem virtual
Teste indicadores/robôs de negociação antes de comprá-los
Quer ganhar dinheiro no Mercado?
Como apresentar um produto para o consumidor final?
Expert Advisors e Indicadores para MetaTrader 5 - 134

Premise SpreadTrend EA is a software that analyzes correlations and the spread between five forex pairs in search of a momentum of entry that can allow obtaining a statistical advantage to reach profit.
What is Spread Trading The Spread Trading is the study of the strength of two currency pairs at the same time in order to assess which of the pair is able to outperform the other. The object of the study is the correlation, volatility in time and the strength of trend.
What are advantages of
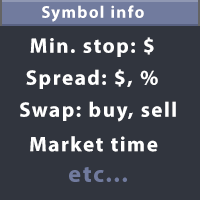
This utility displays the information required for making trades on each opened chart. For example: spread value, swap value; triple swap day; session closing time; ATR of the symbol by Gerchik; total profit/loss for the current symbol; the number of trades made earlier; the percentage change in the quotes of 6 selected instruments; and much more. The spread value is always shown. The rest of the information is displayed depending on the settings: Show total orders at the moment (long, short) .

Copier of deals from MetaTrader 5 to MetaTrader 5 ( MetaTrader 4<->MetaTrader 4 version is available ; with both versions, you can copy MetaTrader 5<->MetaTrader 4, MetaTrader 4<->MetaTrader 5, MetaTrader 5<->MetaTrader 5, MetaTrader 4<->MetaTrader 4). There is a demo version (restricting by grades and by lots) Works only in the mode of hedging Spread filter. Select the best price (start copying positions with a profit or loss). Configure the lot size, fixed or ratio-based (provider signals can
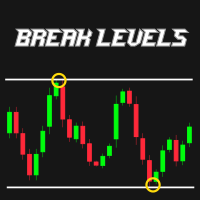
R747 BreakLevels is smart indicator that automatically detects Support and Resistance levels on actual market trend. Strength of levels can be easily adjusted by changing parameter LevelsStrength in range of 2 (weak levels) and 50 (strong levels). This indicator is accessible in EA via iCustom functions and is fully customizable by user. There is possibility to send Push notifications and Alerts of newly found levels.
Follow this link to get all detailed information: >> LINK <<
Features Adju
Check Online-Status monitors your terminal. If its connection to the server is interrupted for longer time, you will receive an email and/or a push notification, depending on what your settings. You can find out how long the terminal has been offline and can judge the quality of your brokers and/or the provider of your VPS after some time. Remember, the terminal manages and controls your money. Everything hangs in the air if it has no connection to the server! Check Online-Status displays the th
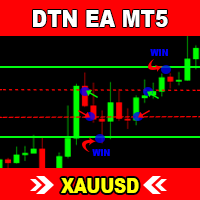
DTN EA MT5 is a fully automated Expert Advisor after research and development in a long time. It uses TREND to open orders, and uses HEDGING STRATEGY to protect your balance. So this stragety will reduce risk, protect your profit and your balance. It's only suitable with XAUUSD (GOLD) chart.
Indicator parameters Type Of First Order - BUY or SELL - The EA will open the first Order with BUY or SELL type. Magic Number - default is 168. Remember change Magic Number before running. The EA will use
The indicator is designed to calculate the correlation between major pairs and display cross-pair of overbought or oversold labels on the price chart.
The idea is that strong divergences of major pairs lead to an exit from the "equilibrium" of the corresponding cross pairs. With sufficiently large divergences, which are displayed by the indicator, the cross-pair is usually corrected by entering the "equilibrium". For example: when working on EURAUD pair, the difference for the period specified

This indicator is designed to help traders find the market entry and exit points. The indicator generates signals in the form of arrows, which is a simple and intuitive for use in trading. In spite of apparent simplicity of the indicator, it has complicated analytic algorithms which determine entry and exit points. Its operation is based on moving averages, RSI, candlestick patterns, as well as certain original developments. Open a Buy position when an upward arrow appears, and a Sell position w
O indicator Signal Noise é um oscilador, não parametrizado, gerado pelos ruídos máximo, mínimo e de fechamento para cada barra.
Parâmetros de entrada: Período: é o período utilizado como referência pelo filtro passa baixa na detecção do sinal.
Valores: High Noise: máximo ruído de alta; Power High Noise: demonstra a força do sinal de alta, quando o menor ruído da barra ocorre na mesma direção do sinal; Low Noise: máximo ruído de baixa; Power Low Noise: demonstra a força do sinal de baixa, qua

Pointer synchronization MT5 is an indicator with which the pointer can be synchronized in all the visible graphics of the terminal. It shows a cross cursor on all the visible graphics of the terminal, in position relative to the cursor of the active graph. To activate the indicator, simply press the button that appears in one of the corners of the chart once the indicator is added to the chart. To deactivate the indicator, simply press the button again. Once the indicator has been deactivated,
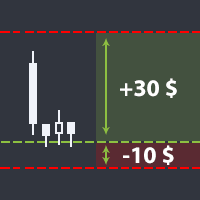
The utility helps open a deal with a stop loss that does not exceed the specified amount, or to refrain from it altogether. That is, it determines the number of lots to open the deal so that the stop loss is as close as possible to the specified amount in USD without exceeding it. For example, it will be indispensable when trading according to the Gerchik strategy. That is, when trading based on risks, with a fixed risk and a fixed take profit relative to stop loss. For example, if you always op

I want to present to you my solution in the implementation of automatic drawing of Fibo levels on the whole trend and the last trend leg. The logic of the indicator is based on the principle of swings, and when indicator gets a signal for a trend direction change, the previous key point before reversing is considered the start point of the indicator's drawing. When you test the indicator, note that changing the direction of the whole trend leg of Fibonacci often leads to a reversal of the trend.

O indicador VR ATR Pro é uma poderosa ferramenta profissional para determinar níveis planejados num instrumento financeiro. A eficiência do indicador foi provada com milhares de testos nas contas demo e reais. O indicador VR ATR Pro funciona usando dados reais e estatísticas vivas no tempo real. As estatísticas são uma ciência exata por isso os dados reais das estatísticas usados nos cálculos matemáticos permitem determinar níveis planejados exatos dum instrumento financeiro. Para um conjunto de

Presentation The URL html and xml to csv is designed to get contents from URLs with html or xml content, and to download it to an output format as a txt or as a csv file for MetaTrader 5. It enables to get the whole web sites page, starting with the http protocol, in a document for a further use and in additional with downloading directly on the MetaTrader applications and on the desktop. It is a good advantage for taking the most data from events and economic calendars, and also publications re

Do you need to check support and resistance lines? Do you need to find them really fast and automatically? Do you want to set your own settings how to find them? Then this indicator is your right choice! Indicator Lines is developed for finding support and resistance lines on chart. It does its job quickly and fully automatically. Main principle of algorithm is to get all extremes on chart (according to "Density" parameter). Then indicator tries to find minimally 3 points (according to "Minimal

This scanner shows the trend values of the well known indicator SuperTrend for up to 15 instruments and 21 time frames. You can get alerts via MT5, Email and Push-Notification as soon as the direction of the trend changes.
Important Information You have many possibilities to use the scanner. Here are two examples: With this scanner you can trade a top-down approach easily. If two higher time frames e.g. W1 and D1 are already showing green values (upward trend) but the H12 time frame shows a re

With this system you can spot high-probability trades in direction of strong trends. You can profit from stop hunt moves initiated by the smart money!
Important Information How you can maximize the potential of the scanner, please read here: www.mql5.com/en/blogs/post/718109 Please read also the blog about the usage of the indicator: Professional Trading With Strong Momentum.
With this system you have 3 reliable edges on your side: A strong trend (=high probability of continuation) A deep pu

The True channel indicator plots the linear regression channel. The channel consists of two lines of support and resistance, as well as the averaging trend line.
Additional information in the indicator support and resistance price for the current bar channel width channel inclination position of the channel price relative to the channel in percent
Settings Bars for calculation - the number of bars to plot the channel Price for calculation - the price for plotting the channel boundaries (Clos

This non-trading expert utilizes so called custom symbols feature ( available in MQL as well ) to build renko charts based on historical quotes of selected standard symbol and to refresh renko in real-time according to new ticks. Also, it translates real ticks to the renko charts, which allows other EAs and indicators to trade and analyze renko. Place RenkoCharts on a chart of a work instrument. The lesser timeframe of the source chart is, the more precise resulting renko chart is, but the lesse

Supporta is a trading indicator that automatically identifies support and resistance levels and their strengths from price movements and draws them on price charts. The instrument supports both the MetaTrader 4 and MetaTrader 5 terminals and can be used on any financial instrument and any timeframe. The MetaTrader 4 version is available on the market as Supporta MT4 . For full documentation and quick start, please refer to the official guidebook which is available for download in the comments se

The indicator shows the upper, middle and lower price limits for a certain period of time. Also, two Moving Averages (MAs) are displayed.
Parameters
CTType : corridor basis. _Hour : hours, _Day : days, _Bars : bars CTPrice : price type, by bars. OpenClose : Open/Close prices, HighLow : High/Low prices CTShift : corridor shift CTNum : how much to consider for building a corridor, min 2 CTPeriodFast : Fast period, min 2 CTShiftFast : Fast MA shift CTMethodFast : Fast averaging method CTPeriodSl

EA Mbot News Trader MT5 is an Expert Advisor based on a classical news trading strategy. You just need to configure from properties News time and the rest is automatically handled by the robot. The Expert Advisor uses pending orders expecting both breakout and rollback. Before news release, the EA places two pending orders at a preset distance from the current price. Once one of the orders triggers, the second one is deleted. A common trailing stop is used to manage positions. If a news release

This algorithm uses statistically justified comparison of market data, numerical constant values and output values of Stochastic indicators and Moving Averages in order to take decision whether it is necessary to open a position. Prior to giving birth to a new EA, this logic was created as a result of usage of Stochastic methods and then tested on historical data and checked with Monte Carlo method, which does not guarantee any results in the future, of course. No martingale is used. The robot i

Support and Resistance is a concept that price will tend to stop and reverse at certain predetermined price levels denoted by multiple price touches without breaking those levels. This indicator plots those lines of resistance and support which helps identify points of possible reversal by confirming and marking previous and current price levels. Also, it warns when price approaches latest marked levels.
Input Parameters range - the price period back to check for confirmation. confirmations -

This utility changes the behavior of auto-scroll. It removes the need to manually disable and re-enable the auto-scroll function.
Main features Disables auto-scroll - when the screen is scrolled backwards to look at the price history. Enables auto-scroll - when moved back to current history.
Inputs None.
Note I recommend testing when markets are open, since auto-scroll works when there are incoming ticks.

This algorithm uses statistically justified comparison of historical prices, moving average and output values of Williams R and Stochastic indicators in order to take decision whether it is necessary to open a position. Prior to giving birth to a new EA, this logic was created as a result of usage of stochastic methods and then tested on historical data and checked with Monte Carlo method, which, of course, does not guarantee any results in the future. The bot is designed to trade during evening

Market Profile helps the trader to identify the behavior if major market players and define zones of their interest. The key feature is the clear graphical display of the range of price action, in which 70% of the trades were performed. Understanding of the location of volume accumulation areas can help traders increase the probability of success. The tool can be used as an independent system as well as in combination with other indicators and trading systems. this indicator is designed to suit

Market Waves marks reversal price points on a chart following the modified Larry Williams method. The price is preliminarily smoothed using Heikin Ashi method. Open positions in the indicator signal direction. Note the patterns formed by reversal point groups. I recommend reading Larry Williams' "Long-Term Secrets to Short-Term Trading" before using the indciator.

This algorithm uses statistically justified comparison of numerical constant values and output values of Williams R, CCI and Stochastic indicators in order to take decision whether it is necessary to open position. Prior to give birth to a new EA, this logic was created as a result of usage of stochastic methods and then tested on historical data and checked with Monte Carlo method which does not guarantee any results in the future, of course. The bot is designed to trade during morning hours on

Super ATR is a powerful tool for analyzing the ATR (Average True Range) levels. The intuitive interface allows you to easily monitor all the main ranges of volatility.
Key Features Plots the daily АТR areas on the chart. Plots the weekly АТR areas on the chart. Plots the monthly АТR areas on the chart. Displays a panel with the current values of the main volatility ranges (M5,H1,D1,W1,MN) on the chart. The areas and values in the table change their color when the ATR level is reached. Draws th

This creates a mean-reversion chart using a moving average as a reference, detaching ourselves from the changing value of fiat currencies. [ Installation Guide | Update Guide | Troubleshooting | FAQ | All Products ] Get a mean-based view of the market Find real overbought/oversold situations easily Isolate your perception from the changing value of fiat currencies The center line represents the moving average Your imagination is the limit with this indicator Customizable chart period and Bolling

Spread Costs refers to the amount of the loss caused by the spread, and Swap Benefits refers to the amount of the income gained by overnight positions. Spread Costs is an important indicator for short-term traders, especially for scalping traders, and Swap Benefits is an important indicator for long-term traders. Since the spreads and swaps on the MetaTrader 5 platform are all expressed in points, we need to convert it into the amount expressed in the account currency. This tool can display the

This Expert Advisor's main strategy is based on the usage of two kind of indicators: two built-in shifted RSI to measure the asset prices oscillations and a Parabolic SAR to check the prices trends. It combines these indicators signals in order to get stronger signals and ensure the EA will do good trading operations.
It protects your money because it is provided with : Trailing stop loss to protect your profit. Once your order has a positive profit, it sets SL at a certain distance in order t
Those familiar with chess-playing robots that successfully defeat grandmasters, know very well what a complex and large card catalog is. As a result, the Expert Advisor's algorithm is based on 320 reversal and 302 flat patterns formed by day candles on 7 major currency pairs, displayed on screenshots ( EURUSD_i, GBPUSD_i) from 12.01.2012 to 04.22.2018 (account currency USD, "Every tick" test mode, M1, MetaTrader 5). Positions are opened by analyzing the current and previous day candles with impu

You can avoid constant monitoring of computer screen waiting for the DeMarker signal while receiving push notifications to a mobile terminal or a sound alert on the screen about all required events, by using this indicator - DeMarker Alerts. In fact, it is the replacement of the standard indicator with which you will never miss the oscillator signals. If you don't know the benefits of DeMarker or how to use it, please read here . If you need signals of a more popular RSI indicator, use RSI Alert
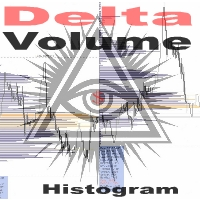
The " Delta Volume histogram " Expert Advisor plots histograms of "Delta volume", "Real volume", "Buy volume", "Sell volume", "Tick volume".
EA version: Has a built-in «Pending orders indicator". The indicator is designed for analysis of pending orders in the market, available in "MarketBook". Displays the Volume profile levels (VAH VAL from 60% to 85%). Built-in side histogram. This is a powerful tool for analyzing trade volumes. The chart is plotted based on tick data.
Depending on the broke

The Extremum catcher MT5 indicator analyzes the price action after breaking the local Highs and Lows and generates price reversal signals with the ability to plot the Price Channel. If you need the version for MetaTrader 4, see Extremum catcher . The indicator takes the High and Low of the price over the specified period - 24 bars by default (can be changed). Then, if on the previous candle, the price broke the High or Low level and the new candle opened higher than the extremums, then a signal
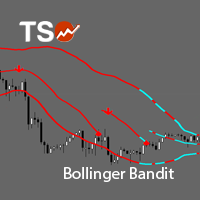
TSO Bollinger Bandit Strategy is an indicator based on the Bollinger Bandit Trading Strategy as presented in the book Building Winning Trading Systems with TradeStation by G. Pruitt and J. R. Hill. SCANNER is included . Now with Scanner you can find trading opportunities and setups easily and faster.
Features A complete entry and exit strategy for trending markets. Get email / push notifications when an entry signal occurs. The indicator is not repainting. Can easily be used in an EA. (see F
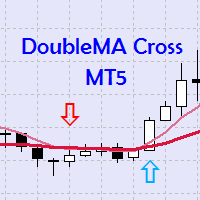
The "DoubleMA Cross MT5" is a typical strategy of investors, which usually indicates a change in trend from bearish to bullish. To establish a double crossing of moving averages, we need a slow moving average and a fast moving average. When the fast moving average crosses the upside to the slow average the bullish signal is triggered. The opposite strategy is also very useful. Everything works in the same way and we use the same indicators and periods: Fast moving average and slow moving average

Introduction to Harmonic Volatility Indicator Harmonic Volatility Indicator is the first technical analysis applying the Fibonacci analysis to the financial volatility. Harmonic volatility indicator is another level of price action trading tool, which combines robust Fibonacci ratios (0.618, 0.382, etc.) with volatility. Originally, Harmonic Volatility Indicator was developed to overcome the limitation and the weakness of Gann’s Angle, also known as Gann’s Fan. We have demonstrated that Harmonic

Risk Manager Pro is a simple utility that calculates the necessary lots with the risk percentage and the pips of stop loss, before opening positions. The web calculators can be useful in some cases but they are not efficient to open operations in real time. In the trading days, there are few opportunities to open positions and when the opportunity arises, the seconds make the difference. This is not possible with conventional web calculators, since to calculate the size of an operation regarding
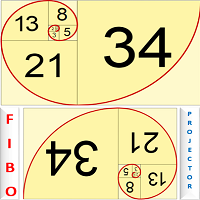
This indicator will automatically draw 4 Fibonacci levels on the chart. Dynamic Fibonacci will be drawn on the last of zigzag line. Static Fibonacci will be drawn on the 3 last of zigzag line. Fibonacci projection 1 and 2 will be drawn on the last zigzag line also. This way, you can see several Fibonacci level to get prediction of next support and resistance of market price. Indicator does not work if less than 500 bars are available.
Parameters Zig_Zag_Parameter Depth - Zig zag depth paramete

A grid expert with a trained neural network for the GBPUSD currency pair, timeframe H1. Fully ready to work. The expert determines the trend and opens a series of orders for each price correction. It is possible to limit the number of orders in each grid of orders. To work, you can use a standard lot or a percentage of available funds. The Expert was tested on an account with a leverage of 1:100, with a different leverage, change the Percentage parameter.
Parameters PlusB

The ForexGenerated Expert Advisor works based on short-term changes in the trend, creating the price "corridor" set in the parameters. Trading is carried out at the external borders of this corridor by opening positions in different directions with different lot sizes. This achieves a very high probability of closing positions in profit. ForexGenerated is intended for trading any currency pair on the M5 timeframe or higher. However, backtests indicate that it is best suited for NZDUSD on M5.
C

O indicador mostra os níveis máximo/baixo/aberto/fechado de outros períodos de tempo (e não padrão) - Ano, 6 meses, 4 meses, 3 meses, 2 meses, mês, semana, dia, H3-H6-H8-H12 horas . Você também pode definir o turno de abertura das velas e construir velas virtuais. Os "separadores de período" para um desses intervalos de tempo estão disponíveis na forma de linhas verticais. Os alertas podem ser configurados para quebras dos níveis atuais ou anteriores (quebra da linha alta/baixa de ontem/semana

This algorithm uses statistically justified comparison of historical prices and output values of the CCI and ATR indicators to decide whether it is necessary to open position. This logic has been created as a result of the use of stochastic methods, it has been tested on history data and verified by the Monte Carlo method, which, of course, does not guarantee future results. The EA is designed to trade EURUSD M15 during morning hours. Despite the fact that this condition is not mandatory, the tr

ACB Trade Filter indicator provides a way to filtering out the low probability trading entries in a trading strategy. The indicator uses a sophisticated filtration algorithm based on the market sentiment and trend. The MT4 version of the same indicator is available here ACB Trade Filter MT4
Applications Works great with our indicator ACB Breakout Arrows MT5 Filter out low probability signals from any indicator. Avoid over-trading and minimize the losses. Trade in the direction of market sentim

Harrow Strikes is an Expert Advisor that has been developed based on Harrow Order for MetaTrader 4. This is the MetaTrader 5 version and also based on Support and Resistance, Martingale and Anti-Martingale method. Since MetaTrader 5 already supports the use of hedging in trading, the algorithm of this EA has little differences from the original Harrow Order. For more information about Harrow Order, you can read https://www.mql5.com/en/market/product/28456 . Same as Harrow Order, the Support and

MeetAlgo Asian Scalper is an Expert Advisor that uses range breakouts strategy to enter trades when the market is the most quiet. It will scalp the market for small price deviations. This EA will need a good broker with small spread to work successfully. It is fully optimized for AUDCAD, EURAUD, GBPAUD, GBPCAD, GBPCHF and GBPUSD . The trades are based on several indicators and it's not a tick scalper EA. It need 1:300 leverage minimum, and a low spread broker. It is recommended to use a low spre

Easy Relative Smooth Index O Easy Relative Smooth Index é um oscilador baseado no indicador de índice de força (RSI). O valor atual das leituras do indicador é comparado com os valores máximo e mínimo do indicador para o período especificado e o valor médio é calculado. As leituras do indicador também são suavizadas usando o método de média móvel (MA). Um sinal de compra é o cruzamento de um determinado nível pelo indicador de baixo para cima, um sinal de venda é o cruzamento de um determinado

Regent Street, rather than an expert or an indicator, is an all-in-one trading assistant easing your trading sessions by providing signals and notifications. It's an assistant rather than a robot - "an assisted steering rather than an autopilot", and now, it autoadjusts itself to any instrument, any timeframe & any circumstance. Note from the author: Regent Street's frontend is exactly the same as an other product Ermou Street , but the backend is different. Performances for each are very relati

This is an automated Expert Advisor that trades using the MACD and Envelopes indicators. The paid version is available here . The free version has the following limitations. No panel for opening orders. The trading is limited to the EURUSD currency pair and similar. Orders can only be opened with the minimum lot, no more than 5 orders can be opened in the same direction, to a total of 10 orders. Pause after closing of all orders is 6000 minutes. During the analysis, no more than 50 orders are ad
FREE

A personal implementation of a famous trend principle known as higher high, higher close, lower low, lower close (HHHC - HHHL). It uses price action alone to determine trend direction, trend changes and pullback zones. [ Installation Guide | Update Guide | Troubleshooting | FAQ | All Products ] Customizable breakout period Customizable colors and sizes It is non-repainting and non-backpainting It implements alerts of all kinds The indicator defines three price zones: Buy zones are blue Sell zon

This is a general purpose indicator that displays colored lines at fixed and customizable price intervals, entered as parameters. It offers universal, constant, and familiar price ranges that allow quick and precise price analysis of a currency pair. With default parameters, this indicator implements The Quarters Theory , as described originally by Ilian Yotov . [ Installation Guide | Update Guide | Troubleshooting | FAQ | All Products ] Easy to use No optimization needed Customizable price int
The EA is recommended for trading GBPUSD M5. It is based on the strategy of "waiting out", the market entry (and exit) points are determined on the basis of correlation of a number of indicators. The trading volume for opening a position depends on results of previous trades. It is possible to limit the amount of risk (the AutoMM parameter). It is also possible to set the maximum spread, above which the EA will automatically suspend trading (the MaxSpread parameter). It also has advanced feature

One of the main goals in the development of this Expert Advisor was ease of use. As a result, this EA has a minimum of parameters, which are easy to understand. At the same time, it is very flexible and customizable for almost for any instrument (currency pair).
The logic According to the given algorithm, the EA determines local support and resistance levels (at startup, the previous quotes are disregarded). When a candle closes beyond any level, a deal is opened in the same direction. By defa
Would you like to have statistics about your trades displayed while you operate? Have you a solid understanding of the symbol you are trading? Do you really know everything you need to about your trading account? Do you need to keep an eye on the local times around the world? Advanced Info Displayer answers to all that. It helps you to know many hidden or hard to find data. Also, it is very convenient if you value statistics and maths. Just to exemplify, in more than 80 lines of information you

As the name suggests, the utility collects ticks and uploads them to a file. Each symbol receives its own folder. A directory in the symbol folder is created for each date so that you can find ticks of a necessary symbol and date quickly and easily. The collector is made as fast as possible within MQL. One collector is sufficient for each symbol. Timeframe does not matter. The utility features the function for displaying ticks collected in a file on a chart. You can also navigate ticks using a k

Slope Direction Side Slope Direction Side é um indicador de tendência baseado em médias móveis. O indicador reflete tendências na dinâmica dos preços nos mercados. Existem três tendências principais na dinâmica dos preços: movimento ascendente, movimento descendente e movimento lateral dos preços. O indicador ajuda a determinar a direção predominante do movimento dos preços - tendência, suavizando os dados dos preços ao longo de um determinado período de tempo. Em termos simples, o indicador p

One of the main goals in the development of this Expert Advisor was ease of use. As a result, this EA has a minimum of parameters, which are easy to understand. At the same time, it is very flexible and customizable for almost for any instrument (currency pair).
The logic According to the given algorithm, the EA determines local support and resistance levels (at startup, the previous quotes are disregarded). When a candle closes beyond any level, a deal is opened in the opposite direction, exp

Copyist MS — это простой и удобный в использовании торговый копир. Работает как однофайловый советник с переключаемыми режимами работы Master и Slave. Ордера можно копировать из МТ5 в МТ5, из МТ5 в МТ4, из МТ4 в МТ5. Для копирования ордеров в MetaTrader 4 требуется версия советника для MetaTrader 4. Текущая версия советника работает только на ХЕДЖИНГОВЫХ счетах. Параметры Тип работы - выбор режима работы: Master или Slave; Копировать по магическому номеру - копирование торговых ордеров по магич

This EA uses an Alligator indicator and has a classic strategy to trade as the Alligators Jaw, Teeth and Lips calculation results are compared each tick. This way, the EA opens orders at right moment and closes the orders as it reaches the right profit value. It protects your money because it is provided with: trailing stop loss to protect your profit. Once your order has a positive profit, it sets SL at a certain distance in order to keep a positive profit; Spread value limit to prevent opening

Turnover O Expert Advisor não usa indicadores, ele funciona apenas com pedidos pendentes BUYSTOP e SELLSTOP. Todos os trabalhos e cálculos no EA são baseados em ordens pendentes e posições abertas no mercado. O EA usa aumento automático de lote para posições médias. O limite de perda é definido como um número negativo especificado como uma porcentagem do saldo. Quando o EA é lançado, dois pedidos pendentes são colocados. Se o pedido for acionado, ele fecha com o lucro definido ou, se o lucro d

The Trade Helper indicator is a modification of the Trade Assistant indicator (by Andriy Moraru). The Trade Helper multitimeframe indicator is a good assistant for traders, useful as a filter in most trading strategies. This indicator combines the tactics of Elder's Triple Screen in a single chart, which lies in entering a trade when the same trend is present on three adjacent timeframes. The indicator operation is based on the principle of determining the trend on the three selected timeframes

Lotus indicator combines the features of both trend indicators and oscillators allowing you to track the smoothed price change rate, as well as trend strength and change. The uptrend is shown as a green indicator line, while a downtrend is displayed in red. A long position can be opened when the indicator breaks the zero level from below. A short position can be opened when the indicator breaks the zero level from above. An opposite signal of the indicator can be used for exiting positions. You

O indicador "Gap on chart" permitirá que você veja as diferenças de preço no gráfico. Os níveis de quebra são estendidos no tempo até que o preço bloqueie a diferença de preço. O indicador permite ajustar a sensibilidade - qual o tamanho da lacuna nos pontos para mostrar e qual a profundidade do histórico para analisar.
Para uso na negociação automática, é usada a numeração das diferenças de preço de acordo com o método LIFO, ou seja, a última diferença de preço formada tem o número 1.

Calculation panel has been developed to aid in Forex trading using a method based on correlation dependence of currency pairs. The panel implements: Due to the fact that the working instruments of the "basket" have an equal volatility and pip values, the panel provides automatic calculation of the second instrument's lot size. To analyze the relative divergence of two currency pairs, the information based on the RSI indicator values (in percentages) are shown on the panel. Information on swaps o

EFW Pattern Trader is a powerful pattern scanner for Forex and Stock trading. The pattern detection in EFW Pattern Trader uses the Fractal Wave Theory, which captures the endless up and down movement of the market. Therefore, EFW Pattern Trader can be considered as the robust price action indicator. Any patterns in EFW Pattern Trader can be backtested visually in your strategy tester. Visual backtesting with pattern will show you how pattern will likely behave in the live trading. Therefore, you

O indicador Mercadulls fornece 4 tipos de sinal, detectando suportes e resistências, acumulação/distribuição. O indicador varre constantemente o gráfico para análise de direção e surgimento de longas tendências. Características principais Não Repinta! Parar perda e tomar níveis de lucro fornecidos pelo indicador. Adequado para Day Traders, Swing Traders e Scalpers. Algoritmo otimizado para aumentar a precisão dos sinais. Indicador para análise técnica para todos os ativos disponível no mercado.
The EA is recommended for trading EURUSD(or EURGBP) M15 or M30. It is based on the strategy of "waiting out", the market entry (and exit) points are determined on the basis of correlation of a number of indicators. The trading volume for opening a position depends on results of previous trades. It is possible to limit the amount of risk (the AutoMM parameter). It is also possible to set the maximum spread, above which the EA will automatically suspend trading (the MaxSpread parameter). It also h
O Mercado MetaTrader é a única loja onde você pode baixar um robô demonstração de negociação gratuitamente para testes e otimização usando dados históricos.
Leia a visão geral e opiniões de outros clientes sobre os aplicativos, faça o download para o seu terminal e teste um robô de negociação antes de comprá-lo. Apenas no Mercado MetaTrader você pode testar um aplicativo de forma absolutamente gratuita.
Você está perdendo oportunidades de negociação:
- Aplicativos de negociação gratuitos
- 8 000+ sinais para cópia
- Notícias econômicas para análise dos mercados financeiros
Registro
Login
Se você não tem uma conta, por favor registre-se
Para login e uso do site MQL5.com, você deve ativar o uso de cookies.
Ative esta opção no seu navegador, caso contrário você não poderá fazer login.