Conheça o Mercado MQL5 no YouTube, assista aos vídeos tutoriais
Como comprar um robô de negociação ou indicador?
Execute seu EA na
hospedagem virtual
hospedagem virtual
Teste indicadores/robôs de negociação antes de comprá-los
Quer ganhar dinheiro no Mercado?
Como apresentar um produto para o consumidor final?
Novos Expert Advisors e Indicadores para MetaTrader 5 - 86

O EA trabalha com o princípio do desvio máximo do preço do valor médio. A ideia é que o preço sempre busca o equilíbrio, e qualquer grande desvio da média leva a uma força recíproca - reação. A entrada é realizada nestes desvios. Este é um exemplo de um sinal para este consultor https://www.mql5.com/en/signals/2047087
(você pode negociar de forma mais conservadora, se desejar).
Opções: sigal_deviation - desvio máximo após o qual uma negociação é aberta;
Filtros: closeBarOnly - funciona ap

Lógica de trabalho
O utilitário Stop Out é um indicador simples, mas muito conveniente, que mostra quantos pontos faltam para o nível Stop Out /
Seu benefício reside no fato de que muitos corretores superestimam deliberadamente o risco na negociação em busca de lucro, usam a margem disponível ao máximo, e para este caso é muito importante saber onde o corretor pode fechar suas posições à força.
Basta colocar o indicador no gráfico e, dependendo da posição aberta em Compra ou Venda, você v
FREE

Smart Gridder MT5 é baseado em RSI e Bollinger Bands. As configurações otimizadas serão fornecidas abaixo. A estratégia da EA é baseada na vela cruzando as bandas de Bollinger e o RSI será o fator decisivo se abrirá uma negociação de compra ou venda. O tamanho da grade será calculado automaticamente.
CONFIGURAÇÕES OTIMIZADAS:
DEPÓSITO MÍNIMO: Conta de $ 400 Cent
EURUSD - https://drive.google.com/file/d/1BVz5ad8kwgz7NcJCNr0mfQzGurc53u1t/view?usp=sharing GBPUSD - https://drive.goog

Display rectangles and trendlines list from Trading box Technical analysis tool. Objects are ordered in the list by pip distance that is difference between object price and Bid price. With this tool you will know which chart to look for next trading opportunity. No more switching between charts and searching for trades where price is close to rectangle zone or trendline support resistance level. Sorted Rectangles and Trendlines by pip distance - If you are trading on multiple charts, the
FREE

GRat Clusters is an indicator that shows various data in the form of clusters on a price chart: volume, delta, ratio of sales and purchases, etc. It allows you to visually see the market profile in real time and on history at a given depth. Capabilities 1.8 types of cluster data: volume, delta, purchases and sales , volume and delta, imbalance between sales and purchases , volume profile, delta profile, buy and sell profile. 2. A cluster period can be either any available in MT5 timeframe or

The Asian Session - it is a Secure Automated Software for trade Forex market and indices.
This system detects the ranges between the end of the American session and the beginning of the Asian session, operating in favor of the break, thinking that this break prior to the start of the session occurs because within the Asian session there will be an impulse in favor of the break. breaking off. To adapt to the different schedules of the different brokers, you have to set the closing time of the A

Expert capable of generating profit by opening positions randomly. Shows good results in long-term trading – on timeframes from H12.
Features Fully automatic mode is available. Positions are opened randomly. Martingale is applied – if the previous position closed with a loss, the current one is opened with a volume that compensates for that loss.
Parameters Mode – Expert's operating mode: Automatic – automated (recommended); Manual – manual. In automatic mode, the Expert does not require any
FREE

Santa Trend Indicator is an efficient way to forecast and detect the trend in any market. Advantages Generates instant buy and sell signals. Provides an alternate exit strategy to your existing trading system. Never repaints, never backpaints, never recalculates. Works in all symbols and all timeframes. Perfect trend filter for any strategy or expert advisor. Fully compatible with Expert Advisor (EA) development. Does not lag.
FREE

This is an intra day strategy that is simple and resilient for long term use. There are only a few parameters and the entry is triggered by price action, no indicators are needed. The time of entry and exit will affect the performance, defaults can be used for safe and conservative trading. Broker spreads will also affect the returns, because it is intraday, the frequency of trade is once per day per pair. Do try out the backtest and forward test to verify the results. No grid or martingale
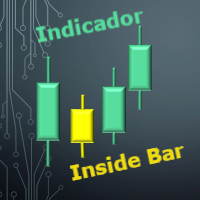
Identificador de Inside Bar O Inside Bar é uma formação de vela de reversão / continuação, e é um dos padrões de Candle mais operados pelos trader. Esse indicador permite que você identifique um O Inside Bar no gráfico de forma rápida e fácil, lhe permitindo uma tomada de decisão muito rápida e precisa. Sendo ideal para lhe ajudar nas suas diversas estratégias de Day Trade ou swing trade. O visual e a marca registrada da análise gráfica por esse motivo esse indicador conta com 3 opções visuais p

Santa Donchian Indicator is an efficient way to detect support, resistence and break outs in any market.
The Donchian channel measures the high and the low of a previously defined range. Typically, a trader would look for a well-defined range and then wait for the price to break out to either one side for a trade entry trigger. Advantages Never repaints, never backpaints, never recalculates. Works in all symbols and all timeframes. Perfect trend filter for any strategy or expert advisor. Fu
FREE

MT4/5通用交易库( 一份代码通用4和5 ) #import "K Trade Lib5.ex5" //简单开单 long OrderOpen( int type, double volume, int magic, string symbol= "" , string comment= "" , double opprice= 0 , double sl= 0 , double tp= 0 , int expiration= 0 , bool slsetmode= false , bool tpsetmode= false ); //复杂开单 void SetMagic( int magic, int magic_plus= 0 ); void SetLotsAddMode(int mode=0,double lotsadd=0); long OrderOpenAdvance( int mode, int type, double volume, int step, int magic, string symbol= "" , string comm
FREE

Santa Bollinger Indicator is an efficient way to detect price retracement in any market. A common approach is to identify overbought or oversold market conditions. When the price of the asset breaks below the lower band of the Bollinger Bands, prices have perhaps fallen too much and are due to bounce. On the other hand, when price breaks above the upper band, the market is perhaps overbought and due for a pullback . Advantages Generates instant buy and sell signals. Never repaints, never back
FREE
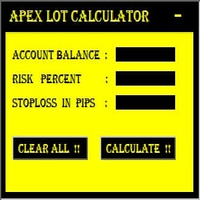
MT5 It Calculates Lot size for Manual Money Management.
If you want any custom feature or want to remove something from this product for your personal use. Please send me a personal message, I'll be happy to do so for you.
Inputs : Account Balance Risk Percent StopLoss in Pips
How to Use it : Put it on the Chart of Currency Pair which wanted to be Calculated Fill up All three Input fields with Desired Details After filling input
FREE

Adapted from the award winning international best seller (Short Term Strategies That Work) by Larry Connors and Cesar Alverez in 2008, this concept was retested 10 years after the book published and that will give you an idea of the concept if it still works. Take the last 10 years as walk forward and this strategy is added with a twist to risk management with arbitrary 5% stop loss and exit day counted as calender days instead of trading day. This EA works on dual mode, Long and Short. Origin

Open Risk Profit shows your current risk or possible profit of all open positions. Total open risk is your loss if all positions run into the stop loss.
Total open profit is your profit if all positions reach your take profit.
Total float is your current profit or loss of all positions. The program also breaks down the information into the individual symbols. For example, you can monitor how much is your current profit and your potential risk in EURUSD, no matter how many individual positio
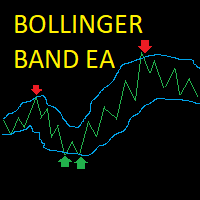
Bollinger Band Scalper EA This EA opens trades when the price hits and bounces off the Bollinger Bands, it closes the trade when it reaches the opposite Bollinger band or if the price reverses into the trailing stoploss. Posisitions are sized dynamically depending on the user's account balance. The EA waits for the price to cross the Bollinger Band and then opens a market order at a set percentage of the bandwidth from the band chosen by the user. The position is sized a percentage of the user's
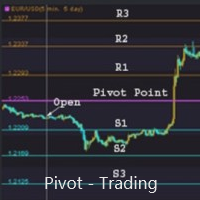
支点交易 : 1.pp 支点 2. r1 r2 r3 , s1 s2 s3 交易实用必备工具指标 波浪自动计算指标,通道趋势交易 完美的趋势-波浪自动计算通道计算 , MT4版本 完美的趋势-波浪自动计算通道计算 , MT5版本 本地跟单复制交易 Easy And Fast Copy , MT4版本 Easy And Fast Copy , MT5版本 本地跟单复制交易 模拟试用 Easy And Fast Copy , MT4 模拟账号运行 Easy And Fast Copy , MT5 模拟账号运行
支点( pivot points) 作为一种交易策略已经很长时间了,最初是场内交易员使用这种方法。使用这种方法通过几个简单的计算就可以了解市场在一天中的去向。 支点法中的支点是一天中市场方向的转向点,通过简单地计算前日的高点、低点和收盘价,可以得到一系列点位。这些点位可能形成关键的支撑和阻力线。支点位,支撑和阻力位被统称为支点水位。 你所看到的市场每天都有开盘价、高价、低价及收盘价(有一些市场是 24 小时开盘,比如外汇市场,通常用 5pm EST 作为开盘和收盘时间)。这些信

CandleVolume is an indicator that colors bars according to increasing or decreasing volume. You can use it to identify strategic regions of the chart and complete an analysis. White means low volume, yellow means medium volume and red means climax volume. It is a recommended indicator if you like to interpret market contexts and understand how market cycles work.

Все паттерны из книги Томас Н. Булковский "Полная энциклопедия графических ценовых моделей" в одном индикаторе со сканером. Cканер включается параметром ScannerMode. При ScannerMode=false индикатор ищет один паттерн (выбирается переменной Pattern). При выявлении паттерна индикатор рисует стрелку, открывает окно сообщений, выполняет push-уведомление. У индикатора много параметров, некоторые их них задействованы всегда, некоторые выборочно. Включите переменную ShowHelp - на графике отобразится по
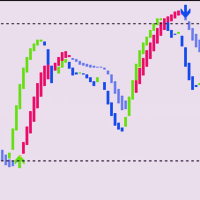
Reversal candles indicator , use in second window with rsi,levels 10-20-50-80-90 so u can see where the reversal candles pop upat the overbought oversold rsi levels.Great oppertunity to get in early and get out at the best moment. Candle turns blue at the 10-20 level "buy" candle turns red at the 90-80 level "sell" Always look at the major trend beore taking a buy or sell!!!

This EA uses the following Built-in indicators: Channels indicator Supply and demand indicator Trend indicator It is based on multi-directional grid system, not the normal martingale you are familiar with. When the price is in supply or demand zones, the EA will wait for a confirmation before entering a position. The confirmation is through the three above indicators together. You don't need to purchase any of the indicators mentioned above if you don't want to see them on the live chart.
Necessary for traders: tools and indicators Waves automatically calculate indicators, channel trend trading Perfect trend-wave automatic calculation channel calculation , MT4 Perfect trend-wave automatic calculation channel calculation , MT5 Local Trading copying Easy And Fast Copy , MT4 Easy And Fast Copy , MT5 Local Trading copying For DEMO Easy And Fast Copy , MT4 DEMO Easy And Fast Copy , MT5 DEMO
Auxiliary indicators It waits for the hunt, waits for the price limit to appear, waits for

Diagrama de tijolo - uma forma alternativa de negociação Se você é um trader que está confuso com as velas em inúmeros gráficos, ou não sabe como desenhar linhas ou como desenhar linhas de suporte e resistência, você deve encontrar outro método de negociação que seja adequado para você neste momento. Assim como um driver pára para uma revisão completa depois de encontrar problemas repetidamente, o mesmo é válido para uma transação. O gráfico de blocos fornece um método de negociação simples para

O robô utiliza um dos indicadores mais utilizados na Ásia:
NUVEM DE ICHIMOKU
Existem duas estratégias de negociação:
Cruzamento das linhas Tenkan e Kijun e; Cruzamento das linhas do Kumo.
Suporte e dúvidas dos produtos no link Abaixo: Suporte
As aberturas de posição são baseadas nos parâmetros identificados como sinais, caso ative todos o robô emitirá ordem de negociação somente se o número de sinais for maior que o mínimo estipulado pelo usuário.
Caso tenha dúvidas sobre o robô o

Este indicador detecta um flat e pinta a área encontrada com um retângulo colorido.
A ideia principal deste indicador é detetar um flat quando o preço preenche uma determinada área no gráfico.
Parâmetros de entrada:
Color rectangle - cor do retângulo a ser sombreado.
Bars in rectangle - número mínimo permitido de barras num retângulo. Density in % - densidade do flat, definida como uma percentagem da área do retângulo.

Versão MT4: https://www.mql5.com/en/market/product/72558 A estratégia é baseada na recuperação dos níveis mais importantes de suporte e resistência. O algoritmo não usa estratégias de alto risco. Cada comércio é protegido por vários níveis de controle. Um algoritmo de rastreamento de transação adaptável é usado. A estratégia foi testada com sucesso ao longo de todo o histórico disponível, com uma qualidade de simulação de 100%. Com slippage e comissões próximas das condições reais de m

O indicador "Elder Ray" ou "Ray" é baseado nos osciladores do Dr. Alexander Elder: Bulls & Bears Power. Ambos trabalham com um EMA. Esse indicador é usado pelos comerciantes para identificar divergência, instruções de mercado e muito mais ... o método do Dr. Elder geralmente usa um período EMA de 13 dias, mas isso pode ser modificado com base em sua demanda pessoal.
Os cálculos são: Bulls Power = Candle High - Ema Fecht Urso poder = vela baixa - ema feche A linha de limão representa a energia
FREE

Ing (inguz,ingwar) - the 23rd rune of the elder Futhark ᛝ, Unicode+16DD. Add some runic magic to your trading strategies. The correct marking of the daily chart will indicate to you the successful moments for counter-trend trading. Simple to use, has high efficiency in volatile areas. Be careful in lateral movements.
Signals ᛝ are generated when the main lines of construction intersect.
Red arrow down - recommended sales
Blue up arrow - recommended purchases
rare purple arrows indicate

Implements a channel based on integrated comparison of moving average values with improved functionality. As a result, the chart displays a channel of deltas of moving averages in the center line and an indentation of the channel boundaries over a specified range.
What is the channel? This is the price range (limited), in which all its dynamics (movement) takes place over a certain period of time. This method is very old, the Forex channel strategy dates back to a long time, when the theory

Bollinger Bands (BB) are similar to Envelopes. The difference between them is that the boundaries of the Trade Bands (Envelopes) are located above and below the moving average curve at a fixed percentage distance, while the Bollinger Bands are plotted at distances equal to a certain number of standard deviations. Since the magnitude of the standard deviation depends on volatility, the bands themselves adjust their width: it increases when the market is unstable, and decreases in more stable per

Moving average, moving average (English Moving average, MA) is a general name for a family of functions, the values of which at each point of determining the level of some average value of the original function for the previous period.
CalcPipsOn - In order to add rozruhunok on the chart, you must activate this field.
The previous development of a variant of this indicator differed in that it had an extended functionality for calculating averaging in the set, as well as advanced possibili

Todo crédito deste indicador é do Tiago Lacerda autor do video e quem disponibiliza o indicador GRATUITAMENTE Se inscrevam no canal dele https://www.youtube.com/channel/UCWGreIMXXE1k_7hzyRtduIw  ; segue a Pamm para investimento do Tiago https://www.mql5.com/pt/signals/881577?source=External%3Ahttps%3A%2F%2Fwww.youtube.com%2F
Túnel de Vegas, com até 20 níveis, permitindo plotar ou não cada nível com troca de cor, espessura das linhas e visualização ON/OFF para facilitar a utilização 100%
FREE

Implements a channel based on the moving average indicator with improved functionality.
Moving average, moving average (English Moving average, MA) is a general name for a family of functions, the values of which at each point of determining the level of some average value of the original function for the previous period. The channel moves up and down relative to the moving average by a specified number of points.
This indicator is suitable for those who are interested in the classic calc
Moving average, moving average (English Moving average, MA) is a general name for a family of functions, the values of which at each point of determining the level of some average value of the original function for the previous period.
This indicator is suitable for those who are interested in the classic calculation method but with improved functionality. There is a version for both MT4 and MT5.
Moving averages are commonly used in time series data to smooth out short-term fluctuations a
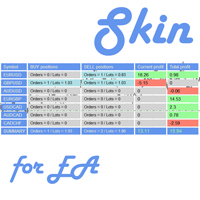
This utility is a graphical shell for other Expert Advisors that do not have their own graphical shell or whose graphical shell you do not like. Just run the utility on a free chart of any currency pair, specify in the input parameters the "Magic Number" of the advisor to which you want to connect the utility, and a graphical shell will appear on the graph, containing information about the traded currency pairs, current positions and trading results of your advisor. If you like this utility, tak
FREE
An indicator of patterns #5 and #6 ("Wedges, ascending, broadening" and "Wedges, descending, broadening") from Encyclopedia of Chart Patterns by Thomas N. Bulkowski.
Parameters: Alerts - show alert when an arrow appears Push - send a push notification when an arrow appears (requires configuration in the terminal) PeriodBars - indicator period ArrowType - a symbol from 1 to 17 ArrowVShift - vertical shift of arrows in pixels ShowLevels - show levels ColUp - color of arrow up СolDn - color
An indicator of patterns #1 and #4 ("Broadening Tops" and "Broadening Bottoms") from Encyclopedia of Chart Patterns by Thomas N. Bulkowski. Version 1: bottom, top, bottom, top, top breakout. Version 2: top, bottom, top, bottom, top breakout.
Parameters: Alerts - show alert when an arrow appears Push - send a push notification when an arrow appears (requires configuration in the terminal) Variant1 - show version 1 of the pattern Variant2 - show version 2 of the pattern PeriodBars - indicat
An indicator of patterns #2 and #3 ("Broadening formation right-angled and ascending" and "Broadening formation right-angled and descending") from Encyclopedia of Chart Patterns by Thomas N. Bulkowski.
Parameters: Alerts - show alert when an arrow appears Push - send a push notification when an arrow appears (requires configuration in the terminal) PeriodBars - indicator period K - an additional parameter that influences the accuracy of pattern shape recognition. The smaller the value is, t
An indicator of patterns #13 - #20 ("Double Tops" and "Double Bottoms", types Adam-Adam, Adam-Eva, Eva-Adam, Eva-Eva) from Encyclopedia of Chart Patterns by Thomas N. Bulkowski. Adam - sharp tops/bottoms, Eva - flat ones. Parameters: Alerts - show alert when an arrow appears Push - send a push notification when an arrow appears (requires configuration in the terminal) PeriodBars - indicator period K - an additional parameter that influences the accuracy of pattern shape recognition. The smalle

Implements an oscillator based on a simple comparison of the last two moving average values with improved functionality. As a result, the graph displays the delta of the two moving average values. In the case of a single value, the moving delta is calculated relative to the last two candles, which price of comparison will be specified in the Price parameter. The delta of two values is often used to determine the trend, depending on the length of the moving averages, it can be a longer or sh
An indicator of patterns #9 and #10 ("Cup with handle") from Encyclopedia of Chart Patterns by Thomas N. Bulkowski.
Parameters: Alerts - show alert when an arrow appears Push - send a push notification when an arrow appears (requires configuration in the terminal) PeriodBars - indicator period K1 - an additional parameter that influences the accuracy of recognition and pattern shape (the lower the value, the smoother the cup edge is) K2 - an additional parameter that influences the accuracy o

An indicator of patterns #24, #25, #26 and #27 ("Head and Shoulders", "Complex Head and Shoulders") from Encyclopedia of Chart Patterns by Thomas N. Bulkowski.
Parameters: Alerts - show alert when an arrow appears Push - send a push notification when an arrow appears (requires configuration in the terminal) PeriodBars - indicator period K - an additional parameter that influences the accuracy of pattern shape recognition. The smaller the value is, the smoother the row of peaks/valleys shoul
An indicator of pattern #54 ("Dead cat bounce") from Encyclopedia of Chart Patterns by Thomas N. Bulkowski.
Parameters: Alerts - show alert when an arrow appears Push - send a push notification when an arrow appears (requires configuration in the terminal) PeriodBars - indicator period ArrowType - a symbol from 1 to 17 ArrowVShift - vertical shift of arrows in pixels. Note. Arrows appear on a forming bar and do not disappear.
It cannot be guaranteed that the indicator recognizes the pat
An indicator of pattern #55 ("Dead cat bounce, inverted") from Encyclopedia of Chart Patterns by Thomas N. Bulkowski.
Parameters: Alerts - show alert when an arrow appears Push - send a push notification when an arrow appears (requires configuration in the terminal) PeriodBars - indicator period ArrowType - a symbol from 1 to 17 ArrowVShift - vertical shift of arrows in pixels. Note. Arrows appear on a forming bar and do not disappear. It cannot be guaranteed that the indicator recognize

The QRSI indicator is one of the most important and well-known indicators used by traders around the world. By its nature, the QRSI indicator is an oscillator, that is, it fluctuates in a certain zone, limited by the maximum (100) and minimum (0) values. Specifically, this indicator works according to an accelerated algorithm, but this is not its only difference. This indicator implements a more advanced calculation based on the Relative Strength Index algorithm. The peculiarity of the implemen
An indicator of patterns #50 and #51 ("Triple Bottoms", "Triple Tops") from Encyclopedia of Chart Patterns by Thomas N. Bulkowski.
Parameters: Alerts - show alert when an arrow appears Push - send a push notification when an arrow appears (requires configuration in the terminal) PeriodBars - indicator period K - an additional parameter that influences the accuracy of pattern shape recognition. The smaller the value is, the smoother the row of peaks/valleys should be, so fewer patterns will

An indicator of patterns #45 and #46 (Three Falling Peaks and Three Rising Valleys) from Encyclopedia of Chart Patterns by Thomas N. Bulkowski. Parameters: Alerts - show alert when an arrow appears Push - send a push notification when an arrow appears (requires configuration in the terminal) PeriodBars - indicator period K - an additional parameter that influences the accuracy of pattern shape recognition. The smaller the value is, the smoother the row of peaks/valleys should be, so fewer patt

This is the MetaTrader version of the very popular Squeeze Momentum indicator. It is based of of John Carter's TTM Squeeze volatility indicator, as discussed in his book Mastering the Trade. With this version you can enable notifications when a squeeze is released (push notification, email, or pop-up message). Strategie
Grey dots indicates a squeeze in the current timeframe. Blue dots indicates that the squeeze is released. Mr. Carter suggests waiting till the first blue dot after a grey dot a

RSI Scanner, Multiple Symbols and Timeframes, Graphical User Interface An indicator that scans multiple symbols added from the market watch and timeframes and displays result in a graphical panel. Features: Multi symbol Multi timeframe Alerts and Notifications Live Monitoring Sorting modes One click to change symbol and timeframe Inputs for RSI and scanner settings
FREE

Killer Market MT5 is an advisor with a system for "Resolving" a basket of unprofitable orders, a news filter, a filter for open positions on other trading instruments and the function of sending trading signals to your Telegram channel.
The Expert Advisor can be used to restore unprofitable positions on the account as a utility to bring trades to breakeven that you opened with your hands or other Expert Advisors.
Works inside a linear regression channel, input on several conditions. The s

Automatic fibonacci with alerts is an indicator that automatically plots a fibonacci retracement based on the number of bars you select on the BarsToScan setting in the indicator. The fibonacci is automatically updated in real time as new highest and lowest values appear amongst the selected bars. You can select which level values to be displayed in the indicator settings. You can also select the color of the levels thus enabling the trader to be able to attach the indicator several times with d

An anchored Vwap With Arrows is an indicator that includes a moving average weighted by volume that allows you to plot on a bottom or a top. Usually banks and institutions measure an average price, this average price is a price range where they agree to make a trade. Using the logic of anchored vwap with arrows it is possible to understand that if the price breaks the vwap it means that someone with enough buying and selling power has lost control. You can use vwap anchored with arrows in any ti

Horizontal volume bars, Cluster analysis, Volume profile Volume in Range gets information about the accumulated volume in a specified vertical range and period in bars. The received data is then plotted on the chart as rectangular boxes with the volume quantity inside. Usage:- The tool acts as a support resistance levels but most importantly it should be used to check in which direction the price breaks out of the significant levels formed by this indicator and then actions to be taken on correc

Market structures, Market balance, Range breakouts This tools helps to identify areas of market ranges, structures and plots colored boxes on breakout of those areas. User is given the option to receive alerts and notifications on the formation of the blocks. The tool has the ability to become an essential part of a technical trading system or even pure price action trading. Usage:- An essential tool for price action or technical traders. More information in the blog
This expert advisor trades using the famous super trend indicator: it is completely loyal to the original algorithm and implements many other useful features for the exigent trader, like customizable trading sessions, multi-timeframe filters and many others. [ Installation Guide | Update Guide | Troubleshooting | FAQ | All Products ] Easy to use and supervise Fully configurable indicator settings Customizable break-even, stop-loss, take-profit and trailing-stop settings Works for ECN/Non-ECN br
Trading Strategy The Leicester expert advisors uses three exponential moving averages to determine entry positions. Trend Line Slow Moving Average Fast Moving Average Crossovers between the fast moving average and the slow moving average will create sell signals. If prices are below the trend line then only sell positions will be opened. Vice versa for when prices are above the trend line, only buy positions will be opened. Inputs/Features
Candles after cross - Number of candles to wait before

This indicator is an oscillators that shows the real strength of 8 main currencies in the Forex market. It recreates a basket of the main currencies and applied a True Strength Indicator on each of them. The calculated real currencies are: EUR - USD - GBP - CHF - JPY - AUD - CAD - NZD. It clearly identifies overbought and oversold ares. From reading the oscillator you can choose the right Forex symbol to trade.
Future versions: I am working on adding alarm and a real buy sell signal, choos
Dark Gold is a fully automatic Expert Advisor for Scalping Trading on Gold , Bitcoin , Eurusd and Gbpusd. This Expert Advisor needs attention, in fact presents highly customizable. Dark Gold is based on Dark Support Resistance mt5 indicator (owning it is not necessary) , these Trades can be manage with some strategies. If you Buy this Expert Advisor you can write a feedback at market and get Dark Support Resistance indicator for Free , for More info contact me The basic strate

O Expert Advisor Risk Manager para MT5 é um programa muito importante e, na minha opinião, necessário para todos os traders.
Com este Expert Advisor você poderá controlar o risco em sua conta de negociação. O controle de risco e lucro pode ser realizado tanto em termos monetários quanto em termos percentuais.
Para que o Expert Advisor funcione, basta anexá-lo ao gráfico de pares de moedas e definir os valores de risco aceitáveis na moeda de depósito ou em % do saldo atual. PROMO BUY 1 GET

Sistema SemiAuto Martin
introduzir
Esta ferramenta é usada para negociação Martin semiautomática, clique no painel para colocar um pedido e o EA gerenciará a posição Basta decidir a direção da transação e deixar o resto para a gestão da EA Martin automático, adicionar armazém de acordo com a grade definida, você também pode desativar esta função Liquidação com um clique Uma função de bloqueio de tecla controle do tempo Aviso sonoro de alerta
característica
Gráfico de negociação: qualque
Este rastreador permite que você identifique ativos que estão mais do que normalmente sobrecomprados (% de crescimento) ou sobrevendidos (% de queda) dentro de um período de tempo selecionado (período de tempo). O mercado é regido por lei, compre mais barato, venda mais caro, mas sem um scanner automático será muito difícil para você identificar moedas / ações que estão sobrecompradas ou sobrevendidas mais do que o normal, digamos, na semana atual, ou o hora atual ou mês. Pode haver dezenas ou
Lógica da estratégia Pump and Dump for MT5 Expert Advisor é um consultor de negociação totalmente automatizado criado por um trader para traders. A estratégia é “comprar mais barato, vender mais caro”. Os pedidos são abertos após um aumento / queda significativa no preço. O significado básico da estratégia Pump and Dump é comprar um ativo mais barato quando o preço cai e vendê-lo mais caro quando o preço sobe. Você provavelmente notou que após movimentos bruscos de preços no mercado, uma revers

Lógica de trabalho A importância deste indicador reside no fato de que ele permite que você entenda quanto “ainda resta combustível no instrumento”. Imagine a situação, você saiu de um carro com a bateria meio descarregada, em média, essa quantidade de energia costuma ser suficiente para um carro por 250 km, então se você quiser não pode ultrapassar uma distância de 700 km. Assim, para cada instrumento, existe um certo movimento diário de preço e, como resultado de observações estatísticas, foi

EasyTradePad é um painel de negociação para negociação manual / semiautomática. Trabalhando com posições e pedidos, calculando a gestão de dinheiro em um clique!
O painel definitivamente irá ajudá-lo: abra uma negociação com o risco exato que você especifica em% ou na moeda do depósito economize o lucro movendo o stop loss para nenhuma perda faça a média do comércio suavizando a volatilidade do mercado adicione uma posição ao longo da tendência se a negociação for em sua direção espremer o lu
Requirements Hedging account!
EA work with any brokerage conditions
EA should run on a VPS continuously
Information
Working symbol EUR, USD, GBP, GOLD, STEP INDEX, V10 (1s) any pair
STANDARD ACCOUNT
Working Timeframe: H1
Min deposit: $500 (1 Pair)
Min leverage 1:500 CENT ACCOUNT
Working Timeframe: M15/M30
Min deposit: $500 CENT (4 Pair)
Min leverage 1:500 Setfile for currency Here
Setting for DARK MAGIC MT5
MM = TRUE (Automatic lot calculation according to your risk

Lógica de trabalho
O Dow Strategy Expert Advisor é um Expert Advisor baseado na teoria Chalse Dow de “retenção de tendência”.
O Expert Advisor usa o TF selecionado, se a barra anterior estava alta, isso significa que ele abrirá uma compra e colocará um stop atrás da Baixa da vela anterior (é possível definir um filtro para um deslocamento da vela anterior), então, após o fechamento da vela atual, o stop loss será movido novamente além da mínima e, assim, a negociação será mantida no mercado

O indicador iPump é um indicador versátil que combina as vantagens de três categorias de indicadores.
detecção de tendência simultânea em vários TFs definindo zonas de resistência e suporte determinação de zonas de sobrecompra e sobrevenda Funções do indicador: Definindo uma tendência Esta função será necessária para todos os traders que desejam avaliar objetivamente a direção atual do mercado e evitar a subjetividade. Em uma fração de segundo, você será capaz de comparar a direção da tendê
Um consultor de grade com um sistema para "Resolver" uma cesta de ordens não lucrativas, um filtro de notícias, um filtro para posições abertas em outros instrumentos de negociação e a função de enviar sinais de negociação para o seu canal do Telegram.
O Expert Advisor pode ser usado para restaurar posições não lucrativas na conta como um utilitário para trazer as negociações ao ponto de equilíbrio que você abriu com suas mãos ou outros Expert Advisors.
Funciona dentro de um canal de regres

Queres um EA com um pequeno stoploss? Queres um EA que entra e sai do mercado?
Esta EA está atuando em breakout para DAX (índice da Alemanha), ou Dow Jones. Só compra quando o mercado abre e com uma janela de 10 minutos ou menos.
Estas estratégias (Sim, são 2 estratégias diferentes que podem ser usadas com 3 gráficos diferentes) têm perdas de parada apertada e um takeprofit que muitas vezes será alcançado dentro de segundos!
As estratégias estão bem provadas. Há anos que os Uso manualmente
O Mercado MetaTrader contém robôs de negociação e indicadores técnicos para traders, disponíveis diretamente no terminal.
O sistema de pagamento MQL5.community está disponível para todos os usuários registrados do site do MQL5.com para transações em todos os Serviços MetaTrader. Você pode depositar e sacar dinheiro usando WebMoney, PayPal ou um cartão de banco.
Você está perdendo oportunidades de negociação:
- Aplicativos de negociação gratuitos
- 8 000+ sinais para cópia
- Notícias econômicas para análise dos mercados financeiros
Registro
Login
Se você não tem uma conta, por favor registre-se
Para login e uso do site MQL5.com, você deve ativar o uso de cookies.
Ative esta opção no seu navegador, caso contrário você não poderá fazer login.