Conheça o Mercado MQL5 no YouTube, assista aos vídeos tutoriais
Como comprar um robô de negociação ou indicador?
Execute seu EA na
hospedagem virtual
hospedagem virtual
Teste indicadores/robôs de negociação antes de comprá-los
Quer ganhar dinheiro no Mercado?
Como apresentar um produto para o consumidor final?
Expert Advisors Grátis e Indicadores para MetaTrader 4 - 11

The indicator High Trend Lite monitors 5 symbols in up to 3 timeframes simultaneously and calculates the strength of their signals. The indicator notifies you when a signal is the same in different timeframes. The indicator can do this from just one chart. Therefore, High Trend Lite is a multicurrency and multitimeframe indicator. With the High Trend Pro , available at this link , you will have an unlimited number of symbols, 4 timeframes, a colourful chart of the primary MACD indicator, several
FREE

Dear Friends .. As I promised you , this is a demo version of my Expert Advisor that works only on Daw Jones (US30)
It works on simple strategy , Scalper and trend EA . It use the manual lot size that you put in parameters and use the trailing stop to minimize the lost value as much as it dose ,, So u need to put the lot size ( usually it 0.1 minimum in most companies ) and put your Trailing stop value (if you want to cancel the trailing just put 0 in the parameter ) (for DJ try to multiply
FREE

This is the free version of "SAR Trading Station"(auto trading GBPUSD only), the full version link is here https://www.mql5.com/en/market/product/4690 SAR Trading Station is a semi-auto trading system based on Parabolic SAR and Stochastic etc, and trend driven swing trading strategy. This is an agile platform allowing you to setup various parameters to optimize the specific symbol pair trading strategy for yourself! Risk(Max Loss$): Default is 50, Max loss Per order(Position size is calculated b
FREE

Based on technical analysis and the logic of upward (bullish) and downward (bearish) trends, the bot eliminates speculative cases in the market. High-precision bots surpass humans in all aspects: they replace a workforce and have no limitations on working hours. Unlike humans, they are not subject to fatigue, illnesses, emotions, etc. The bot is limited from the risks of losing the entire capital as it incorporates STOP Loss and Take Profit features. These features help manage potential losses
FREE

Indicator support for only: Entry Point to Trend Pro Link indicator support : https://www.mql5.com/en/market/product/70867
Supports all currency pairs declared in the definition. Help investors do not need to open many charts. Notice the DEAL: multiple time frames confluence M15, H1, H4.
Entry Point to Trend Pro The indicator helps investors to identify the earliest and perfect reversal point. Easy to make decision to trade with the trend Price action trading. support resistance
FREE

MACD Dashboard Panel This indicator helps you to scan symbols which are in the Market Watch window and filter out a trend according to MACD.
Moving Average Convergence Divergence (MACD) is a trend-following momentum indicator that shows the relationship between two moving averages of a security’s price. The MACD is calculated by subtracting the 26-period Exponential Moving Average (EMA) from the 12-period EMA.
The result of that calculation is the MACD line. A nine-day EMA of the MACD call
FREE

FREE UNTIL FEBRUARY 14, 2023
SPEND MORE TIME WITH YOUR FAMILY. ENJOY LIFE… DO NOTHING. This version is only auto set of Takeprofit and StopLoss
Main Version of TropangFX: MT4 Version | MT5 Version Recommended timeframe: H1 Supported currency pairs: GBPUSD, EURUSD, EURCHF , USDCAD, USDCHF , AUDCAD, EURCAD, EURAUD and many more...
Requirements
The EA requires good brokerage conditions: low spread and slippage during the rollover time. I advise using a really good ECN
FREE
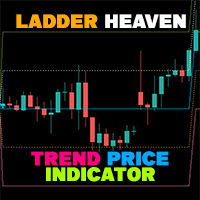
If you have difficulty determining the trend as well as entry points, stop loss points, and take profit points, "Ladder Heaven" will help you with that. The "Ladder Heaven" algorithm is operated on price depending on the parameters you input and will provide you with signals, trends, entry points, stop loss points, take profit points, support and resistance in the trend That direction.
Helps you easily identify trends, stop losses and take profits in your strategy!
MT5 Version: Click he
FREE

This oscillator has become one of the main tools of most professional traders. The indicator includes a classical MACD ( Moving Average Convergence/Divergence ) line, a signal line, as well as a MACD histogram. Exponential moving averages are used in the calculation. The indicator also provides the ability to enable signals on identification of divergences between the price graph and the indicator. Divergences are identified using three patterns: classic, hidden and extended divergences.
Indic
FREE

Gladius EA Standard is a trading robot specifically designed for the forex market. It uses both technical and standard indicators to identify the best trading opportunities and maximize the potential of every trade. It is best suited for trading the GBPUSD pair and offers the flexibility to set up single, double or triple entries based on your needs. Gladius EA Standard also features a news filter and mathematical predictions to analyze the market, as well as a Super Trend period to track market
FREE

Support/Resistance Percent Rank
SR Percent Rank helps to see how many times the current close price has been in the past price range. SR Percent makes a loop over x bars into the past and calculates the percentage of times the current closing price has been between the high and the low price in the x bars before that. So we can determine if the current price is moving at supports or resistance that was formed in the past. I use the indicator when creating strategies with the StrategyQuant X p
FREE

BOROT Assistant : Trading Assistant for Manual Traders
Description:
The Trading Assistant is a user-friendly tool designed for manual traders to improve their trading performance and enhance their decision-making process. It offers a comprehensive range of features that help traders effectively manage risk and reward, execute orders, and identify potential trading opportunities. The Assistant's key features include:
Risk and Reward Box : Clients can easily draw a risk and reward box on the
FREE

MULTI TRADER TOOL - SUPPORT / RESISTANCE, ONE CLICK CLOSE / OPEN, AUTO CLOSE, GRID ORDERS, ALERTS.
You should use this Panel on FULL SCREEN MODE (F11).
HotKeys: B - Open Market Buy Order with OneClickOpen Settings. S - Open Market Sell Order with OneClickOpen Settings. G - Open Grid Orders with Grid Panel Settings. R - Add Support/Resistance Settings to selected trend and horizontal lines. If you have any questions, ask in a private message or in the comments section.
FREE

"Drivers Road Bands" indicator that is designed to be used in the 1H, 4H and 1D timeframes in the most ideal way. If we compare timeframes to roads and streets; main streets and highways with high traffic volume are similar to high-time timeframes in technical analysis. If you can interpret the curvilinear and linear lines drawn by this indicator on the graphic screen with your geometric perspective and develop your own buy and sell strategies; you may have the key to being a successful trader.
FREE

Maltese cross GBP Универсальный инструмент для определения трендов, флетов и торговли по графическим паттернам. Объединяет техники Гана, Эллиота, Мюррея.
Просто разместите его на графике и он покажет направление и скорость движения цены, выделит разворотные моменты. Maltese cross поможет точно определять узловые моменты в истории, планировать торговые действия и сопровождать открытые сделки. Эта бесплатная демонстрационная версия MalteseCross ограничена GBPUSD и кроссами GBP. Никаких прочих
FREE

AUTO3M Lite MT4 is a fully automatic Expert Advisor for Trend, Hedging Strategy Trade With Bollinger Bands And Stochastic Oscillator Bollinger Bands Are Used Mainly To Follow Trends. Stochastic Main Line And Signal Line Use For Open Pending Order Buy Or Sell The advisor Auto3M Lite MT4 can work on a VPS. Pro version MT4
Pro version MT5
Feature No martingale Hard stop loss and take profit for each position Trailing stop Delete pending order automatic by interval time Use buy stop and sell st
FREE
Torne-se um trader forex de 5 estrelas constantemente lucrativo!
Oferecemos alguns indicadores para ajudá-lo a entender e analisar o mercado! Com nossas estratégias, você melhorará seu sistema de negociação e se tornará um especialista...
Temos indicadores para direção de tendência, direção de mercado e outros.. para vários prazos e abrange todos os principais ou seus símbolos de negociação favoritos! Alguns deles oferecem parâmetros de cálculo personalizáveis... ou recursos de gráfico!
V
FREE

InpRSIshort =13; // RSI short InpRSIPeriod =34; // RSI long PeriodRs =0; //Price 0C 4HL/2 5HLC/3 mafast =13;//mafast maslow =65;//MAslow
Double line RSI sub graph index. The parameters are adjustable. The RSI lines with two different cycles can be used to observe the trend strength effectively. Meanwhile, a short period cross long period color column image is displayed below. When the cycle (Jin Cha) is on the short cycle, the color of the column map changes from the light green to th
FREE

Hello all. This indicator helps you to open a trade, when break out occurred, also you can add to your position and ride it if trend continued. I use it on 1-5 min chart, as you can use short stop loss. Also profit target should be small as well. It is better to enter few small position, so you can book some profit early and ride the rest for bigger gains. Look at the past to have a plan. Enjoy.
FREE
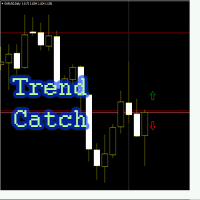
Советник "Trend_Catch" входит в рынок по средним скользящим и фракталам. Средние скользящие определяют направление тренда, фрактал - момент входа входа в рынок. В советнике прописан безубыток, трейлинг стоп, мантингейл по желанию Пользователя
Настройки советника: Close_by_Reverse_MA_Signal = false; закрыть ордер на покупку, если быстрая МА находится выше медленной, закрыть ордер на продажу, если быстрая МА находится ниже медленной, если параметр Invert_sig включен (инвертирован сигнал), сигнал
FREE

This Indicator is based on Mr. Dan Valcu ideas.
Bodies of candles(open-close) are the main component used to indicate and assess trend direction, strength, and reversals.
The indicator measures difference between Heikin Ashi close and open.
Measuring the height of candle bodies leads to extreme values that point to trend slowdowns. Thus quantifies Heikin Ashi to get earlier signals.
I used this indicator on Heiken Ashi charts but, it's possible to choose to calculate Body size based on
FREE

WONNFX create arrow tester. Сonstructor/Tester. Tester for buffer indicators. Converting a buffer indicator into an arrow signal on the chart. Combining two buffer indicators into one arrow signal. Filter by candle color. You can move the arrow signal several bars forward (useful in cases where the indicator gives signals 2-3 bars late
"WONNFX create arrow tester" is a tool designed specifically for traders who use buffer indicators in their trading strategies. This tester converts the buffer
FREE

Tool converted from tradingview. A simple indicator that plots difference between 2 moving averages and depicts convergance/divergance in color coded format.
Anything <= 0 is red and shows a bearish trend whereas > 0 is green and shows bullish trend.
Adjust the input parameters as following for your preferred time frame :
4-Hr: Exponential, 15, 30
Daily: Exponential, 10, 20
Weekly: Exponential, 5, 10
FREE

The ADX Trader is a project for you, it has great potential. Ill upload the source file of this EA on my blog, so keep a look out for it. You may tweak it to your satisfaction. It comes with risk management, and built in Algo. You'll notice when you click on View" inside mt4, top left corner, you'll have an option "strategy tester". Click on it, run it in the strategy tester by selecting "Forex mastery ADX trader". If you have the source code (from my blog), then you have the ability to change h
FREE

Idea Pro Trend This EA is a Semi-auto Trading Panel with a variety of strategic settings, such as those listed below. It is excellent for scalping or long-term trading by traders. This EA is simple and convenient to trade and attach to the chart with the default settings on "AUDUSD", EURUSD, GBPUSD and NZDUSD.
How to use You can trade based on the trend that is displayed on the left-hand side of Info Panel. If the trend are" 2 Up Trend" and "2 Down Trend", please do not trade. Simply proceed
FREE

The GTAS BSI is an indicator designed to provide the trend direction and buy/sell signals, using combination of momentum indicators. This indicator was created by Bernard Prats Desclaux, proprietary trader and ex-hedge fund manager, founder of E-Winvest.
Description The BSI indicator is represented as a histogram under the price chart. +100 (green) value indicates a bullish trend. -100 (red) value indicates a bearish trend. When the BSI turns to +100 (green), it gives a potential buy signal. W
FREE

YOU CAN NOW DOWNLOAD FREE VERSIONS OF OUR PAID INDICATORS . IT'S OUR WAY OF GIVING BACK TO THE COMMUNITY ! >>> GO HERE TO DOWNLOAD
Momentum channel is a simple momentum based system yet with a great degree of accuracy in detecting turning points. The market momentum are defined by Average True Range Channels . When price breaks these channels most times , it is an indication of a shift in market momentum and thus a possible new trend formation. The system can be traded on any time frame an
FREE

1. Make sure you trade only with GBP/USD on an 1h chart as this model is built specifically for the hourly Cable trading. 2. If you are backtesting the EA during weekends, make sure to specify a reasonable spread (such as 30 or 50) instead of using current spread because the market is not trading and the current spread may be some awkward number. During weekdays, feel free to use current spread as it is the correct current spread value. 3. If you want to have an even more stable-performing EA,
FREE

A simple script that can delete all the drawing objects on a chart, or just the objects of a specific type.
Settings:
DeleteObjectsOfType By default the value will be blank which means ALL drawing objects on the chart will be deleted. If you only wish to delete specific types of drawing object, change this setting to the type of object to delete. For example, Fibonacci Retracement, Text, Label or Trend Line.
Please see the demonstration video for more information.
FREE

Have you ever wondered which currency is the strongest at any particular time? Or which currency pair is trending the most. Well, the currency strength meter helps with just that. It compares USD , EUR , AUD , CHF , GBP , CAD and NZD depending on the timeline you have chosen in settings, and ranks them on the number of pips each has moved compared to the rest. N/B: All currency charts of the above pairs must have loaded. You can do this by highlighting all major and minor currencies
FREE

Cross Trend Lines indicator trend indicator of find. This indicator, an array of works by using a series of indicator and algorithm. Uses two lines to find trends. The intersection of this line means that the start of the trend. These lines are green, tend to rise. Red lines indicate the downward trend. Use of this indicator is easy to understand. This indicator on its own or you can use other indicators that are appropriate for the strategy.
Suggestions and Features Starts a new trend at th
FREE

This indicator provides common shapes as drawing object options. The shapes are rotatable, resizable, draggable, and will keep their proportions (according to their handle trendline) across different chart scales. Multiple drawings are supported.
Shapes: Square Rhombus
Triangle (quadrilateral & isosceles) Circle (grid, overlapped grid, flexi grid, rotatable grid, concentric circles) Features: rays (all object edges will be rays) show/hide each individual drawing type, or all delete last drawn
FREE

By default Metatrader will show any newly created chart object on all timeframes.
This handy utility will set the visibility of any new chart object drawn to be that of the current chart only.
e.g. If the chart timeframe is H4 then a new object will only be visible on the H4 timeframe.
Each object type can be included or excluded as required and, of course you can change the timeframes setting afterwards as this only operates at the point the chart object is created.
Add to your chart a
FREE
This EA takes advantage of Momentum in the Major Currencies . If a certain currency has enough momentum, the EA makes trades on the related pairs. The User Inputs of the EA are so straight-forward, they are in form of questions and suggestions. For example, you will see such questions or statements in the input panel: "Should we trade maximum once per day per pair?" "Close order if Break Even not activated after these seconds:" You will specify the required percentage difference between a Bullis
FREE

TrendFinder VolumeI are Colored candlesticks showing the trend based on Volume and Slope of Trend
This indicator will give you the color change on the next bar on the confirmation candle and will never repaint Lime Green = Possible Buy (Volume up), Teal Green = Bullish Weak (Volume Decreasing), Red = Possible Sell (Volume up) , Orange = Bearish Weak (Volume Decreasing)
TrendFinder Volume is optimize to trade on any market and to be used trending and None trending markets. For best results us
FREE

The indicator detects price channels, reversal points and trend direction. All timeframes. No repainting. Channel borders are formed by support/resistance levels. Calculation is done on an active candle. If the red line is above the green one, a trend is bullish. If the red line is below the green one, a trend is bearish. After the price breaks through the green line, the indicator starts building a new channel. The indicator works well with the Forex_Fraus_M15.tpl template https://www.mql5.com/
FREE

Volume Cross Over is an indicator that measure positive and negative volume flow in a financial instrument, such as a stock, commodity, or index. It is base on the idea of On-Balance Volume developed by Joseph Granville. However instead of trending lines, this indicator shows volume cross over. When the closing price of an asset is higher than the previous closing price, then the Bull volume is greater than zero and Bear volume is negative. It suggests that buying volume is dominating, a
FREE

Combined indicators, based on moving averages and price momentum, help you to know when to break out your profit timely. It lets you to ride on major trend as long as possible but knowing when to break out smart and timely. The indicator displays major trend, volatile, reversal signals and last lowest and highest price. It's status updated on top right of your chart keeps you informed about pip-changes involved.
Parameters: FAST Period
Period of the fast moving average
SLOW Period
Period
FREE
Painel de Controle UR
O UR Control Panel é uma ferramenta que quero compartilhar com você GRATUITAMENTE. É um painel interativo que me ajudou em minhas negociações e impulsionou minha análise de mercado a cada dia. Espero que atenda às suas necessidades também!
Como usar o Painel de Controle UR?
É um painel duplo móvel e redimensionável do qual: - Um deles mostra a força da moeda no período de tempo determinado - O outro permite que as opções se movam entre símbolos e prazos muito mais
FREE

Introductory Pricing for one month
Brute force trader is specially designed to find the best entry point and exit point with the regular tested and proven indicators. The EA will automatically analyse the market and will follow trends with the right entry exit points. Since the timeframe it is using is 30 minutes, the chances that you are stuck into a long trade is very low. Thought it does not use stoploss but it has t
FREE

iCC in iMA is indicator to change color in iMA if iCCI crosses level up (up trend) or crosses level down (down trend). It is a useful tool to track when the upside and the downside iCCI on iMA.
You can to get source code from here .
Parameters MA_Periods —Period for iMA. MA_Method — Method for iMA. CCI_Periods —Period for iCCI. CCI_ApliedPrice — Price used for iCCI. CCI_LevelsUp — Level iCCI for up trend. CCI_LevelsDN — Level iCCI for down trend. BarsCount — How many bars will show the line.
FREE

HighLow level Indicators Welcome to our page. here we are introduced here HighLow Level indicator which is the most profitable indicators in our trading life. Recommended Time Frame: M1/M5/H1 Suitable for all currency's This indicator is used to identify the lowest low and highest high level in all currency's to know the trading trends. Trade in the same trend to get the most profit
Happy Trading
FREE
06/30/23 v1.1 New features.
Read before operate. Remarkable configurations: 1) "No close order", "Auto-Hedging" FALSE, "Close all" FALSE : You can transform this EA in a assistant that simply open orders. After you will be the mind of the operativity. Warning : find a good setting of "Pause in minute" and "Max alert" to delay the operativity and filter the wrong signals. These last parameters can change by market condition and asset.
2) "Breakeven and WPR inversion", "Auto-Hedging" FALSE, "C
FREE

Introducing MACD Jurik—an advanced indicator designed to enhance your forex trading strategy by integrating custom moving averages based on the Moving Average Convergence Divergence (MACD) with the MetaTrader 4 indicator, MACD.
Jurik moving averages are renowned for their accuracy and reliability in analyzing price movements in the forex market. They offer traders smoother representations of price action, reducing noise and providing clearer signals for identifying trends and potential revers
FREE

This indicator helps you to scan all symbols which are in the Market Watch window and filter out a trend with alerts. It works on five most effective indicators which are used by most of traders for trading: Moving Average Average Directional Moment (ADX) Relative Strength Index (RSI) Parabolic SAR MACD It calculates two bars for scanning. When box colour changes to coral or royal blue colour, it indicates you for trend change for long and short entry. And also you will get alert on screen. When
FREE
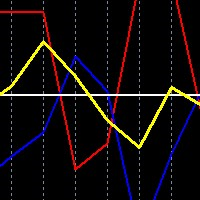
This is a simple free tool for simulating trades when trading both AUDUSD and NZDUSD in a hedge strategy, you can drop the indicator on either market chart. It is essential because you cannot tell at a glance, what a combined trade would be like, just by looking at the two individual charts separately.
New premium low cost indicator
How to use: Drop the indicator on either AUDUSD or NZDUSD chart, or any other chart, it will work.
You choose ploting period, to the number of days/weeks
FREE

Engulfing candlestick patterns are comprised of two bars on a price chart. They are used to indicate a market reversal. The second candlestick will be much larger than the first, so that it completely covers or 'engulfs' the length of the previous bar.
By combining this with the ability to look at trend direction this indicator eliminates a lot of false signals that are normally generated if no overall trend is taken into consideration
FREE

a novel indicator by the maker of velvet.
FREE
DStochastic is an improved version of the classic Stochastic oscillator with an added moving average. The indicator dampens the market noise, determines the direction of the market and reduces the number of false signals. We have also added a function of multicolor signal line display of increase and decrease by means of dots. The blue dots indicate the development of an ascending trend, the red dots - descending. Similar to all standard oscillators, DStochastic can be combined with all trend in
FREE

Simple indicator that shows external ( outside ) bars. In certain cases, external bars can be seen as strong trend bars instead of range bars. This can be observed when a with-trend external bar occurs at a reversal from a strong trend. It will help you notice more easily different patterns like - Inside-outside-inside, Inside- Inside -inside, outside - Inside -outside, etc. Works perfectly with my other free indicators Internal bar and Shadows
Inputs: How many history bars to calculate on l
FREE

I present you the Abella Expert Advisor. The "London breakout" occurs in the European session. During this time, Abella follows the market and enters in one of the direction according to the identified Price Action patterns. The EA works both during a flat and trend. This EA has been created for multicurrency trading. Do not Abella on one pair. For optimal performance, use 4 pairs: AUDUSD, USDJPY, EURJPY, GBPUSD (the H1 timeframe) and create a portfolio.
Parameters Lot - fixed lot; Risk - dyna
FREE

'Circle Rising Point' is an indicator based on the cycle theory. No matter whether your trading cycle is short or long, you can use this indicator to find the rise and fall points of different cycles and different bands. Therefore, the signals displayed to you on charts of different cycles are different, and applicable to left side transactions. This indicator is recommended to be used together with the multi cycle window for analysis. Indicator introduction Applicable products This indicato
FREE
Trendfinder MA Pro are based on Colored candlesticks showing the trend based on two Moving Averages as Signal and two Moving Averages as a Buy and Sell Zone, the slope of the slow Signal moving average and ATR and Volume increasing. This indicator will give you the color change on the next bar on the confirmation candle and will provide alert on Buy and sell signal, when it enters the buy and sell zone and when the market test the buy or sell zones as support or resistance and will never repain
FREE

The Bolliger Bands On-Off let you control the indicator using the keyboard or a button . You can choose if you want the indicator always shown or always hided while switching among different time frames or financial instruments . ---> This indicator is part of Combo Indicator OnOff
The Bollinger Bands identify the degree of real-time volatility for a financial instruments . A lower amplitude corresponds to a low volatility, conversely a greater bandwidth corresponds to high volatility. N
FREE

A classic indicator with advanced features for more accurate display of the market situation. All settings of all moving averages are available, such as the moving average type and the priced used in its calculation. It is also possible to change the appearance of the indicator - line or histogram. Additional parameters provide the ability of fine tuning.
Distinctive features Does not redraw. Additional parameters for fine tuning. Displayed as a line or as a histogram. Works on all timeframes
FREE

Simply Parabolic SAR EA is an expert advisor that places orders in favor of the trend changes of the "Parabolic Stop And Reverse" indicator, placing its take profit, stop loss and trailing stop. You can see more of my products here: https://www.mql5.com/en/users/joaquinmetayer/seller
Inputs: Lots TakeProfit in points StopLoss in points TrailingStop distance in points Step PSAR Max PSAR
FREE

Dear Friends,
"All The best" is a simple trend based EA. As of now work well only in GBPUSD Pair with one minute, In future All major pairs support will given. The Default lot size is 0.01 and SL &TP set as 0. You can change this setting. My prefered SL is 100 points. 100 points=10 Pips(pls set by points). I will not set TP for better profit.
Note: This EA work only when you using Zero spread or Raw spread account type.
Regards, Sankar Ganesh G
FREE

The indicator draws lines the the price highs and lows. Break through the high or low usually indicates trend change (or continuation). Once the price moves through a line, and the candlestick closes, the indicator draws an appropriate arrow (also, you can enable alerts). A deal should be conducted in the breakthrough direction immediately or after a slight rollback. It is best to trade following the trend on a larger timeframe. This indicator is easy to use, but nevertheless, there are many tra
FREE

Free Scalping is a comprehensive manual system developed for the most efficient trading at any market conditions and time scale.
The system is based on two main blocks:
1. The block of trend determination that calculates dynamic support and resistance. The function of auto-optimization is available for this block.
2. The block of price deviation from its median based on the big set of regressions to get the statistically-valid result. Entry rules For buys:
1. The trend goes up
2. The pr
FREE
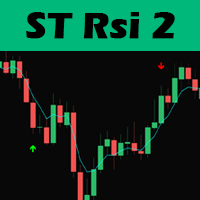
Hello traders, this trading strategy is based on the the Larry Connors RSI-2 strategy, We begin with a 200 periods EMA to find the direction of the market. This is important because we only trade in the main trend direction.
We then look for pull backs using the RSI with a period of 2 to get entry signals. Trades are then exited using the 5 EMA.
Lot size should be calculated using 1% of 1 the ATR value and positions can be added as long as the entry criterion is met.
TRADING IS RISKY AND
FREE

CandleCrusherX Scalping EA analyses the market situation on volume and strong price movement within internal Timeframe. It works on all major forex pairs and Timeframes (M5 or M15 recommend). The EA has integrated dynamic Take Profit, this means, if you reach your defined TP it gives you the chance to follow on the Trend by dynamic TP & SL and extend your profits. Also a News Filter function is integrated, to prevent miss trades on News events. Dynamic Lot calculation integrated On Request we a
FREE

Implied Trader is a fully automatic, professional trading robot designed specifically for the foreign exchange market AUDCAD M30 timeframe. Parameter configuration is not necessary for EA. Only the size of the lot you intend to use needs to be chosen. 0.1 is the suggested lot size for a $2000 account. You can raise the lot size correspondingly if your account has more money. It has an intelligent algorithm that recognizes the trend. On the basis of the trend direction, the expert places orde
FREE

The MACD_stopper_x2 indicator shows where the trend has a tendency to stop or reverse. It uses the standard MACD indicator and a proprietary formula for processing data obtained from MACD. There are 2 types of stop/reversal signals: Small cross - probability of a trend stop/reversal is 70-80%; Large cross - probability of a trend stop/reversal is 80-80%; If there are open trades (for example, BUY) on the symbol the indicator is attached to, and the BUY trend ends, the indicator sends push notifi
FREE

This indicator is designed to detect the best of all candlestick reversal patterns: Three Line Strike . According to the bestselling author and candlestick guru Thomas Bullkowski, this pattern has a winning percentage between 65% and 84% . This FREE Version of the Scanner scans only EURUSD and GBPUSD. The full version of the scanner can be found here: Three Line Strike Scanner 30 Instruments This indicator scans for you up to 30 instruments (forex, indices or commodities) on up to 8 timeframes.
FREE

CCI Trend Finder indicator with different colors at levels 0, 100 and -100. The cross is a signal for "123 Exit" as presented by MPlay and used in Woodies CCI system. This exit signal is effective especially in short-term breakout trades, because it prevents early exiting at small corrections. This indicator is great for having it as an extra tool for your analysis.
FREE

The indicator is based on the concept of price channels, which are formed by plotting the highest high and lowest low prices over a specified period of time. The Donchian Channel Indicator consists of three lines: an upper channel line, a lower channel line, and a middle channel line. The upper channel line represents the highest high over a specified period, while the lower channel line represents the lowest low. The middle channel line is the average of the two and can be used as a reference f
FREE

The " Comfort Zone Signal " indicator identifies a daily zone that, when broken, has a high probability of the market continuing the established trend .
Upon signal, the indicator calculates stop loss and take profit, which can be set by you.
You can also set the trend. If the price is above the MA, it looks only for long positions, if below, it looks only for short positions.
You can choose to ignore the moving average and display all signals.
Additionally, you have the risk percentage d
FREE
The Complex Chaos EA is an automated system that uses a pair of exponential moving averages to detect the market direction and opens trades on candle open. If the market moves against a trade it will at a set distance open another trade in the same direction to move the take profit of the group of open positions closer to the current price and make the group of trades winners overall once the price reverses. If a change in direction is detected then all trades are closed and it starts trading in
FREE

Risklimiter
Limit your risk with this dynamic stop loss indicator. It will show you exactly where to place your initial stop & subsequent stops as the price goes in your favour. Works on any time frame as well as any symbol. It is not restricted in any way nor does it need optimisation. Simply drag and drop on to a chart for it to display a stop loss. You may find at times, it shows a stop on the other side of your trade, this will change as soon as price closes above/below it.
DOES NOT RE
FREE

Ichimoku Cloud at a Glance (ICG) is an utility shows price vs cloud information for each timeframe at once. It works with any timeframe. Drop it to any chart and you will see where the price is currently at relative to the each timeframe' cloud range. You can switch the timeframe in the middle of the operation as well. There is a box and a letter under each timeframe caption. Box color - Blue : Price is above both Senkouspan A and B.(Above the cloud) - Yellow : Price is at between Senkousp
FREE
O Mercado MetaTrader oferece um local conveniente e seguro para comprar aplicativos para a plataforma MetaTrader. Faça download de versões de demonstração gratuitas de Expert Advisors e indicadores a partir do seu terminal para testes no Testador de Estratégia.
Teste os aplicativos em diferentes modos para monitoramento do desempenho e assim fazer um pagamento para o produto que você deseja, usando o sistema de pagamento MQL5.community.
Você está perdendo oportunidades de negociação:
- Aplicativos de negociação gratuitos
- 8 000+ sinais para cópia
- Notícias econômicas para análise dos mercados financeiros
Registro
Login
Se você não tem uma conta, por favor registre-se
Para login e uso do site MQL5.com, você deve ativar o uso de cookies.
Ative esta opção no seu navegador, caso contrário você não poderá fazer login.