Convert Indiactor to Multi Time Frame and True Non Repaint (no flat "step" like lines)

MQL4 Indicadores

Trabalho concluído

Tempo de execução 5 dias
Comentário do cliente
Ilya is a real pleasure to deal with. I tried at least 3 coders – each told me it was impossible - even when I explained exactly how to calculate things. Ilya did the job quickly & perfectly. Thanks!
Comentário do desenvolvedor
Fast checking and payment. Thank you for interesting and challenging project.

Termos de Referência

I would like the attached TradersDynamicIndex-JR indicator converted to MTF and the "steps" removed ie. so that it is Non Repaint and displays the value of the higher timeframe past and present as it was at the end of the lower timeframe bar at the time.

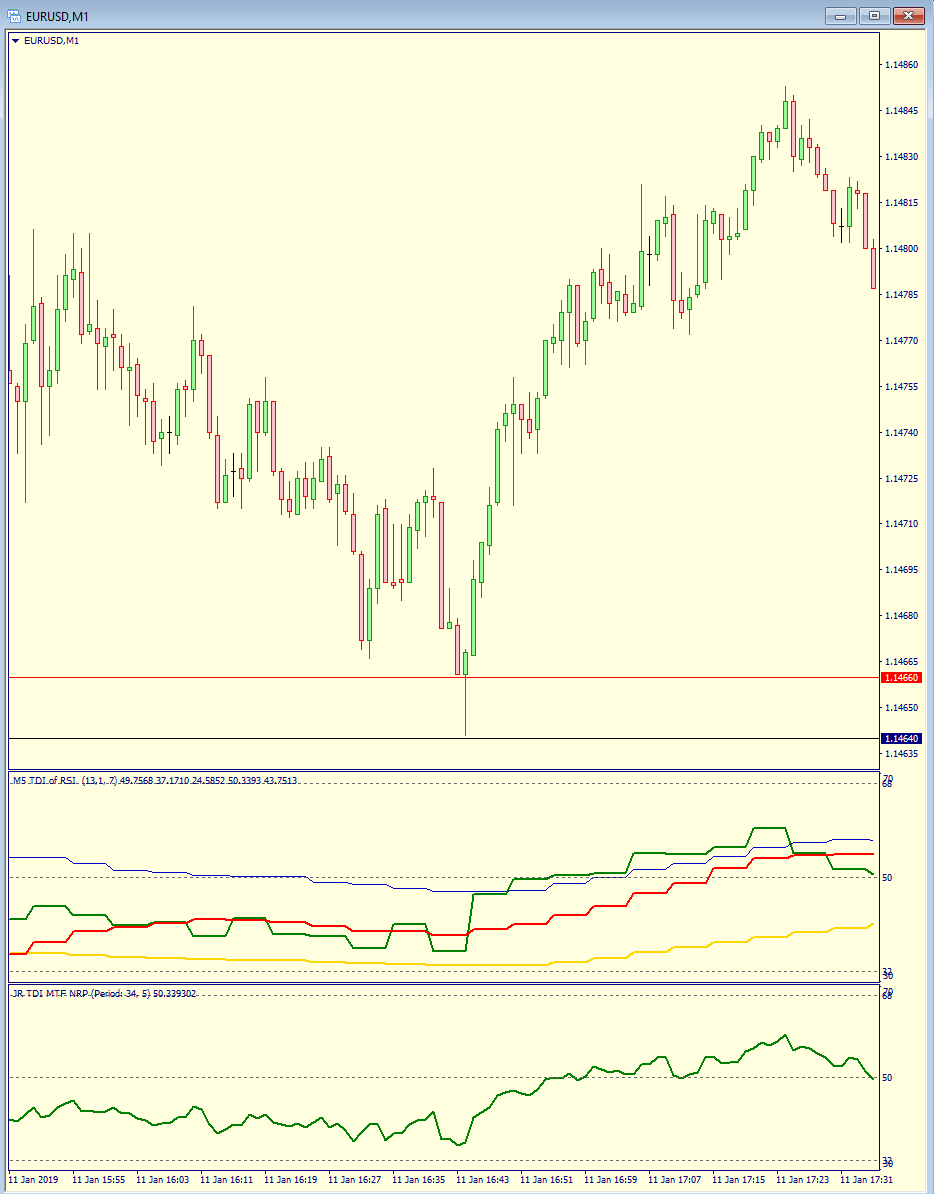
If you look at the attached image TDI indi Steps.png you can see the M1 chart of EURUSD with a MTF version on the TDI indicator showing the M5 data. As you can see it has flat steps as the data repaints over each 5 minutes. Underneath that indicator you can see my first attempt at doing just the green line. This line shows the M5 data as it was at the end of each minute and does not repaint. This is done by replacing the last M5 bar data with the relevent M1 data at the time for calcualtions. This is possible on all timeframes - use the lower timeframe for the last part of the calculation and the completed higher timeframe data for the rest. So a combination of data would need to be used. The indicator only uses a number of close values (usually a maximum of 34 figures) so it's fairly simple to understand the workings.

I attach a spreadsheet (TDI-small file.zip) with live data and all of the calculations of how this is possible (colour coded columns to match the lines) - this should really help speed up the creation of the indicator and has taken a lot of the work out of the project. Fairly certain it's all correct but would need to be checked.

Basically as the M5 data is plotted on the M1 chart it moves around - it is not a flat "step" - however most MTF indi's do not go back and work out how it moved about during the 5 minutes they just repaint the whole M5 period as a flat step - so the attached spreadsheet has worked out how to "undo" this and recalculate as it was at the time (for past values) and as it happens (for live values). This has removed the flat "steps" from the higher timeframe data displayed on the lower timeframe.

So the project would be to turn TradersDynamicIndex-JR.mq4 into a proper MTF indicator without the flat "steps" typically seen on most MTF indicators using the methods shown in the spreadsheet

Indicator should work on all timeframes and use minimal code.

Indicator should be tested in real time to check the values correspond to the higher timeframe.

Please check all lines match up M1 to M5 before submitting for review. To do this

If you place TradersDynamicIndex-JR.mq4 on M5 and the newly MTF NRP on M1 it should match up live all of the time - all of the lines.

When you have made the indicator please do not submit it to me until you have checked that all M5 lines match on M1 at (00:04, 00:09, 00:14, 00:19 etc... 23:54, 23:59) times.

Any questions, please ask!

Please read and understand the entire specification before quoting and explain in your quote that you fully understand the job and are capable of doing it, thank you!


Arquivos anexados:

Respondido

1
Desenvolvedor 1
Classificação
(647)
Projetos
1295
67%
Arbitragem
84
26% / 49%
Expirado
338
26%
Livre
2
Desenvolvedor 2
Classificação
(50)
Projetos
80
39%
Arbitragem
4
50% / 25%
Expirado
0
Livre
Pedidos semelhantes
I have an EA that need some changes including integrating the indicator code directly into the Expert Advisor. I will give the detailed doc once we settle on the candidate for the job . Please bid if you can work with the stated amount. Thanks
Hello, Need to convert Tradingview Indicator to MQL4 indicator. or if you have this one converted already, let me buy a copy please. If we're good, then will definitely buy it and ask to convert into EA on new order. Supertrend by KivancOzbilgic
Fix bug or modify an existing Trading view indicator to display correct. The indicator is working but not displaying/plotting all the information i want. So i want it adjusted to plot all the info
Here's a brief requirement you can use: **Description:** I am seeking an experienced MQL5 developer to create a (EA). The EA should include features for placing pending orders (Buy Stop and Sell Stop) based on market spread, managing trades effectively at the opening of new candlesticks, and implementing take profit and stop loss strategies. Additionally, I would like the option to adjust parameters based on market
I have an EA which i need to do below modifications. Variable Inputs to be added Order Type : Market , Pending Trade Type : Buy, Sell , Buy & Sell Pending Pips Step : ( Pips Value can be negative or positive to decide on what type of Pending Order ) // If trade type Buy is selected Close Type : Close All ( Bulk Close Option in MT5 ) , Close Individually Close Option : %of Equity , %of Balance , Amount $ , %of No
Add multiplier to grid recovery system. For example: Grid Trade 2-3 Spacing; 1.0 Multiplier Grid Trade 4-6 Spacing; 2.0 Multiplier Grid Trade 7+ Spacing; 1.6 Multiplier Need quick turn around. Need it done ASAP
Objects reader PIN 70 - 100 USD
Hi I have an indicator that create objects in the chart and using those following some rules the new indicator will create external global variables with value = 0 ( NONE ), = 1 ( BUY ) or = 2 ( SELL ). The global variable will use PIN external integer number . PINS are by now global variables (GV) whose name indicates the pair name and the PIN belonging and their value indicates it direction/action. PINS GV names
I want an indicator and its source code that returns the value of: - two moving averages in different selectable timeframes, with method Exponential and price calculation price_open; - Opening, closing, maximum and minimum of the candle in different timeframes And that returns the values ​​regardless in a chart of one minute. The input parameters: * select timeframe media1 = {1,2,3,4,5,...} * select timeframe media2
Hello, I want offline Renko chart based on pips and time. Trading View Renko chart is a perfect example of what I require, it prints renko bricks at close of time frame chosen which is more cleaner. The Trading View Renko chart wait until end of desired timeframe candle to close before final renko bricks are drawn. Best is to look at Trading View renko charts to see exactly how this works. I currently have an
A simple candle pattern indicator is required that makes a sound alert and draws an arrow when two consecutive bars have the same high or the same low. If two highs, the second bar is a down close and the bar immediately preceding the two highs is a lower high. Vis versa for 2 lows. The second bar is an up close and the bar immediately preceding the two lows is a higher low. Please see attached images for

Informações sobre o projeto

Orçamento
40 - 72 USD
Desenvolvedor
36 - 64.8 USD
Prazo
para 7 dias