Trabalho concluído
Termos de Referência
Hello everyone. I need an Indicator for MT4. I will explain the content of the indicator below.
Down there I attached a file maybe looking directly the pic will give you an idea faster then reading all....
Explanation :
The indicator will plot horizontal lines from the open price hour selected in the settings by the trader,
and in some cases plot some arrows above and below the horizontal lines if matches with the condition.
The indicator can plot up to 8 horizontal lines(all based on open price) .
The horizontal lines need to extend until the next day by default.
The extension of the horizontal line needs also to be adjustable.
For example if I set the open price at 9am and the extension to +4 hours,
the indicator will plot a horizontal line from the open price of 9am and the horizontal line will extend until 13pm,
if set to +12 the line will extend until 9pm (21:00).
By default the horizontal line should extend until the next open price of the next day(2h hours extension) .
For example if I choose 9am and leave it to default, the horizontal line will extend until next day (to 9 am) .
When a new open price of 9 am appears, the previous horizontal line of the open price of 9am needs to disappear automatically by default.
For verification purpose I need the passed Horizontal to appear according to the parameter settings.
For example If i set the look back days to 30, the indicator has to show 30 horizontal lines back to 30 days.
If set to 0 only 1 line should appear. ( not need this option for each line if set to 30 all the 30 past lines of all selected hours have to appear)
Each line color, line type and thickness should be individually selectable from the colors tab and
the arrows pointing up and down have to be selectable( its size and color: for example arrow pointing up green and arrow pointing down red..)
2 arrows will appear above and below the horizontal lines when the difference between the open prices meet the condition selected by the trader in the settings.
I need a adjustable parameter True or False for the arrow mode with a specified value in pips.
If the arrow mode is set to true, and if it is set to 15 pips for this example, and
if the difference between the 2 open prices are less then 15pips.
2 arrows will appear above and below the horizontal lines(left side of the lines see the picture attached)
By default Arrows disappear when a new arrow appear however like the horizontal line look back days option, it could remain if set to more than 1.
For example I set 4 open lines :9h, 13h, 16h and 20h and arrow mode is set to true and to 15pips.
The indicator will draw 4 horizontal lines and if the difference between the lines(any combination (9,13)(9,16)(9,20)(13,9)(13,16)(13,20)(16,9)(16,13)(16,20)(20,9)(20.13)(20,16))
is less or equal to 15pips, 2 arrows will appear above and below the 2 horizontal line( 2 arrows on the left side See the picture attached. ) .
I will write down all the required parameters below to resume:
8 horizontal lines based on hourly open price selected by the trader ( it could be just 1 or 2 lines, maximum 8 clors, type thickness need to be selectable)
extension of each horizontal lines (optional:by default the lines should extend until the next new open)
color, type thickness of the each horizontal lines
Arrow mode True or False
Pips of the arrow mode
Size and color of the arrow.
Look back days option for horizontal lines
Look back days option for Arrows.
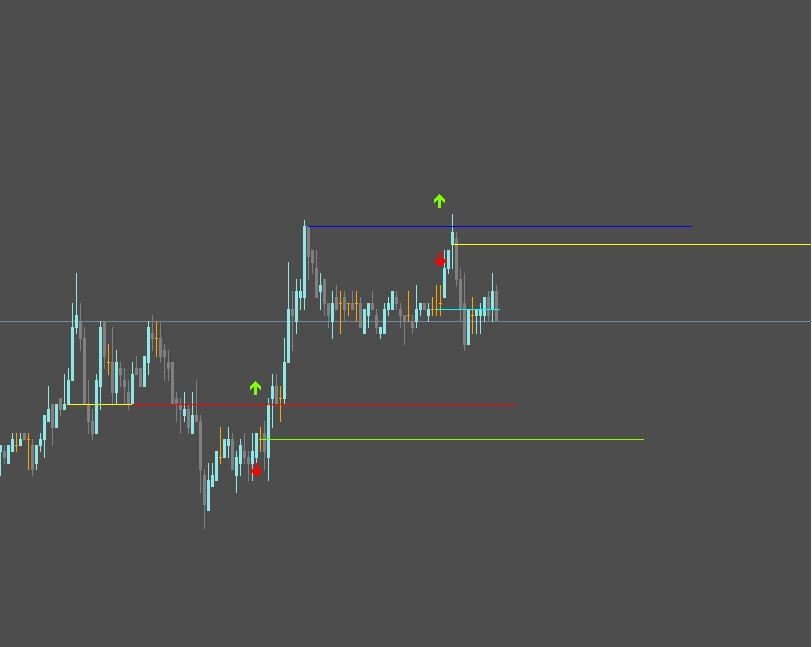
I will attach a picture to make it clear with explanation:
In the picture there are 5 lines. Yellow, Red, Light Green, Blue and Light Blue.
Yellow, Red, Light Green, Blue are open lines by default so will extend until the next day.
Only the light blue line is set to plus +4 so it is a 4hour long line.
As you can see on the picture, First 2 arrows appear when the Light green line appears because the difference between the Red line is narrow(=>15pips).
Arrow does not appear when the Blue line first appears because none of the line is close to Blue line. (Yellow Red and Light Green are far away from the Blue line)
Second Arrow appear when the new Yellow line appears because it is close to the Blue line(0-15 pips for example).
Off course arrows appear because Arrow mode is set to True and it matches with the pips parameter that was set by the trader in the settings.
I hope I made it clear.
Thank you and for any question feel free to ask me.
I will need the code source mql4 also wanna study.
I also need to be able to save the setting of the indicator !!!!!!!!!!!!!!!!!!