Trabalho concluído
Termos de Referência
**Note: Please make sure to read everything and ask questions, I will not approve any project that does not meet my expectation 100%**
Don't want to waste your time or mine, that's all.
Two Strategy Trading EA
Indicator's Needed:
1ST Strategy
4hr EMA 36 In the 30 Min Chart
1hr EMA 12 In the 30 Min Chart
SAR In the 30 Min Chart
2ND Strategy
Simple Moving average 1m Chart
SAR 1m Chart
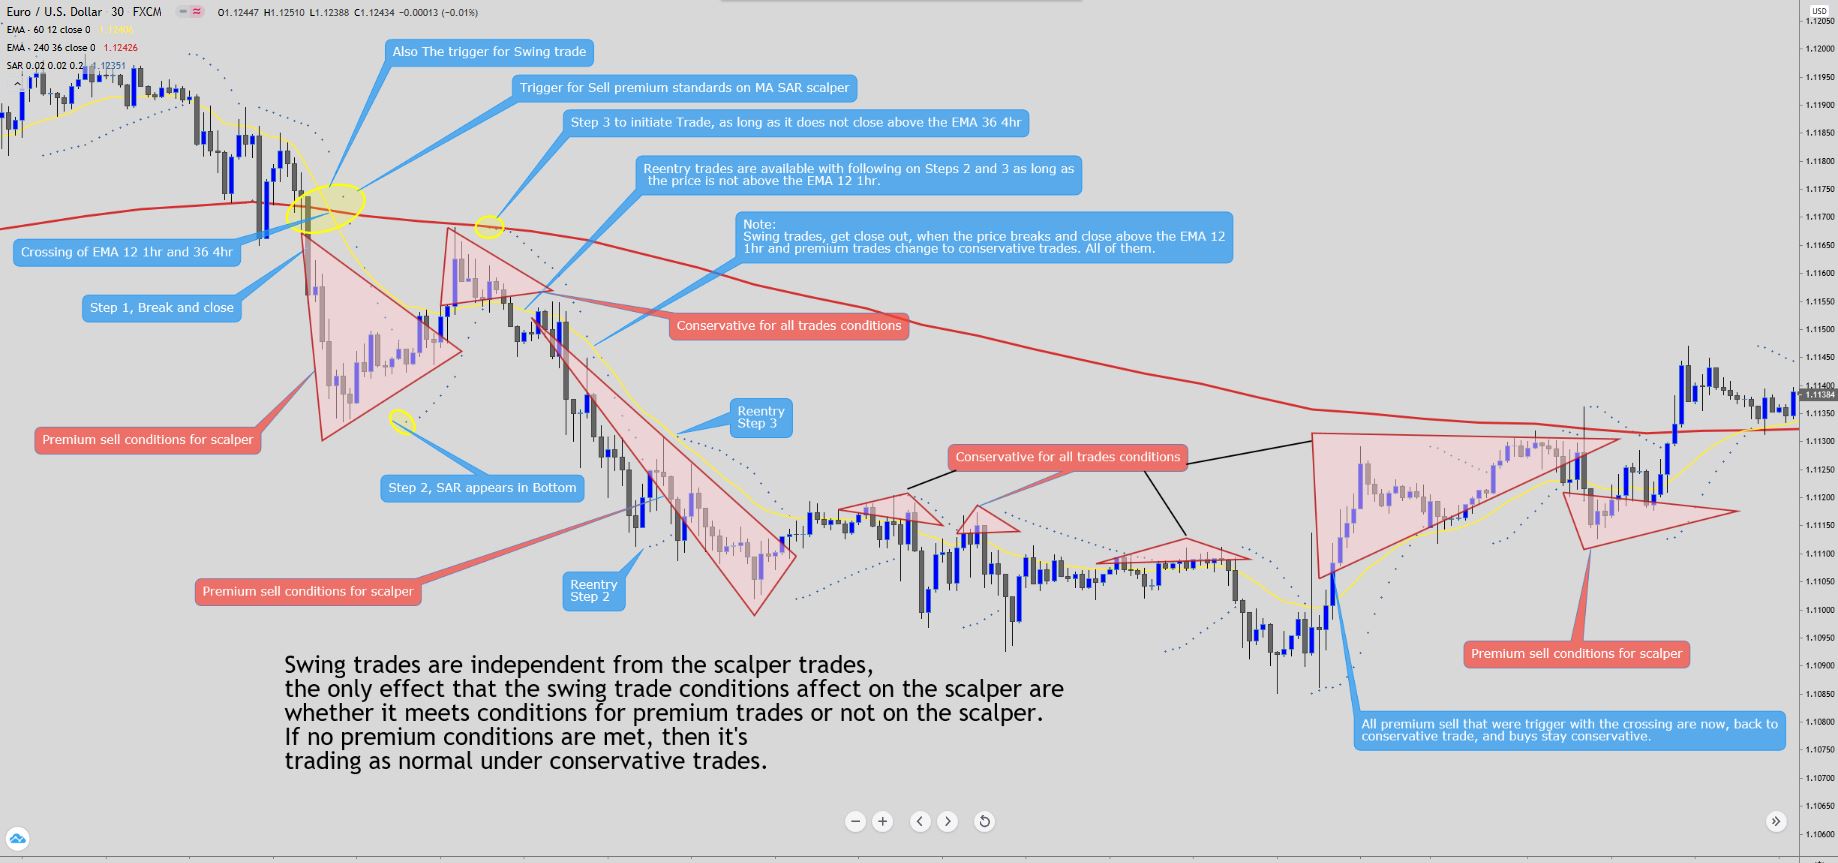
Step 1: Price will break and close below or above the EMA 36 4hr in the 30 min chart
Step 2: The SAR in the 30 min chart will appear in bottom/top of price
Step 3: The SAR in the 30 min chart will appear on top/bottom of price triggering a Sell or a Buy.
Once the EMA has crossed will trigger the second strategy that will have it's own parameters of operation as the one explained here but in a different time frame.
Note: Price cannot close above/below the 4hr 36 EMA on the 30 min chart or the initial swing trade will be nulled.
If initial trade is good, Steps two and three can be followed for reentry, with minor adjustment of the EMA 12 1hr cannot be closed above/below or conditions for reentry are nulled.
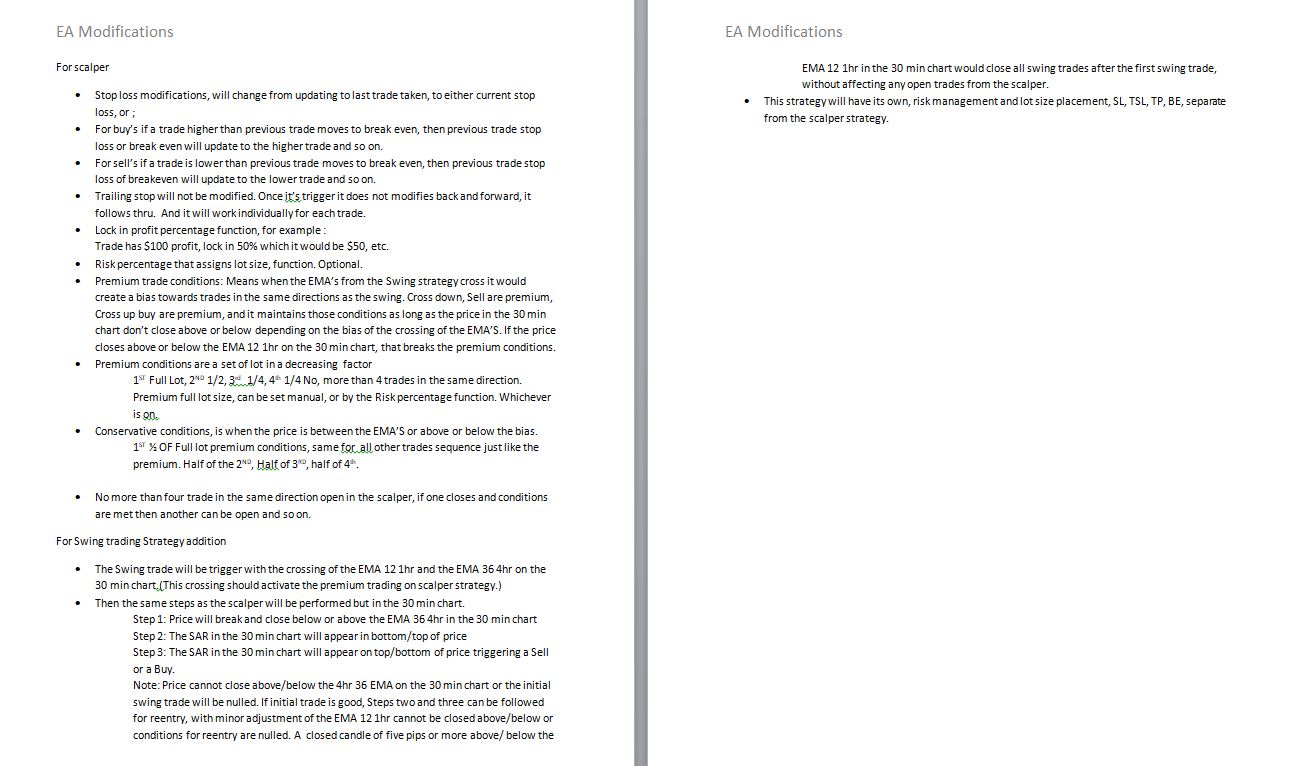
A closed candle of five pips or more above/ below the EMA 12 1hr in the 30 min chart would close all swing trades after the first swing trade.
Stop loss, can be the crossing of the Moving averages, or the break above the 12 EMA as explained.
Lot decrease factor function, Let's say I have set a lot size of 0.1, The first trade would be 0.1, but if there is a reentry, then it will be half 0.05, and a another reentry, then it will be 0.025, and so on. To the Max of 4 trades in the same direction.
TP, BE, SL, TSL
Money Management with the option to use it or not.
Lot size
Alert signal when the EMA'S Cross on either direction, Alert type. Yellow blinking chart.