RsiColoredCandles
- 지표
- Ely Alsedy
- 버전: 1.0
RSI Colored Candles에 오신 것을 환영합니다. 이 혁신적인 지표는 상대 강도 지수(RSI)를 직접 가격 차트에 통합하여 기존 RSI 지표와는 달리 RSI 수준을 직접 촛대에 표시합니다. 이렇게 함으로써 한눈에 가치 있는 통찰력을 제공합니다!
특징 및 이점:
-
공간 절약형 디자인: 혼잡한 지표 창에 작별! RSI Colored Candles은 별도의 RSI 창이 필요 없도록 하여 소중한 차트 공간을 절약하고 더 깨끗하고 명확한 거래 경험을 제공합니다.
-
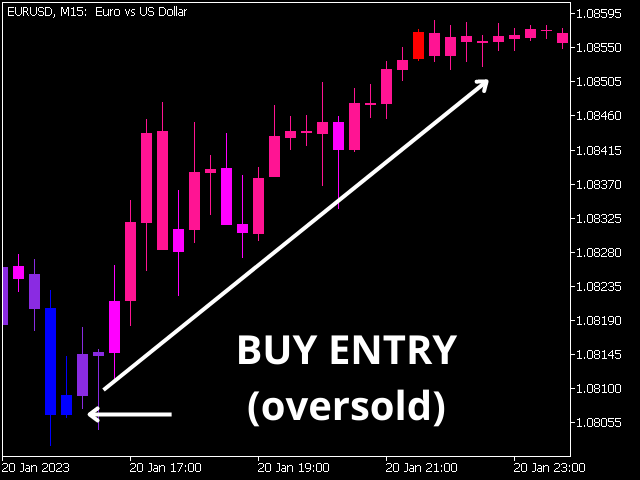
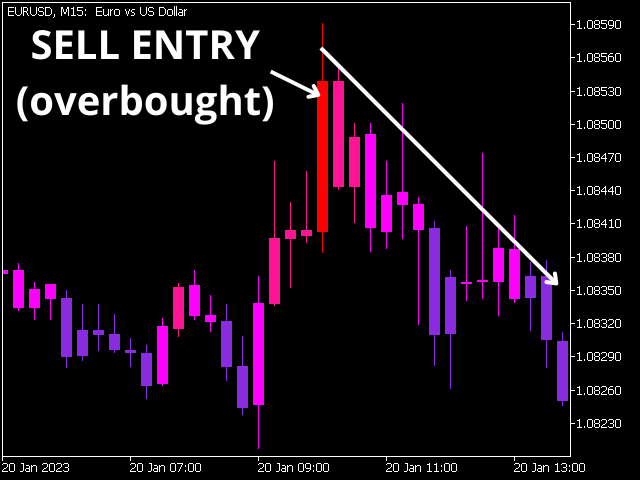
과매수 및 과매도 구역의 시각적 표현: 가격 차트에서 직접 과매수(빨간 촛대로 나타남) 및 과매도(파란 촛대로 나타남) 상태를 쉽게 식별합니다. 이 시각적 표현은 더 나은 거래 결정을 내리고 잠재적인 추세 반전 기회를 최대한 활용할 수 있도록 합니다.
-
개선된 진입 신호: 색상 분류된 촛대를 거래 신호로 사용하여 파란 촛대는 매수 기회를, 빨간 촛대는 매도 기회를 나타냅니다. 이 직관적인 접근은 거래 과정을 단순화하고 RSI 조건을 기반으로 한 명확한 진입 지점을 제공합니다.
-
공급 및 수요 지역과의 통합: RSI Colored Candles을 공급 및 수요 분석과 결합하여 거래 전략을 더욱 개선합니다. 핵심 공급 및 수요 지역 내에서 RSI 극단을 식별하여 수익성을 극대화하고 거래 결정의 정확성을 높일 수 있습니다.
거래 팁:
- 보다 반응성 있는 신호를 생성하고 변동하는 시장 조건에 빠르게 적응하기 위해 RSI 기간을 짧게 설정하세요. 예를 들어 6을 사용할 수 있습니다.
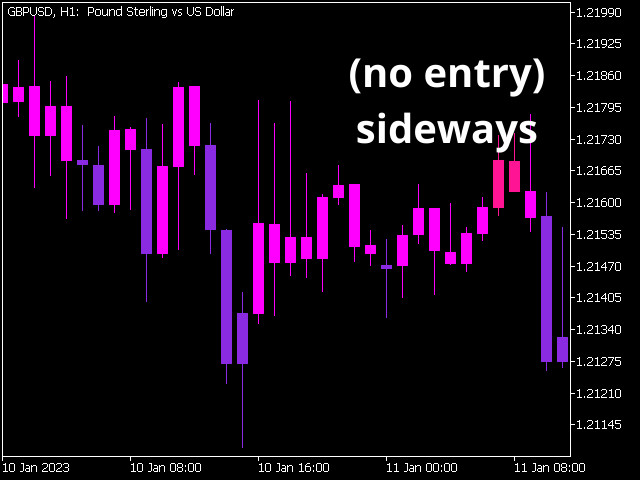
- 거래를 시작할 때는 항상 전반적인 시장 방향성을 고려하세요. 하락 추세 중에도(파란 촛대가 나타나더라도) 매수하지 않고, 상승 추세 중에도(빨간 촛대가 나타나더라도) 매도하지 않도록하여 시장의 우세한 센티먼트와 일치시키세요.
- 추가 확인을 위해 RSI Colored Candles을 다른 지표나 가격 행동 분석과 결합하여 거래 신호를 검증하고 잘못된 신호를 최소화하세요.
RSI Colored Candles의 파워를 경험하고 오늘부터 거래 방식을 혁신하세요! 직관적인 디자인과 강력한 통찰력으로, 이 지표는 거래에서 더 큰 성공을 달성하는 열쇠입니다.

good work in practice helpful in conjunction with other INDICATORS to improve results