Market Ticker Free
- 지표
- John Louis Fernando Diamante
- 버전: 1.2
- 업데이트됨: 22 8월 2021
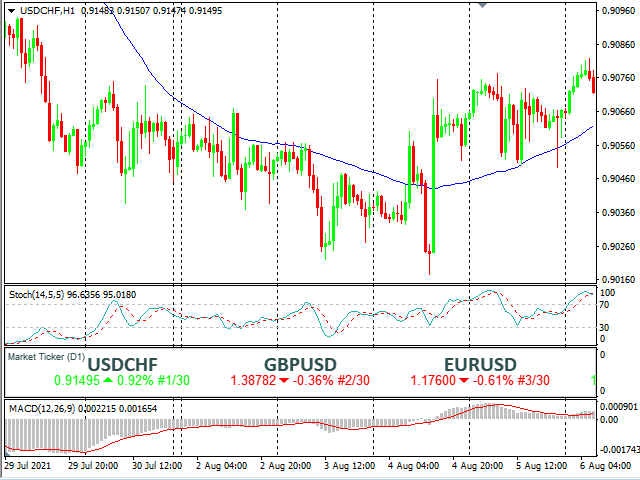
A scrolling Market Ticker that displays price changes from all symbols in the Market Watch list.
Provides an easy snapshot of symbol prices, and keeps scrolling automatically while you trade and analyse the chart.
Options include:
- MTF, eg choose to show price changes of the daily chart, or the hourly
- use the live candle or the recently completed
- font and background coloring


очень помагает спасибо