SymbolsAnalyze
- 유틸리티
- Juraj Puchky
- 버전: 1.0
의미가 없는 상관 관계가 있는 기호를 거래하십시오. 그렇다면 어떤 기호가 서로 연관되어 있지 않고 현재 추세에서 반대인지 확인할 수 있다면 어떨까요?
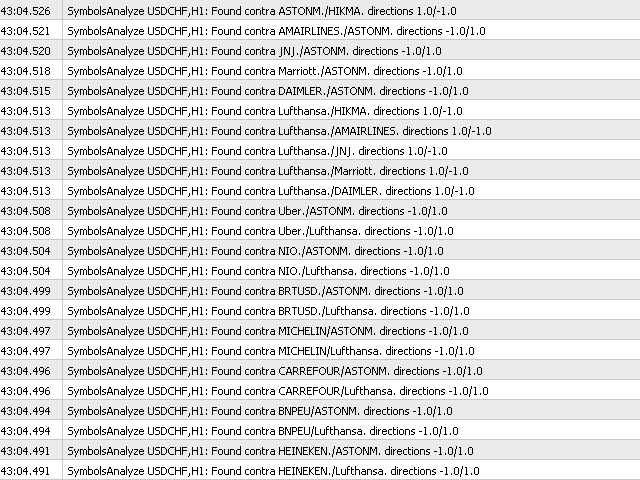
이 간단하고 빠른 분석을 위해 이 유틸리티를 사용할 수 있습니다. 간단히 실행하고 서로 반대되는 기호 쌍 목록을 확인하십시오. 분석 결과는 전략 로그에 인쇄됩니다.
이중성 A -> B == B -> A는 표시되지 않습니다.
추세를 계산할 기간(일별, 시간별, 월별)을 지정할 수 있으며 시간 관리 및 투자 전략에 따라 선택이 달라지며 기본 ID는 하루입니다.
현재 가격과 이전 단계 사이의 최소 차이(백분율), 기본값은 2%입니다.
최소 차이 계산에 사용할 단계 수입니다.
의미가 없는 상관 관계가 있는 기호를 거래하십시오. 그렇다면 어떤 기호가 서로 연관되어 있지 않고 현재 추세에서 반대인지 확인할 수 있다면 어떨까요?
이 간단하고 빠른 분석을 위해 이 유틸리티를 사용할 수 있습니다. 간단히 실행하고 서로 반대되는 기호 쌍 목록을 확인하십시오. 분석 결과는 전략 로그에 인쇄됩니다.
이중성 A -> B == B -> A는 표시되지 않습니다.
추세를 계산할 기간(일별, 시간별, 월별)을 지정할 수 있으며 시간 관리 및 투자 전략에 따라 선택이 달라지며 기본 ID는 하루입니다.
현재 가격과 이전 단계 사이의 최소 차이(백분율), 기본값은 2%입니다.
최소 차이 계산에 사용할 단계 수입니다.