AIS Advanced Grade Feasibility MT5
- 지표
- Aleksej Poljakov
- 버전: 1.1
- 업데이트됨: 24 6월 2022
- 활성화: 5
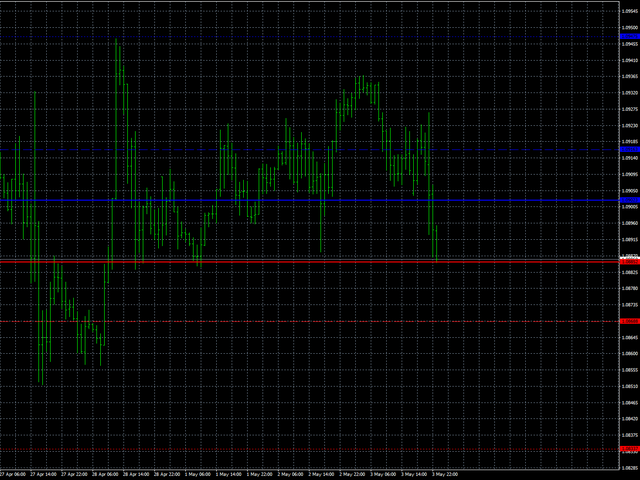
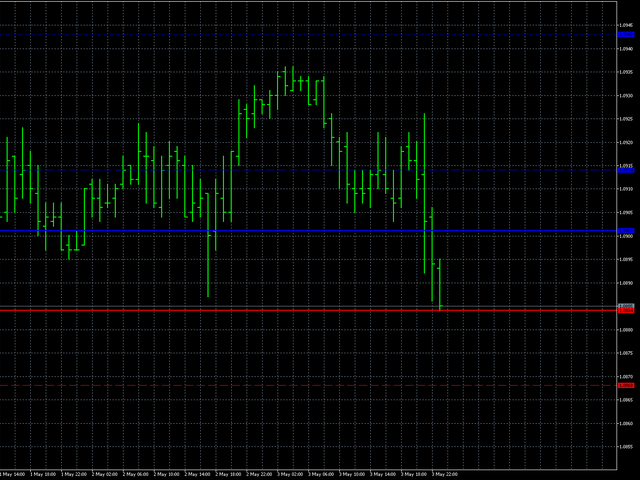
AIS 고급 등급 타당성 지표는 가격이 미래에 도달할 수 있는 수준을 예측하도록 설계되었습니다. 그의 임무는 마지막 세 막대를 분석하고 이를 기반으로 예측을 작성하는 것입니다. 표시기는 모든 기간 및 모든 통화 쌍에서 사용할 수 있습니다. 설정의 도움으로 원하는 예측 품질을 얻을 수 있습니다.
예측 깊이 - 원하는 예측 깊이를 막대로 설정합니다. 이 매개변수는 18-31 내에서 선택하는 것이 좋습니다.
이 한계를 넘어설 수 있습니다. 그러나 이 경우 예측 수준의 "고정"(18보다 작은 값의 경우) 또는 과도한 수준의 폭(31보다 큰 값의 경우)이 가능합니다.
신뢰 수준 1, 신뢰 수준 2 및 신뢰 수준 3 - 예측 신뢰 수준. 1-99 범위 내에서 설정 가능합니다. 신뢰 수준 1은 신뢰 수준 2보다 커야 하고, 신뢰 수준 3은 가장 작아야 합니다.
이러한 각 수준은 예측 깊이 매개변수에 의해 결정된 막대 수에 대해 가격이 이 값에 도달할 확률의 백분율을 보여줍니다.
Color lvl high 및 Color lvl low - 선의 색상을 선택할 수 있습니다.
Style lvl - 레벨에 해당하는 선의 스타일을 선택할 수 있습니다.
너비 lvl - 레벨에 해당하는 선의 너비를 설정합니다.

사용자가 평가에 대한 코멘트를 남기지 않았습니다