Abiroid Sharkfin Scanner
- 지표
- Abir Pathak
- 버전: 1.3
- 활성화: 20
Features:
- Sharkfin Alerts
- Multi-timeframe
- Multi-currency
- SM TDI: To show TDI lines with sharkfin levels
- Zigzag MTF: To see Higher Timeframe trend
Arrows works on a single timeframe and single currency. But it’s visually helps see that sharkfins.
You can also get the simple arrows from mql5 site product:
https://www.mql5.com/en/market/product/42405
About Scanner:
It is an easy to use simplified scanner.
It will show when a sharkfin up/down arrow signal and will also give alerts. And brackets show how many bars back the signal had happened.
Read more about common dashboard settings here:
https://www.mql5.com/en/blogs/post/747456
About Arrows:
Sharkfin Arrows indicator will only show Up/Down arrows. And you can use it’s buffer values 0 and 1 in case using it with an EA.
https://www.mql5.com/en/market/product/42405
It is a modified TDI with extra levels which help you see sharkfins better:
What is Shark Fin TDI Pattern?
Sharkfin Pattern happens when price suddenly rises and then quickly starts dropping, or suddenly drops and quickly starts rising.
When this happens, the RSI Price Line (green) will cross the overbought line and go below it quickly, creating a sharkfin like pattern.
Same for when price crosses oversold lines and back quickly inside. After a sharkfin, price will continue going in same direction for next few bars and so we can trade this pattern with a lot of success.
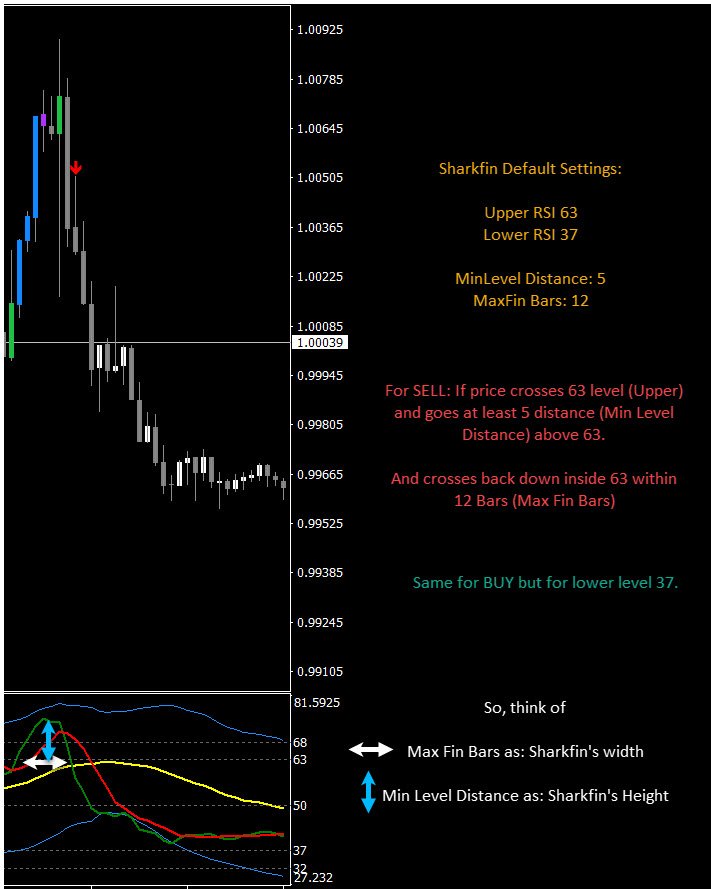
Upper Shark Fin: In TDI Indicator when Green RSI Price Line breaks above a certain level and also breaks upper Volatility band and then breaks below that level, then a shape resembling a Shark’s fin is formed.
RSI follows the price. This pattern indicates that RSI Price Line rose suddenly and fell, means price will most likely keep falling further and so it’s a good time to make a SELL.
For BUY Signal, it’s an inverted shark fin.
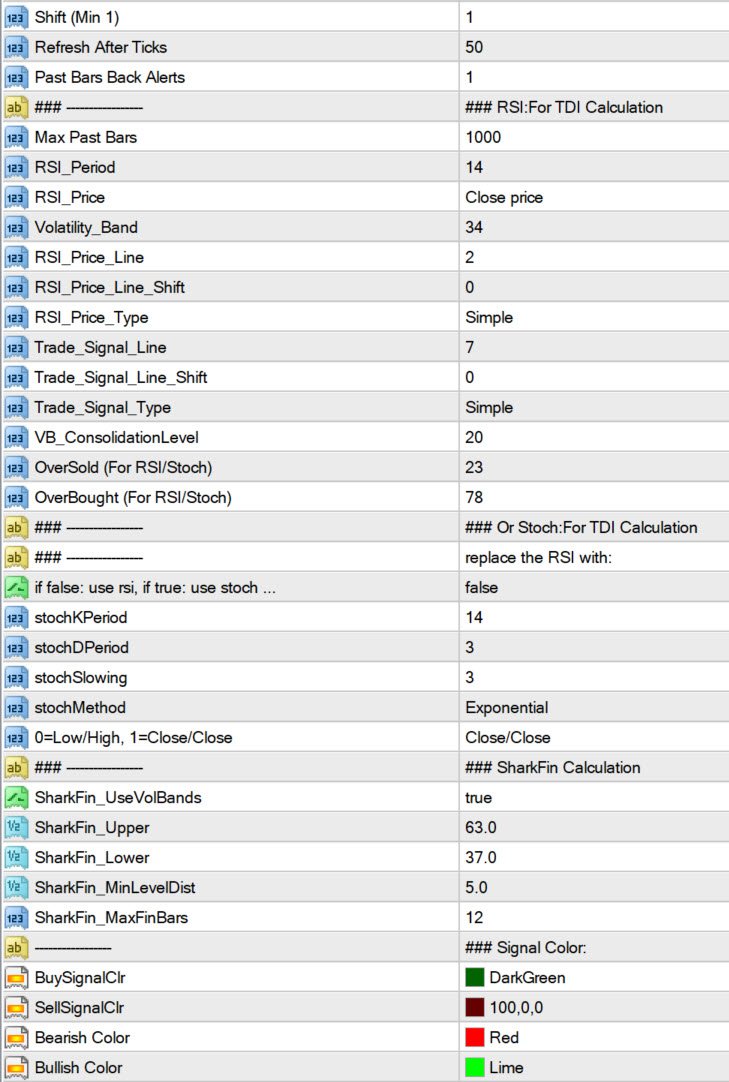
Indicator Properties:
- RSI Settings: Period, Price, Line, Line Shift, Volatility bands, Price Type, Overbought, Oversold
- SharkFin Settings:
- SharkFin Levels: Upper and Lower RSI Levels
- Sharkfin UseVolBands: If set to false only use Upper and Lower SharkFin Levels
- MinLevelDist: Min distance from Upper/Lower Level, that RSI should reach for it to be a valid sharkfin
(example: If Upper Level is 63 and MinLevelDist is 10, then for a valid sharkfin the RSI should reach at least 73)
- MaxFinBars: Max bars within which the Sharkfin should get resolved.
(example: If MaxFinBars is 10 and if Upper Level is 63, then RSI should go above 63 and come below 63 within max 10 bars)
Other Settings:
- MaxPastBars: Total previous bars for which SharkFin is calculated. Default 5000
- ShowAlerts: Show Popup alerts when SharkFin is detected or not
How to use it and Optimize settings?
Apply indicator to chart and also apply a TDI indicator. You’ll see Sharkfins forming in the TDI.
Change MinLevelDist and MaxFinBars values and see which types of Sharkfins you need to detect.
Keeping lower MinLevelDist and higher MaxFinBars is great for scalping. But for longer trading on higher frames set these values to default. Otherwise you’ll get too many unreliable signals. Also, for scalping you can keep Use Volbands to false. To get more signals.
Always trade in direction of higher timeframe’s overall trend.