• 미리보기
  • 리뷰
  • 코멘트

Multi Level ATR and Moving Average Band Indicator

개요

멀티 레벨 ATR 및 이동 평균 밴드 지표는 거래자들이 시장 트렌드, 지지 및 저항 수준, 변동성을 명확히 식별할 수 있도록 도와주는 강력한 도구입니다. 이 지표는 여러 이동 평균을 ATR(평균 진폭 범위) 배수와 결합하여 가격 움직임 주위에 시각적으로 구별되는 밴드를 생성합니다. 이를 통해 거래자는 잠재적인 반전 지점, 트렌드 상태 및 시장 통합 영역을 식별할 수 있습니다.

기능

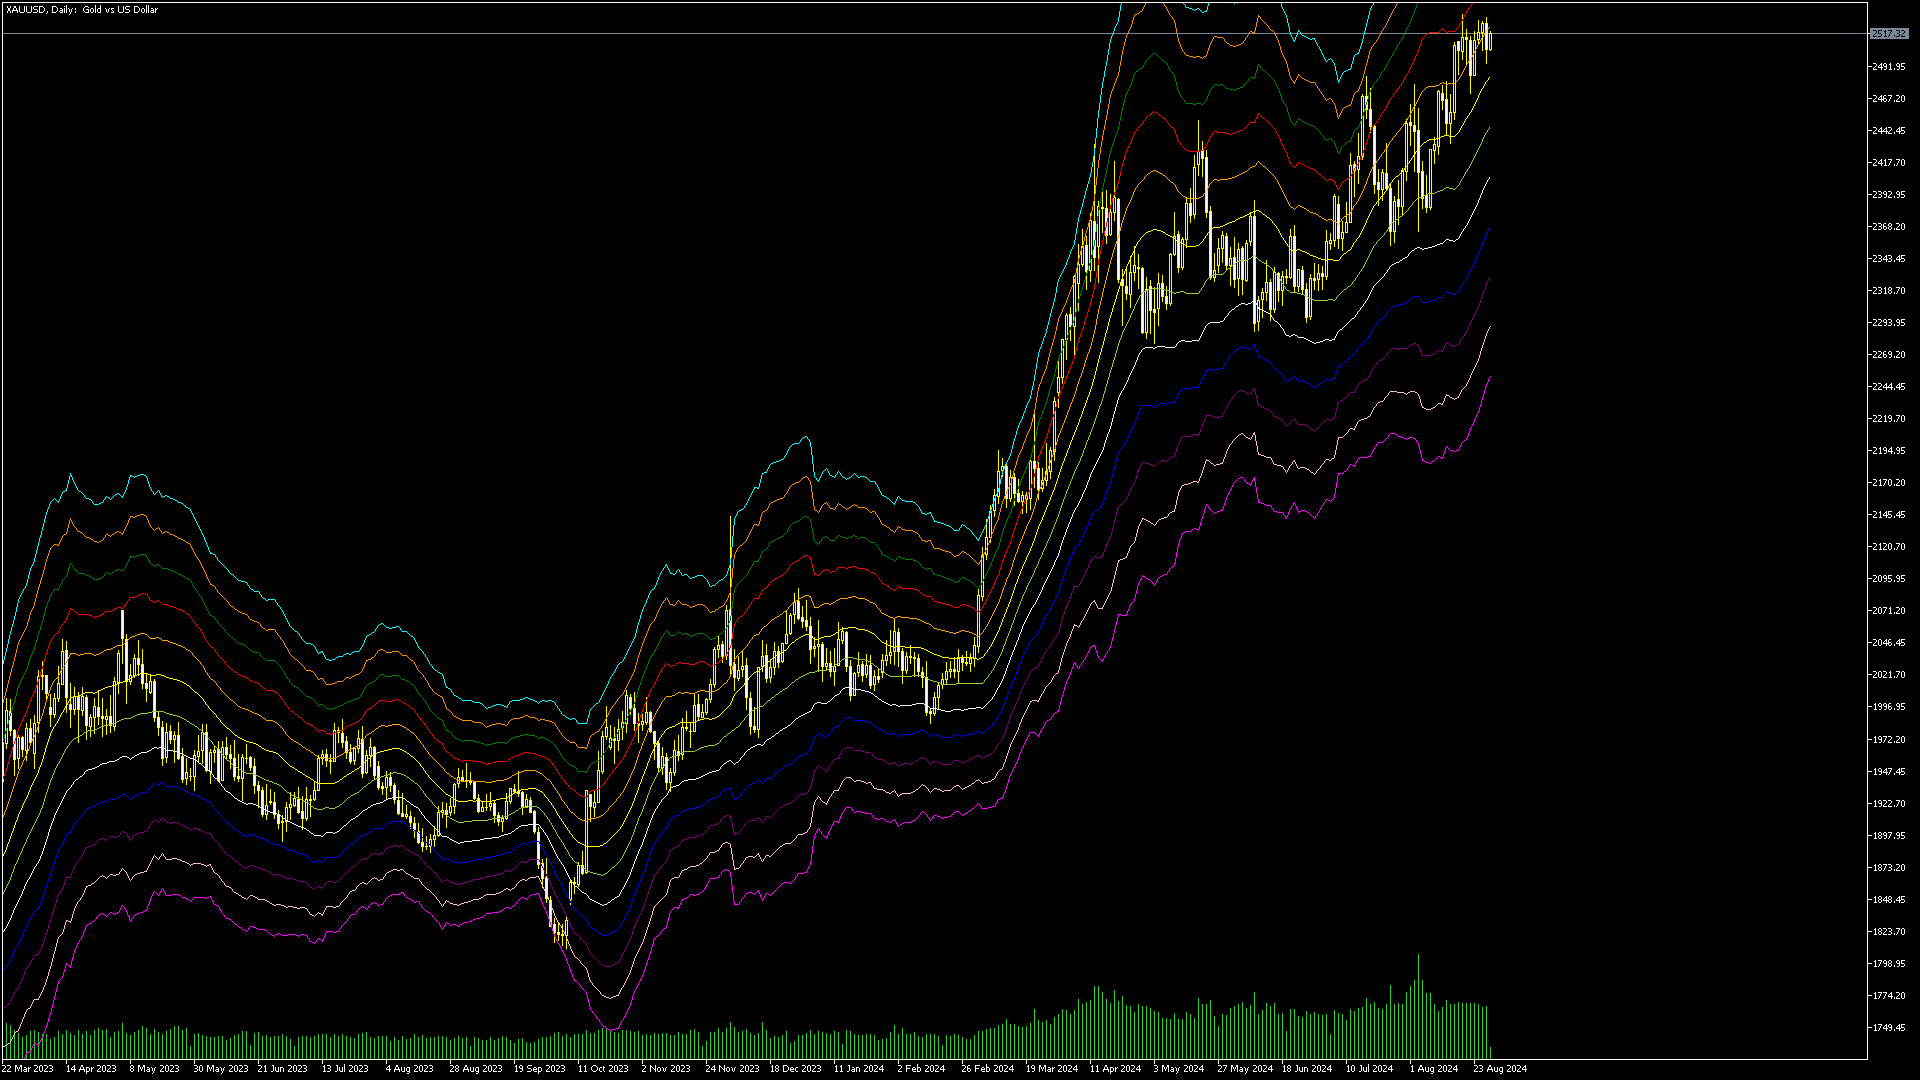
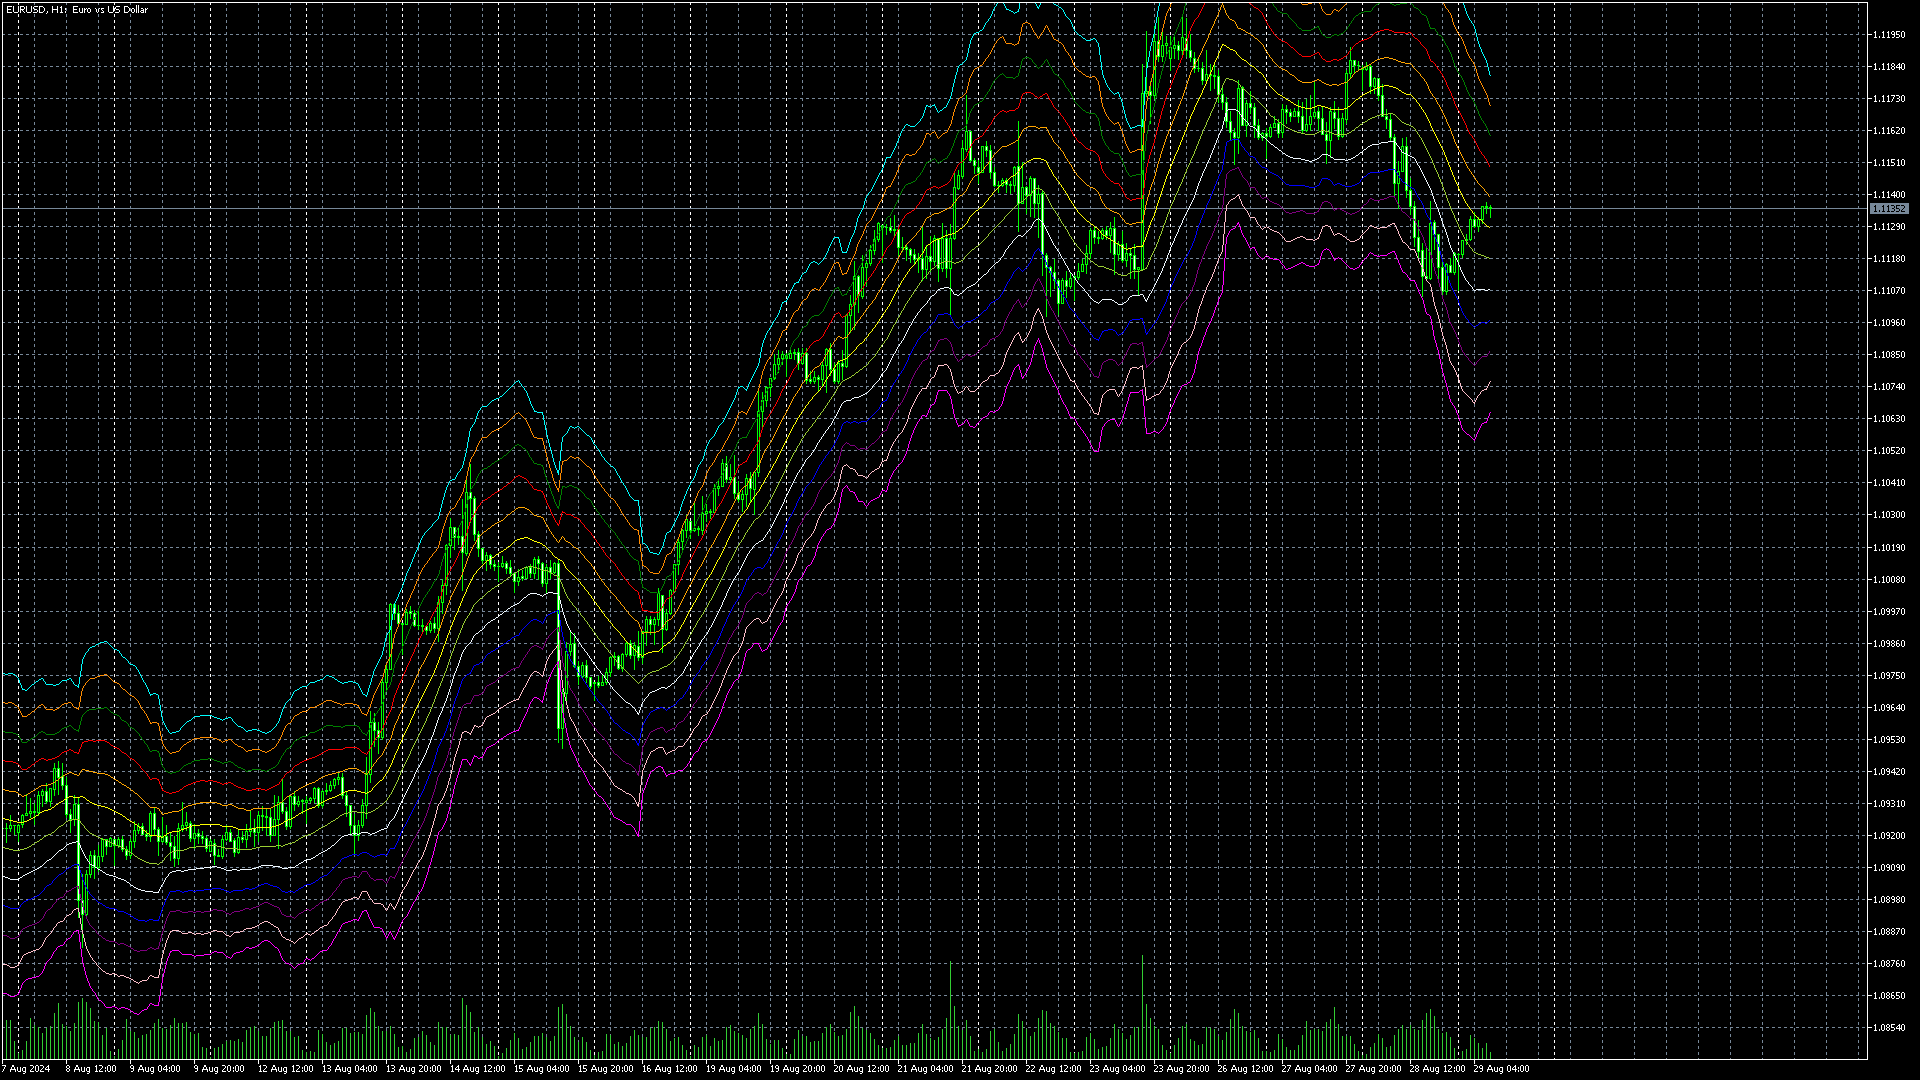
  • 다중 밴드 표시: 가격의 최고, 중간, 최저 이동 평균 및 ATR 계산에서 파생된 6개의 동적 밴드를 색상으로 구분하여 트렌드를 쉽게 식별할 수 있도록 합니다 (빨간색, 주황색, 노란색, 녹색, 파란색, 보라색).
  • ATR 변동성 밴드: ATR 배수를 사용하여 변동성에 따라 밴드를 조정하고, 잠재적인 가격 반전 또는 지속을 명확히 시각화합니다.
  • 조정 가능한 매개변수: 다양한 시장 조건 및 거래 전략에 맞게 ATR 배수와 이동 평균 기간을 완전히 조정할 수 있습니다.
  • 트렌드 식별의 명확성: 밴드는 변동성에 따라 확장 및 수축되어 거래자가 트렌드, 통합 단계 및 잠재적인 가격 돌파점을 쉽게 식별할 수 있습니다.
  • 다중 시간 프레임 호환성: 스칼핑, 스윙 트레이딩 또는 장기 투자 등 모든 거래 시간 프레임에 적합합니다.

사용법

  • 트렌드 식별: 이 지표를 사용하여 트렌드 시장과 사이드웨이 시장을 구분합니다. 밴드가 확장되면 변동성이 증가하고 잠재적인 돌파가 발생할 수 있으며, 수축되면 변동성이 낮고 통합되고 있음을 나타냅니다.
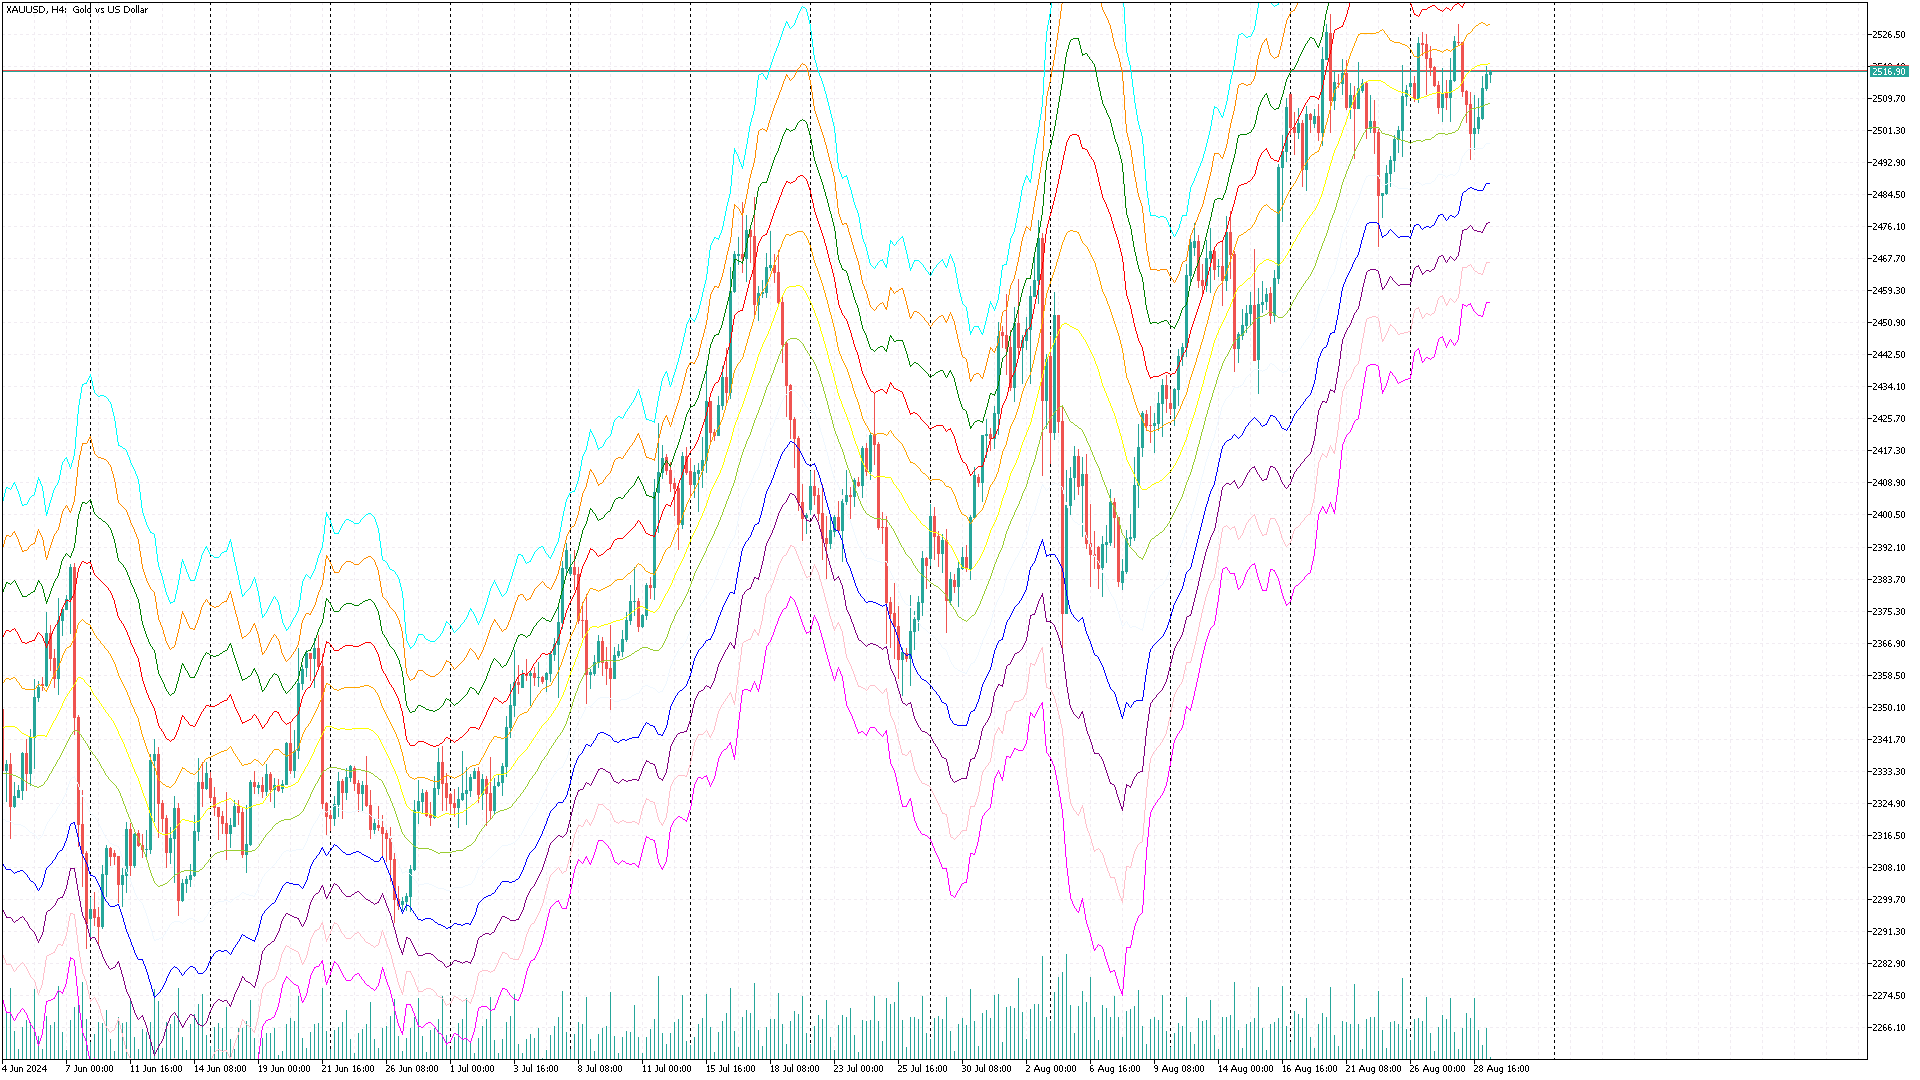
  • 반전 신호: 가격이 외부 밴드에 닿으면 종종 잠재적인 반전 지점을 나타냅니다. 이를 통해 거래자는 손절매를 설정하거나 수익 실현 목표를 설정하거나 진입점을 계획할 수 있습니다.
  • 리스크 관리: 지표의 변동성 밴드는 ATR에서 파생된 것으로, 적절한 손절매 거리 및 포지션 크기 설정에 대한 통찰력을 제공합니다.

조정 옵션

  • ATR 배수: 배수를 조정하여 밴드의 변동성 민감도를 조정합니다.
  • 이동 평균 기간: 선호하는 거래 스타일과 도구에 맞게 이동 평균 기간을 선택합니다.

이상적인 사용처

  • 트렌드 거래자: 트렌드의 강도와 방향을 확인하고 식별하는 데 도움이 됩니다.
  • 반전 거래자: 외부 밴드와의 가격 상호작용을 분석하여 잠재적인 반전 지점을 제공합니다.
  • 변동성 기반 전략: 높은 및 낮은 변동성 단계에 대한 시각적 통찰력을 제공하여 거래자가 전략을 조정할 수 있습니다.

라인 이해하기

지표는 이동 평균 및 ATR 배수에서 유도된 12개의 라인을 계산합니다:

  • 상단 라인: 가격 위의 라인, 고점 이동 평균(HighMa)과 ATR 배수를 곱한 값에서 파생됨.
  • 하단 라인: 가격 아래의 라인, 저점 이동 평균(LowMa)과 ATR 배수를 곱한 값에서 파생됨.

거래 전략

버퍼 및 해당 색상

  1. FirstBuffer (색상: 빨간색)

    • 목적: 가장 높은 ATR 밴드의 상단 경계를 나타냅니다.
    • 계산: FirstBuffer[i] = HighMa[0] + 2 * AtrMultiplier * currAtr[0]
    • 설명: 고점 이동 평균에 ATR 배수를 곱한 값에 두 배를 더한 값을 나타냅니다. 더 높은 저항 수준을 표시합니다.
  2. SecondBuffer (색상: 주황색)

    • 목적: 중간 ATR 밴드의 상단 경계를 나타냅니다.
    • 계산: SecondBuffer[i] = HighMa[0] + AtrMultiplier * currAtr[0]
    • 설명: 고점 이동 평균에 ATR 배수를 곱한 값을 나타냅니다. 중간 저항 수준을 표시합니다.
  3. ThirdBuffer (색상: 노란색)

    • 목적: 고점 이동 평균을 나타냅니다.
    • 계산: ThirdBuffer[i] = HighMa[0]
    • 설명: 고점 이동 평균을 나타내며, 밴드의 기준선 또는 중심선 역할을 합니다.
  4. FourthBuffer (색상: 연두색)

    • 목적: 저점 이동 평균을 나타냅니다.
    • 계산: FourthBuffer[i] = LowMa[0]
    • 설명: 저점 이동 평균을 나타내며, 하단 밴드의 기준선 또는 중심선 역할을 합니다.
  5. FifthBuffer (색상: 알리스를 블루)

    • 목적: 중간 ATR 밴드의 하단 경계를 나타냅니다.
    • 계산: FifthBuffer[i] = LowMa[0] - AtrMultiplier * currAtr[0]
    • 설명: 저점 이동 평균에서 ATR 배수를 곱한 값을 뺀 값을 나타냅니다. 낮은 지지 수준을 표시합니다.
  6. SixthBuffer (색상: 파란색)

    • 목적: 가장 낮은 ATR 밴드의 하단 경계를 나타냅니다.
    • 계산: SixthBuffer[i] = LowMa[0] - 2 * AtrMultiplier * currAtr[0]
    • 설명: 저점 이동 평균에서 ATR 배수를 두 배 뺀 값을 나타냅니다. 더 낮은 지지 수준을 표시합니다.

기술적 장점

이 지표는 사용자가 시장의 변동성을 시각적으로 인식하고 잠재적인 트렌드 반전 또는 지속을 확인할 수 있도록 돕는 다채로운 시각적 정보를 제공합니다. 여러 레벨의 밴드를 통해 다양한 가격 수준에서의 트렌드 및 변동성을 파악하고, 이동 평균을 기반으로 하여 더 정확한 트렌드 분석을 지원합니다.

결론

멀티 레벨 ATR 및 이동 평균 밴드 지표는 가격 움직임을 분석하고 변동성을 고려하여 명확한 거래 신호를 제공하는 강력한 도구입니다. 여러 밴드를 활용하여 다양한 시장 상태를 분석하고 거래 전략을 조정할 수 있는 유용한 도구입니다.

추천 제품
Smooth price for Monarch
Konstantin Gruzdev
5 (1)
The Smooth Price technical indicator is used for plotting a smoothed line as close to the price of the financial instrument as possible, and serves to eliminate its noise components. The indicator is part of the Monarch trading system, but here it is presented as an independent technical analysis tool. The indicator is based on the cluster digital filter , which, unlike the ClusterSMA , is applied directly to the price time series. Smooth Price does not redraw (except the very last, zero bar) an
Darwin Assistant
Ramzi Abuwarda
혁신적인 MT5 지표인 DARWIN Assistant   을 소개합니다. 성공적인 거래의 세계로 가는 궁극적인 관문입니다! 정확성과 전문성으로 설계된 DARWIN Assistant   은 RSI, 스토캐스틱, CCI 및 추세와 같은 고급 기술 지표의 힘을 모든 시간대에 걸쳐 활용하는 특별한 전략에 따라 운영됩니다. 이 최첨단 지표는 진입을 위한 가장 정확한 신호를 제공하므로 비교할 수 없는 확신을 가지고 시장을 탐색할 수 있으므로 특별한 거래 경험에 대비하십시오. DARWIN 트래픽을 사용하면 가장 수익성이 높은 거래 기회를 감지할 수 있도록 세심하게 보정된 중요한 지표에 대한 포괄적인 분석에 액세스할 수 있습니다. 불확실성에 작별을 고하고 정보에 입각한 의사 결정의 새로운 시대를 맞이하십시오. RSI, Stochastics, CCI 및 Trends가 DARWIN Assistant   내에서 원활하게 수렴되어 전례 없는 시장 역학을 생생하게 보여줍니다. DARWIN Assi
Premium level Pro
Dmitriy Kashevich
Premium level is a unique indicator with more than 80% accuracy of correct predictions! This indicator has been tested for more than two months by the best Trading Specialists! The author's indicator you will not find anywhere else! From the screenshots you can see for yourself the accuracy of this tool! 1 is great for trading binary options with an expiration time of 1 candle. 2 works on all currency pairs, stocks, commodities, cryptocurrencies Instructions: As soon as the red ar
Looking for reliable levels on a price chart? Already tired of searching for similar indicators? Are the levels not working out as they should? Then this is the indicator for you. Volume Prices Universal is a reliable indicator of horizontal volumes. What does it show? First of all, the main idea of ​​the indicator is to display at which price mark the price has been for the longest time. Thus, the display of price volumes on the price chart is formed. With the help of which you can very simp
Forex Relative Performance indicator This indicator calculates the relative strength of major currencies against the US dollar. The basic idea behind this indicator is "to buy strong currency and to sell weak currency". This indicator allows you to quickly identify the best forex pair to trade according to your trading style (Intraday, Scalping, Swing, or Long Term)
Wave Impulse OmegaScalper - is the manual system for scalping. In many cases Indicator "eats" almost all possible trend wave. System defines up price wave and down price wave. Inside the exact wave - system defines true trend movement and choppy market. Indicator plots signals while market is trending, powerfull and has quiet good volatility. This is complete system with enter and exit points. Main Indicator's Features Signals are not repaint,non-late or disappear(exept cases when system recalcu
The indicator is a gold mine that works with the MACDI strategy with alert supported by AI it working on gold 5m time frame with 92% win the stratige take 15 pip tp and 15 stop 1:1 follow us on telegram : t.me/tuq98 youtube : youtube.com/ssfx1 green color its buy with alert red color its sell with alert this indicator is one from top 10 in greece and one from top 5 in iraq
Di Napoli MACD MT5
Samil Bozuyuk
4.6 (5)
Non-proprietary study of Joe Dinapoli used for trend analysis. The indicator gives trend signals when the fast line penetrates the slow line. These signals remain intact until another penetration occurs. The signal is confirmed at the close of the period. It is applicable for all timeframes.   Parameters Fast EMA: period of the fast moving average. Slow EMA: period of the slow moving average. Signal EMA: period of the signal line.                              ************************************
FREE
SQN Max indicator for MT5 by ITC
Renaud Herve Francois Candel
Sqn Max Indicator Sqn Max is an exclusive indicator to trade the market with high effectiveness. The indicator is based on price action, volatility and trend. This indicator is as simple as possible but not too simple. The indicator can generate alerts to ease the trading process. You don't have to stay all day in front of your screen. The indicator can be used with any class of assets and with any time frame. It is possible to achieve better results trading our list of selected assets. W
Naked Forex Big Shadow indicator for MT5
Renaud Herve Francois Candel
5 (1)
Naked Forex Big Shadow Indicator Big Shadow Indicator is a pattern recognition indicator for Forex, Stocks, Indices, Futures, Commodities and Cryptos. When you have a Big Shadow on your chart then this is a strong signal meaning that you might be ahead of a reversal. You can take other elements (momentum, trend, volatility, price action, fundamentals) to build a complete strategy and confirm your entries. Beware that you might not make money just following the arrows generated by the pattern r
WanaScalper
Isaac Wanasolo
1 (1)
A scalping indicator based on mathematical patterns, which on average gives signals with relatively small SL, and also occasionally helps to catch big moves in the markets (more information in the video) This indicator has three main types of notifications: The first type warns of a possible/upcoming signal on the next bar The second type indicates the presence of a ready signal to enter the market/open a position The third type is for SL and TP levels - you will be notified every time price r
Recursive CCI
Wen Hong Huang
How to use? • Buy Low and Sell High. • Brighter zones means strong Support or Resistance. • Weaker zones appear lighter. • Brighter zones are formed by overlapping of lines from multiple levels of support or resistance. Indicator Menu • The indicator can input 5 different Lengths. • The default settings uses 13, 21, 52, 100 & 200. • Every option are customizable.
The "RMA Signal Indicator MT5" refers to an indicator called "RMA" (Running Moving Average) Signal Indicator designed specifically for the MetaTrader 5 (MT5) trading platform. The RMA is a variation of the Moving Average indicator that emphasizes recent price data. The specific details and functionality of the "RMA Signal Indicator MT5" may depend on the developer or the version you are using. However, in general, here is a general approach to using a signal indicator like RMA on the MT5 platfor
Win43 Scalper
Eadvisors Software Inc.
O novo s43 Scalper para Mini-Índice (WIN-IND) faz operações de curto prazo no timeframe 1min buscando pequenas variações do mercado, utiliza nova tecnologia de trade, os resultados no intraday são íncríveis, confira:      Após a instalação adicione no gráfico dos instrumentos win para visualizar os resultados no backteste. Recomendamos o timeframe de 1min.
표시기는 현재 시세를 작성하여 과거 시세와 비교할 수 있으며 이를 바탕으로 가격 변동을 예측합니다. 표시기에는 원하는 날짜로 빠르게 이동할 수 있는 텍스트 필드가 있습니다. 옵션: 기호 - 표시기가 표시할 기호 선택. SymbolPeriod - 지표가 데이터를 가져올 기간 선택. IndicatorColor - 표시기 색상. HorisontalShift - 지시자가 그린 따옴표를 지정된 막대 수만큼 이동합니다. Inverse - true는 인용 부호를 반대로, false - 원래 보기를 반전합니다. ChartVerticalShiftStep - 차트를 수직으로 이동합니다(키보드의 위/아래 화살표). 다음은 날짜를 입력할 수 있는 텍스트 필드의 설정으로, '엔터'를 누르면 즉시 이동할 수 있습니다.
Atomic Analyst MT5
Issam Kassas
4.5 (16)
우선적으로 언급할 점은이 거래 지표가 다시 그리지 않고 지연되지 않으며 이를 통해 수동 및 로봇 거래 모두에 이상적이라는 점입니다. 사용자 매뉴얼: 설정, 입력 및 전략. Atomic Analyst는 가격의 강도와 모멘텀을 활용하여 시장에서 더 나은 이점을 찾는 PA Price Action Indicator입니다. 고급 필터를 장착하여 잡음과 거짓 신호를 제거하고 거래 잠재력을 높이는 데 도움이 됩니다. 복잡한 지표의 다중 레이어를 사용하여 Atomic Analyst는 차트를 스캔하고 복잡한 수학적 계산을 간단한 신호와 색상으로 변환하여 초보 트레이더가 이해하고 일관된 거래 결정을 내릴 수 있도록합니다. "Atomic Analyst"는 새로운 및 경험이 풍부한 트레이더를위한 종합적인 거래 솔루션입니다. 프리미엄 지표와 최고 수준의 기능을 하나의 거래 전략에 결합하여 모든 종류의 트레이더에 대한 다재다능한 선택지가되었습니다. 인트라데이 거래 및 스캘핑 전략 : 빠르고 정확한
FOTSI Oscillator MT5
Sidi Mohamed El Alaoui
FOTSI (Forex Overview True Strength Index) for MT5! FOTSI is an indicator that analyzes the relative strength of currencies in major Forex pairs. It aims to anticipate corrections in currency pairs following strong trends by identifying potential entry signals through overbought and oversold target areas. Theoretical Logic of Construction: Calculation of Individual Currency Momentum: FOTSI starts by calculating the momentum for each currency pair that includes a specific currency, then aggregat
Super Zone   For several years of observing the principles of the market, Super Zone worked, both then and now, because the indicator  allows you to see the trading range of the  week and even the month that major market participants use. It’s very easy to use, we work on H4 in the weekly range (  in the tester it doesn’t work in the demo mode  ) - we sell from the upper zones, we buy from the lower ones. It marks the zones from the beginning of the week (month) that are  not redrawn  , works on
MSnR Lines
Pierre Paul Amoussou
MSnR Lines 는 차트에 서포트 및 저항 수준을 표시하기 위한 사용자 정의 지표입니다. 이러한 수준은 말레이시아 서포트 및 저항 이론에 기반하여 영역이 아닌 선 차트의 피크와 밸리에서 유도된 특정 가격 수준으로 정의됩니다. 특징: A-Level, V-Level 및 갭 레벨의 세 가지 유형의 수준. 수준에 대한 신선도 표시: 신선한 수준은 신선하지 않은 수준보다 중요합니다. 신선한 및 신선하지 않은 수준을위한 사용자 정의 가능한 색상 및 스타일. 신선한 수준 또는 모든 수준만 표시하는 옵션. 조정 가능한 회고 기간 및 현재 가격 위 아래의 수준 수. 다중 시간 프레임 지원. 사용 방법: 트레이더는 거래 결정을 위해 잠재적인 지원 및 저항 수준을 식별하기 위해 MSnR Lines를 사용할 수 있습니다. 신선한 수준은 보다 중요하며 더 나은 거래 기회를 제공할 수 있습니다.
Quantum Volume Point of Control Indicator for MT5
QUANTUM TRADING SOFTWARE LIMITED
4 (1)
The Quantum VPOC indicator has been developed to expand the two dimensional study of volume and price, to a three dimensional one which embraces time. The volume/price/time relationship then provides real insight to the inner workings of the market and the heartbeat of sentiment and risk which drives the price action accordingly. The Quantum VPOC indicator displays several key pieces of information on the chart as follows: Volume Profile - this appears as a histogram of volume on the vertical pr
Neural Bar Impulse is an indicator based on a neural network created and specially trained to predict the potential impulse of each next market bar. By bar impulse we mean the tendency of the market price to update the maximum or minimum of the bar relative to its opening price. We chose this particular feature of market bars because, based on our own research, we discovered an interesting feature of bar impulses to be harbingers of a change in price trend movements. The neural network we c
골드 블리츠 스캘핑 인디케이터를 소개합니다. 이 도구는 M1, M5, M15 시간 프레임에서 금을 스캘핑하는 데 최적화된 도구입니다. 첨단 AI 신경망을 사용하여 개발된 이 비 리페인트 인디케이터는 일관된 수익성과 뛰어난 거래 결과를 보장합니다. 정밀도와 효율성을 위해 설계된 골드 블리츠 스캘핑 인디케이터는 M15 시간 프레임에서 최고의 결과를 제공합니다. 주요 특징: 첨단 AI 신경망: 최첨단 AI 기술을 활용하여 비할 데 없는 정확성을 실현합니다. 비 리페인트: 리페인트 없이 신뢰할 수 있는 신호를 보장하여 일관된 성과를 제공합니다. 다중 시간 프레임 스캘핑: M1, M5, M15 시간 프레임에 최적화되어 있으며, M15 시간 프레임에서 가장 좋은 결과를 제공합니다. 포괄적인 신호: 명확한 매수/매도 신호와 이익 실현(TP), 손절매(SL) 수준을 제공하여 정보에 기반한 거래를 지원합니다. 장점: 높은 정확성: 높은 정확도의 신호로 우수한 거래 성과를 달성할 수 있습니다. 실
Chanlun
Xiaonong Yu
The ChanLun or Chan theory is one of the most popular trading theories in China. But it seems like that it has little influence in western countries. Actually, the Chan Theory is based on a sophisticated mathematical model. The basic idea ChanLun is to simplify the bar chart by its model. With the help of ChanLun, a trader can analyze and predict the trend of future goods, stocks. In ChanLun, there are several basic elements called fractals, strokes, line segments and pivots . A trader should p
AlgoEAs Trend Dashboard V1 Indicator for MT5 Introduction: This is a Dashboard Indicator based on 7 built in Multi Timeframe indicators. This strategy gives Buy/Sell Ideas based on 9 trend states. Easy to view gas guage to view current trend. Has as optional Alerts to enable with 9 messages. Run on M15 chart, with M15, H1, and H4 indicator time frames. Great tool! Features: Non-Repainting Dashboard For Desktop MT5 Only, Works On Any Mt5 Pair Great for Intraday and Swing Trading Easy view ga
The indicator refers to the means of probabilistic analysis. Prediction is performed by the Monte Carlo method together with a mathematical model of a neuron. But, the modeling of samples for this method is made not artificially, but comes from the original "nature", that is, from history. The number of samples and the detail of their modeling is achieved using the lower (relative current) timeframe. Indicator algorithm : In general terms, the algorithm boils down to the fact that the ind
Candle Pattern Finder MT5
Pavel Zamoshnikov
4.2 (5)
This indicator searches for candlestick patterns. Its operation principle is based on Candlestick Charting Explained: Timeless Techniques for Trading Stocks and Futures by Gregory L. Morris. If a pattern is detected, the indicator displays a message at a bar closure. If you trade using the MetaTrader 4 terminal, then you can download the full analogue of the " Candle Pattern Finder for MT4 " indicator It recognizes the following patterns: Bullish/Bearish (possible settings in brackets) : Hamme
SolarTrade Suite Financial Indicator: Venus Market Indicator - 금융 시장의 세계에서 신뢰할 수 있는 가이드! 이 오실레이터는 특별하고 혁신적이며 진보된 알고리즘을 사용하여 가치를 계산하며, 또한 보기에 좋은 디자인을 가지고 있습니다. 이 지표의 판독값은 이해하기 매우 쉽습니다: 파란색 - 매수, 빨간색 - 매도. 색상이 밝을수록 신호가 강합니다. 설명 하단에서 SolarTrade Suite 시리즈의 다른 제품을 확인하세요. 투자와 금융 시장의 세계를 자신 있게 탐색하고 싶으신가요? SolarTrade Suite Financial Indicator: Venus Market Indicator는 정보에 입각한 투자 결정을 내리고 수익을 늘리는 데 도움이 되도록 설계된 혁신적인 소프트웨어입니다. SolarTrade Suite Financial Indicator: Venus Market Indicator의 장점: -
Gann Zone Pro MT5
Kirill Borovskii
This indicator identifies and displays zones, as it were areas of strength, where the price will unfold. The indicator can work on any chart, any instrument, at any timeframe. The indicator has two modes. The indicator is equipped with a control panel with buttons for convenience and split into two modes. Manual mode: To work with manual mode, you need to press the NEW button, a segment will appear. This segment is stretched over the movement and the LVL button is pressed. The level is displayed
Gioteen Volatility Index (GVI) - your ultimate solution to overcoming market unpredictability and maximizing trading opportunities. This revolutionary indicator helps you in lowering your losing trades due to choppy market movements. The GVI is designed to measure market volatility, providing you with valuable insights to identify the most favorable trading prospects. Its intuitive interface consists of a dynamic red line representing the volatility index, accompanied by blue line that indicate
Trade smarter, not harder: Empower your trading with Harmonacci Patterns Special Offer: Purchase now to receive free bonuses worth $165! (Read more for details) This is arguably the most complete harmonic price formation auto-recognition indicator you can find for the MetaTrader Platform. It detects 19 different patterns, takes fibonacci projections as seriously as you do, displays the Potential Reversal Zone (PRZ) and finds suitable stop-loss and take-profit levels. [ Installation Guide | Up
이 제품의 구매자들이 또한 구매함
TrendMaestro5
Stefano Frisetti
note: this indicator is for METATRADER4, if you want the version for METATRADER5 this is the link:  https://www.mql5.com/it/market/product/108106 TRENDMAESTRO ver 2.4 TRENDMAESTRO recognizes a new TREND in the bud, he never makes mistakes. The certainty of identifying a new TREND is priceless. DESCRIPTION TRENDMAESTRO identifies a new TREND in the bud, this indicator examines the volatility, volumes and momentum to identify the moment in which there is an explosion of one or more of these data a
IVISTscalp5
Vadym Zhukovskyi
5 (5)
당신에게 소개하는 iVISTscalp5 지표는 독특하면서도 거래 작업에서 효과적입니다. 이 지표는 시간 데이터를 기반으로 하며 금융 시장의 많은 경험과 깊은 분석의 결과입니다. iVISTscalp5 지표는 수동 거래에 뛰어난 도구입니다. 편리성, 간단함 및 시각화 - 모든 복잡성은 숨겨져 있습니다. 우리는 iVISTscalp5 지표의 설정과 사용을 최대한 단순화했습니다. 이 지표는 MT5 터미널에서 가지고 있는 모든 금융 상품에 적합합니다. 시간 기준으로 작동하는 시간은 4am에서 8pm (UTC+3)입니다. iVISTscalp5 지표 메뉴 (스크린샷 1 참조): History - 표시할 주간 수 계산 dT_min - 시간 설정 간격 선택 (분) TFline - 수평 볼륨 생성 (타임프레임) BARSline - 수평 볼륨 생성 (바 수) TFtrend1 - 매일 채널 생성 (타임프레임) BARStrend1 - 매일 채널 생성 (바 수) TFtrend2 - 주간 채널 생성 (타임프레임
VTrende Pro
Andrii Diachenko
5 (1)
VTrende Pro - MTF indicator for trend trading with a display panel for MT5 *** Videos can be translated into any language using subtitles (video language - Russian) Although the signals of the VTrende Pro indicator can be used as signals of a full-fledged trading system, it is recommended to use them in conjunction with the Bill Williams TS. VTrende Pro is an extended version of the VTrende indicator. Difference between Pro version and VTrende: - Time zones - Signal V - signal 1-2 waves
The indicator is designed to close positions on the market in time. For example: to take profits ahead of schedule if the price has not reached TakeProfit, and the market is turning around. The indicator analyzes the momentum, not the trend. He does not give any information about the trend. The indicator is well suited for finding divergence. The Ershov 38 Parrots indicator dynamically adjusts to the market and detects price movement impulses of medium and high amplitude. It almost does not rea
Introducing the Power Trade Plus indicator designed by a small group of traders with a few years of experience trading the market profitably.  The Power Trade Plus is derived from the Power Trade indicator,  the indicator strive in powerful sniper entries and take profit levels,  with an algorithm that's can determine the markets volatility and Provides entries based on the current market volatility. This indicator is much more effective in stock ,currencies and indices.
프리시전 트레이딩 시스템의 로저 메드칼프에 의한 프리시전 인덱스 오실레이터 (Pi-Osc) 버전 2는 차트에 신속하게 로드되도록 주의 깊게 다시 코딩되었으며 경험을 향상시키기 위해 몇 가지 다른 기술적 개선 사항이 통합되었습니다. Pi-Osc는 정확한 거래 타이밍 신호를 제공하도록 개발되었으며 시장이 모든 사람의 스톱을 청산하기 위해 가야 하는 극도의 고갈 지점을 찾는 데 목적이 있습니다. 이 제품은 극단적인 지점이 어디에 있는지 알고 있는 고전적인 문제를 해결하며 트레이더로서의 삶을 훨씬 간단하게 만듭니다. 이것은 업계 표준 오실레이터와는 상당히 다른 강력한 차이점을 가지고 있는 고도로 복잡한 합의 지표입니다. 사용하는 기능 중 일부는 수요 지수, 자금 흐름, RSI, 스토캐스틱, 패턴 인식, 거래량 분석, 표준 편차 극단점 및 다양한 길이에서 위와 유사한 변형을 갖습니다. 미숙한 눈에는 다른 오실레이터와 비슷해 보일 수 있지만 RSI 또는 모멘텀과 같은 다
Contact us to receive a comprehensive user guide after purchasing. William Delbert Gann, commonly known as W.D. Gann, was an exceptional market analyst renowned for his unique trading style in the early 20th century.  His trading techniques were based on a blend of mathematics, geometry, astrology, and ancient mathematics. Gann believed that stock market movements followed specific patterns and cycles, rather than being random. His methodologies, celebrated for their accuracy and relevance, con
인공 지능을 기반으로 하는 이 지표는 발자국을 판독하여 가능한 시장 반전 지점을 식별하고 소규모 시장 움직임이 발생하기 전에 사전에 신호를 보냅니다. "늦은" 항목을 생성하는 가격 및 거래량 지표와 달리, 즉 방향 변경 시 가격이나 거래량이 이미 확인되어 움직임이 이미 종료된 경우, 이 지표는 "이동이 일어나야 할 때"라는 발자취를 남기고, 따라서 운동이 시작되는 즉시 시장에 진입할 수 있는 가능성을 제공합니다. 이는 반전 신호를 생성할 뿐만 아니라 이미 진행 중인 추세가 지속된다는 신호도 생성합니다. 지표는 인공 지능 덕분에 실제로 시장에서 체결된 계약을 각 수준별로 읽습니다(장부에서 실행 대기 중인 계약이 아니라 실행 직전에 알고트레이딩을 통해 제거됨). 이 지표는 입찰 및 요청으로 실행된 계약(따라서 본질적으로 수동 주문에서 공격적인 주문을 인식함), 시장에서 실행되는 빈도 및 공격성(따라서 대규모 운영자의 "밀기" 의도를 감지함)을 구별할 수 있습니다. 시장을 특정 방향
Fibonacci Suavizado
Cesar Juan Flores Navarro
Indicador en MQL5, que obtiene el promedio de 10 EMAS, que son alineadas según Fibonacci, obteniendo un promedio, que sera suavizado.  Se puede ingresar un numero desde 2 a N, que multiplica a los EMA-Fibonacci. Funciona en cualquier criptomoneda, etc. etc... pudiendo calcular el futuro segun la tendencia de las EMAS. Funciona excelentemente en tramos largos, determinando exactamente el mejor inicio/salida. El precio inicial por apertura sera por un periodo de tiempo, luego aumentará.
TREND HARMONY MT5 – Multi Timeframe Trend and Phase and Pullback Level Visualizer indicator for Metatrader5 The TREND HARMONY indicator automates deep trend analysis and generates visualizations for you. Take control of your trades by eliminating uncertainty! Revolutionize your trading experience with precision and insight through the TREND HARMONY Multi Timeframe indicator – your ultimate MT5 trend visualization indicator. [  Features and Manual   | MT4 version |   All Products   ] Are you t
Description This addon is originated from my own trading. I spent my whole time waiting for signals and just wanted a notification  when a specific signal appears. So i started to wrote my own addon and called it "LifetimeSaver", because thats exactly what it is for me. But because this addon should not only be for my personal trading, I extended the LifetimeSaver and now its highly customizable,  so that it can fit your needs. Functions: Notification at your defined target/signal Notificatio
EQ Cutrim Theory
Marco Aurelio Santos Costa
Ronal Cutrim has been a dedicated mathematician for 14 years and has more than 10 years of experience in the financial market. The concept of the theory is simple, find imbalance between buyers and sellers. Which makes a lot of sense, because nothing goes up forever, nothing falls forever.   When you find an asset with a mathematical probability of unbalanced equilibrium, it is a great way to get into trading:  TUTORIAL: Turn on the subtitles, the video is subtitled
Классификатор силы тренда. Показания на истории не меняет. Изменяется классификация только незакрытого бара. По идее подобен полной системе ASCTrend, сигнальный модуль которой, точнее его аппроксимация в несколько "урезанном" виде, есть в свободном доступе, а также в терминале как сигнальный индикатор SilverTrend . Точной копией системы ASCTrend не является. Работает на всех инструментах и всех временных диапазонах. Индикатор использует несколько некоррелируемых между собой алгоритмов для класси
Currency Index Watcher is a simple and user-friendly tool for whoever wish to trade Forex using currencies indexes. Currency Index Watcher is configurable and usable directly from the panel. Indexes of 8 custom currencies EUR, USD, GBP, JPY, CHF, AUD, CAD, NZD (default) Any 3-chars symbol from your market watch could be used (BTC = bitcoin, RUB = ruble, CNH = yuan etc ...) : double click the symbol label  Ability to select which currencies and made-of pairs will be analyzed : check/uncheck want
SmartTrendMt5
Andrey Spiridonov
The SmartTrendMt5 trend indicator generates signals based on the principle of combined analysis of calculated reference points within the Keltner channel. The indicator plots the Keltner channel in a separate window (by default, red lines and a blue line - the middle of the channel), and also draws the histogram of calculated reference points for each candle (by default, the histogram bars are yellow). The should be attached to a chart of any timeframe and any trading symbol in the usual way.
Weis Wave with Alert MT5
Trade The Volume Waves Single Member P.C.
4.93 (14)
Limited time offer 40% Discount on six month, yearly and lifetime packages. Offer ends 31/8/2024. Six Month from 209$ to 125$ Yearly from 379$ to 227$ Lifetime from 599$ to 359$ Rental/Lifetime Package Options and Privileges  * For optimum results the yearly or lifetime package is suggested due to live training ! Rent Monthly Six Months   Yearly/Lifetime Weis Wave with Speed with Alert+Speed Index x x x Manual  x x x Quick Set up Video x x x Blog x x x Lifetime Updates x x x Setup and Training
Pendiente de Precio
Cesar Juan Flores Navarro
Indicador en base a la pendiente de la linea de precio, dibuja una línea de color cuando sube a base de los precios que previamente has sido procesados o linealizados, y cuando baja la pendiente la linea linealizada toma otro color. En este caso se a considerado 6 lineas de diferentes procesos desde pendientes largas hacia las cortas, observándose que cuando coincidan las pendientes se produce un máximo o mínimo, lo que a simple vista nos permitirá hacer una COMPRA O VENTA.
Индикатор Coefficient Of Determination (COD) представляет собой значение коэффициента детерминации или квадрат коэффициента корреляции между зависимой переменной — ценой и объясняющей переменной — тиковым объемом. Что это дает нам на практике? COD отлично распознает кульминацию трендовых движений, что позволяет подбирать оптимальные точки и ловить развороты рынка. Как использовать индикатор: Наиболее популярная торговая стратегия строится совместно с трендовым индикатором Moving Average (MA), пе
Fibonacci Multiple 12
Cesar Juan Flores Navarro
Fibonacci Múltiple 12, utiliza la serie fibonacci plasmado en el indicador fibonacci, aumentadolo 12 veces según su secuencia. El indicador fibonacci normalmente muestra una vez, el presente indicador se mostrara 12 veces empezando el numero que le indique siguiendo la secuencia. Se puede utilizar para ver la tendencia en periodos cortos y largos, de minutos a meses, solo aumentado el numero MULTIPLICA.
Recommended TimeFrame >= H1. 100% Non Repainted at any moment.  Use it carefully, only with Trend Direction. Trading Usage: 2 Variants: as Range System or as BreakOut System (Both Only With Trend Direction)::: (Always use StopLoss for minimise Risk); [1] as Range System: (Recommended) in UP TREND:  - BUY in Blue Line , then if price goes down by 50 points (on H1) open Second BUY.   Close in any Profit you wish: TrailingStop(45 points) or Close when Price touches upper Gold Line. in DOWN TR
Linea Horizontal Inteligente
Cesar Juan Flores Navarro
En base a cálculos matemáticos de determino una linea Horizontal que cruza a todas las señales de trading, mostrando los máximos y mínimos. La linea horizontal parte en dos las subidas y bajadas de las señales de trading, de tan manera que es fácil identificar los máximos y mínimos, y es inteligente por que es sensible a las subidas y bajadas, afín de no quedarse en un solo lado por siempre, trabaja excelentemente con otros indicadores suavizadores ya que les garantiza que en un intervalo de tie
Spike Detector
Tete Adate Adjete
this indicator is a Spike detector indicator, it is specially designed to trade Boom 1000, Boom 500, Crash 1000 and Crash 500 We recommend using it on Deriv Boom and Crash indices only Its setting is intuitive, familiar, easy to use it has notification functions; audible notifications and push notifications. this tool is simple to use, easy to handle This update is based on different strategies for spikes
AutoSignals Trend Panel
Danilo Maia Siqueira
The indicator tracks the trend in 5 different chart times for the same asset, based on 6 signals for each chart time. The main objective of the indicator is to show us the majority trend of the financial asset in which it was placed. The system transmits the information of the trends in several graphical times, in this way the user is able to have a wide view of the movement of the asset, this type of tool makes the user have a higher hit rate by helping the operator to execute orders in fa
Limitless MT5
Dmitriy Kashevich
Limitless MT5 is a universal indicator suitable for every beginner and experienced trader. works on all currency pairs, cryptocurrencies, raw stocks Limitless MT5 - already configured and does not require additional configuration And now the main thing Why Limitless MT5? 1 complete lack of redrawing 2 two years of testing by the best specialists in trading 3 the accuracy of correct signals exceeds 80% 4 performed well in trading during news releases Trading rules 1 buy signa
Panel Visao axetrend
Danilo Maia Siqueira
trend view panel; AutoSignals Trend The indicator tracks the trend in 5 different chart times for the same asset, based on 6 signals for each chart time. The main objective of the indicator is to show us the majority trend of the financial asset in which it was placed. The system transmits the information of the trends in different graphic times, in this way the user is able to have a wide view of the movement of the asset, this type of tool makes the user have a higher hit rate by
Escalera Inteligente
Cesar Juan Flores Navarro
Indicador en MQL5, recibe la información del precio SUAVIZADO, lo procesa anulando los picos inteligentemente, y el resultado lo envía al desarrollo de la escalera que iniciara y subirá o bajara según el peldaño o INTERVALO ingresado Ingreso PERIODO = 50 (variar segun uso) Ingreso MULTIPLICA AL PERIODO = 1 (variar segun uso) Segun la configuración la escalera puede pegarse o separarse de los precios,, Se aplica toda la linea de tiempo, y a todas las divisas, etc.  
Seconds Charts
Aleksandr Goryachev
Micro  ******************* Секундные графики MT5 ********************** Более точного инструмента для входа в сделку вы не найдёте. Входные параметры: Timeframe, sek - период построения графика, секунды Displayed bars - отображаемые бары Step of price levels, pp, 0-off - шаг отрисовки ценовых уровней, пункты Scale points per bar, 0-off - масштаб в пунктах на бар Show lines - отображение текущих уровней Show comment - отображение комментария Standard color scheme - стандартная цветовая сх
QXS Market Scanner
Netlux Digital Kft.
QuantXMarketScanner is a multi assets indicator for MT5 - Mathematical model based on 7 custom moving averages indicators  - Adaptable on Currencies, Stocks and Crypto - Automatic setup, self optimized About QuantXsystem Products: –         Simple installation & integration into MT5   –         Unlimited License after purchase (for one user) –         Automatic pattern recognition to identify the best timing and price levels. –         Trading indicators are displayed directly and automatica
QuantXSTocks Trading Range Indicator for MT5: INSTRUCTIONS TO USE OUR INDICATOR:- User needs to take trade on Arrow or after an Arrow CandleStick, You can achieve up-to 35-125 pips target by this Indicator. Best Timeframes for Stocks and Indices are M30 and H1: AMAZON M30 (50 pips) TESLA M30 (50 pips) APPLE M30 (50 pips) ADOBE M30 (50 pips) NASDAQ100 H1 (125 pips) The above are the approximate amount of pips you can achieve by this Indicator, Green arrow appears to be buy arrow while the Red a
Super Suavizador
Cesar Juan Flores Navarro
Indicador en MQL5 que obtiene el promedio de 10 EMAS que son alineadas y procesadas según Fibonacci luego el promedio es suavizado"  Se ingresa un número de 2 a N que multiplica los EMA-Fibonacci y por consiguiente aumenta los fibonacci, resultando un promedio.   Se ingresa un número que suaviza los EMA-Fibonacci. Considerando los números 1/1 seria la suavización minima. Considerando los números 3/5 seria la suavización media. Considerando los números 10/30 seria la suavización alta.....etc
제작자의 제품 더 보기
TK Rainbow
Nguyen Trung Khiem
TK - Rainbow 지표 설명: TK - Rainbow 지표는 다양한 선을 통해 시장 추세를 명확히 파악할 수 있도록 설계된 강력한 기술 분석 도구입니다. 서로 다른 기간으로 계산된 30개의 선을 사용하여 가격 움직임에 대한 포괄적인 분석을 제공합니다. 이 지표는 두 가지 색상 스키마를 사용하여 상승 추세와 하락 추세를 강조하므로 시장 상황을 한눈에 쉽게 해석할 수 있습니다. 주요 기능: 30개의 선: 각 선은 다양한 평활화 기간을 나타내어 광범위한 시장 추세를 포괄합니다. 이중 색상 스키마: 상승 추세(차가운 색상)와 하락 추세(따뜻한 색상)를 구분하기 위해 두 가지 색상을 사용합니다. 사용자 정의 가능한 설정: 거래 선호에 맞게 선의 두께, 스타일 및 단계 크기를 조정할 수 있습니다. TK - Rainbow 사용 방법: 지표 적용: TK - Rainbow 지표를 MetaTrader 5의 지표 목록에서 차트에 추가합니다. 매개변수 설정: 단계 (inpStep): 각 선 사이의
필터:
리뷰 없음
리뷰 답변