• 미리보기
  • 리뷰
  • 코멘트
  • 새 소식

Trade Sniper

Trade Sniper 소개: 시장에서의 우위.


수익성 있는 거래를 놓치거나 시장의 잘못된 측면에서 잡히는 데 지치셨나요? Trade Sniper를 만나보세요. 이 최첨단 지표는 추세의 힘을 활용하여 거래에서 날카로운 이점을 제공합니다.

Trend Sniper는 평범한 지표가 아닙니다. 고급 알고리즘과 시간에 검증된 거래 원칙을 결합하여 믿을 수 없을 정도로 정확하게 높은 확률의 거래 기회를 발견하는 데 도움이 되는 정교한 도구입니다.

Trade Sniper를 시장에서 비밀 무기로 만드는 이유는 다음과 같습니다.

향상된 추세 감지: 당사의 독점 AIgo는 여러 시장 요인을 실시간으로 분석하여 기존 지표를 훨씬 능가하는 정밀도로 추세를 식별합니다.
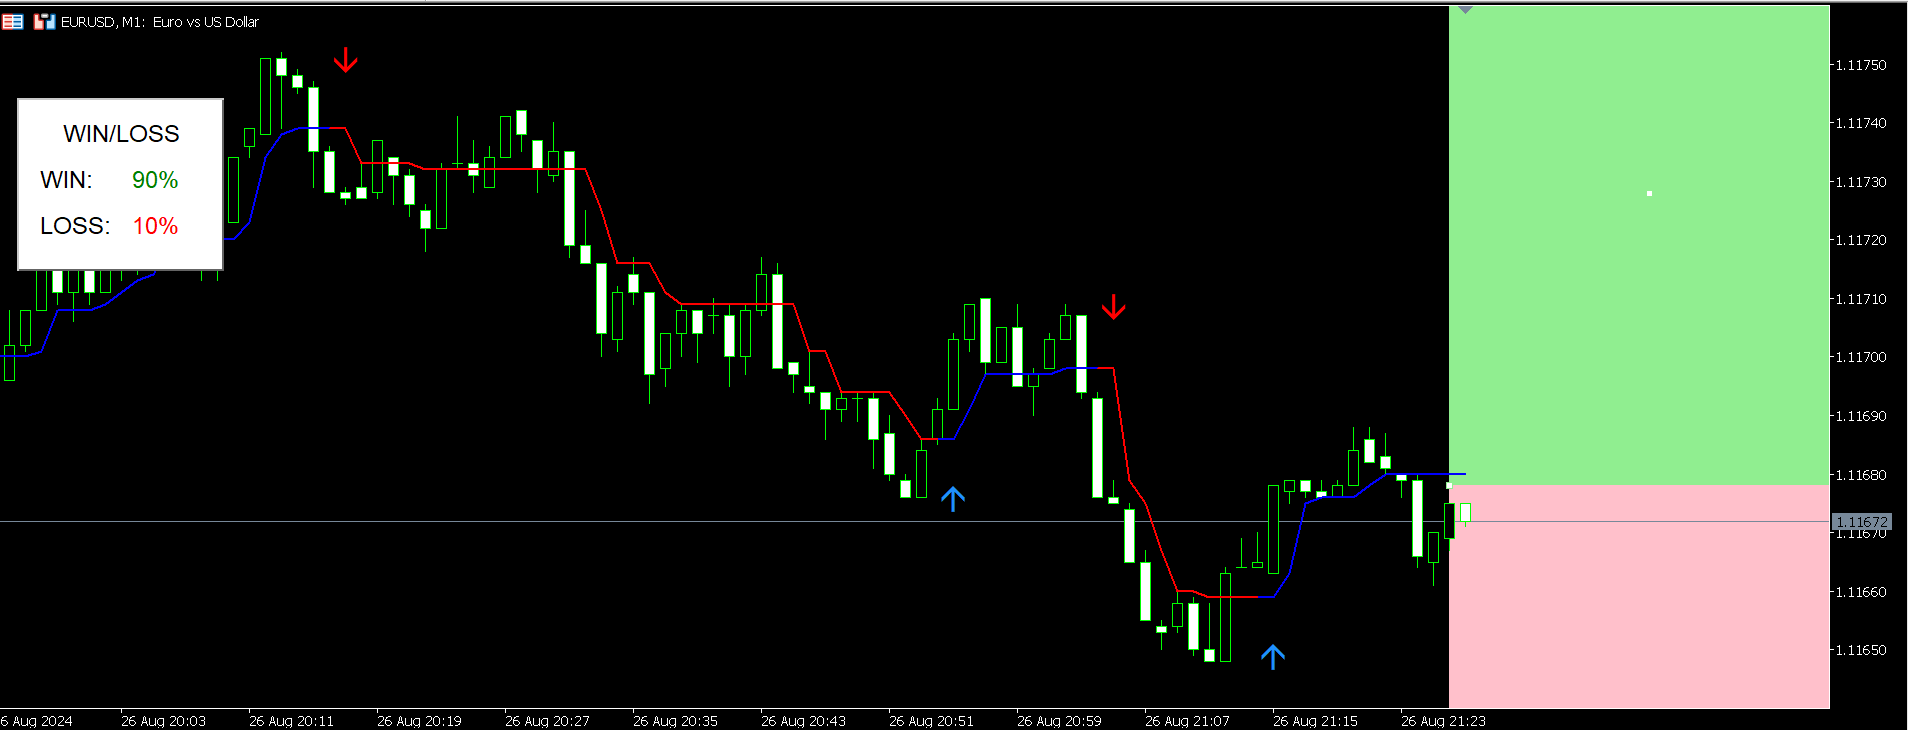
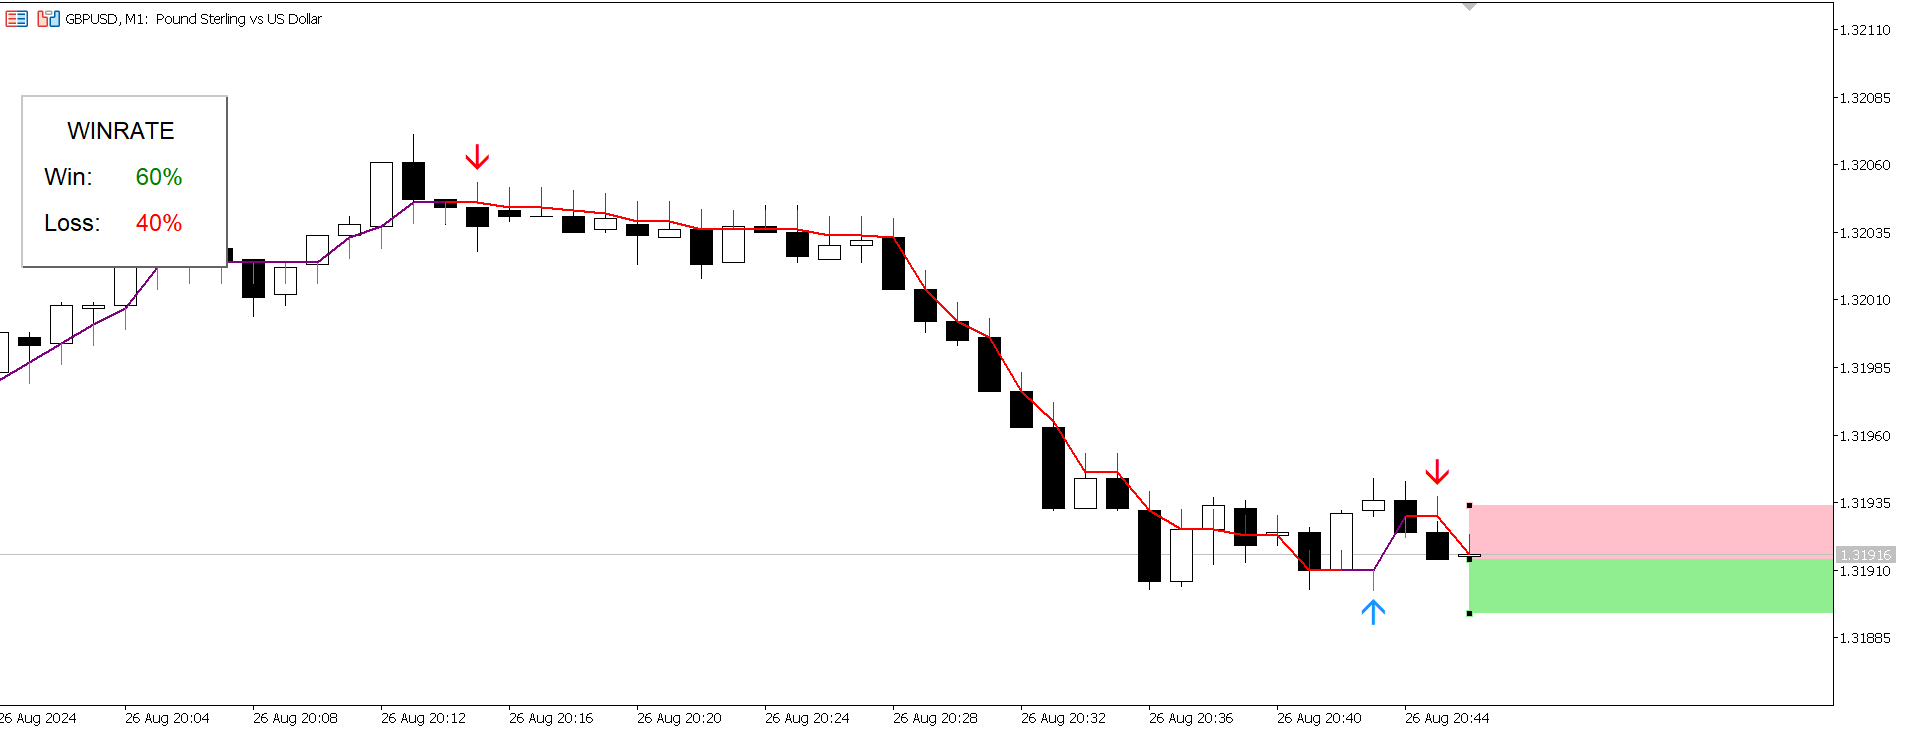
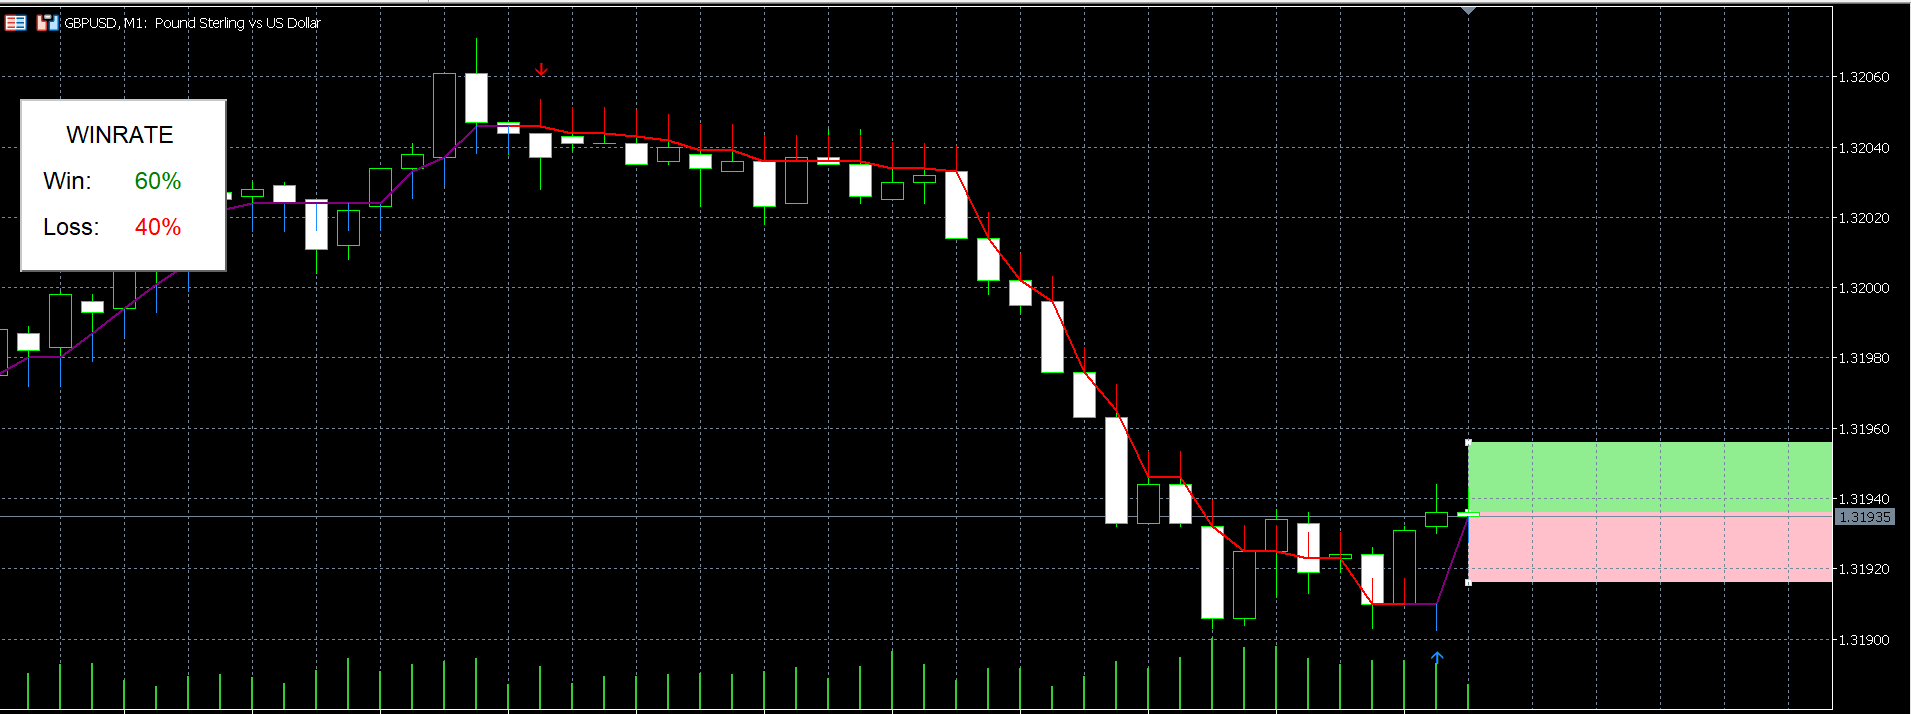
매우 명확한 신호: 혼란스러운 차트 어수선함과 작별하세요. Trade Sniper는 차트에서 바로 명확하고 실행 가능한 매수 및 매도 신호를 제공합니다.
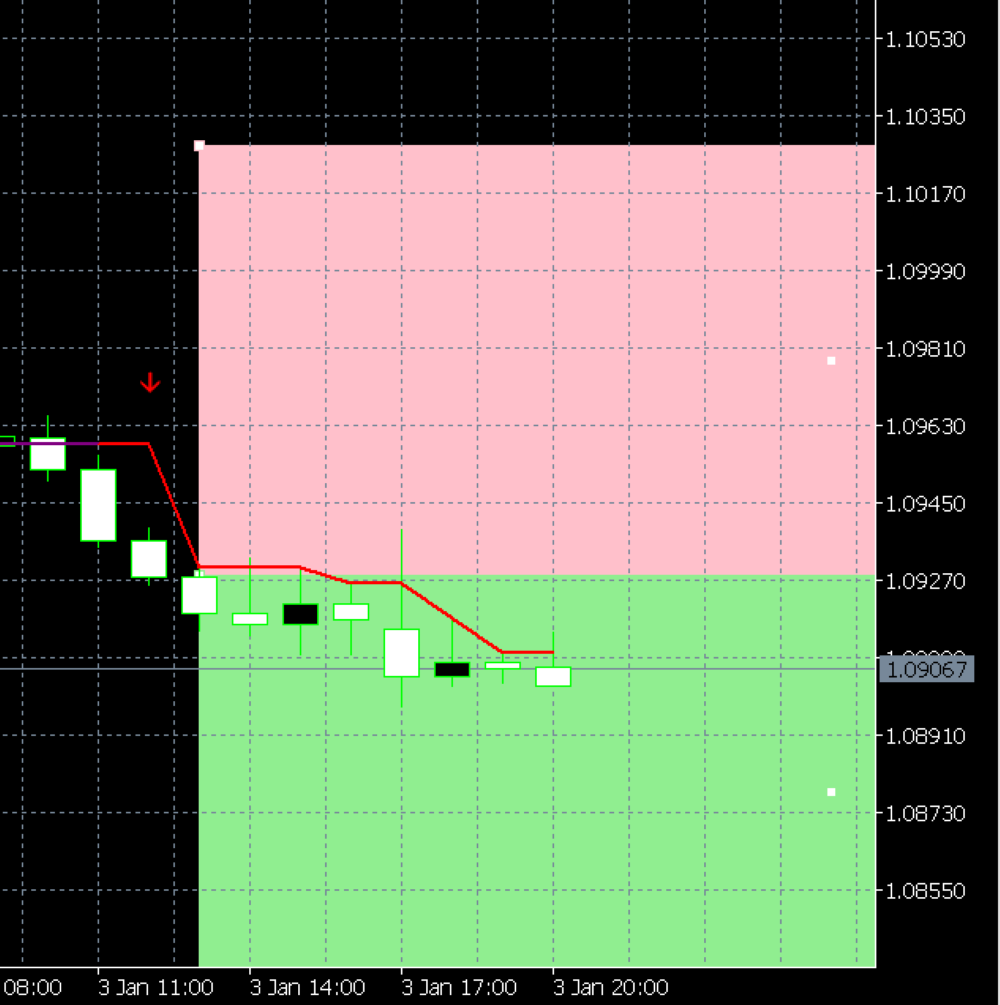
스마트 위험 관리: 혁신적인 위험/보상 상자는 잠재적인 수익 및 손실 영역을 시각적으로 표시하여 거래 전략에 맞춰 정보에 입각한 결정을 내리는 데 도움이 됩니다.
적응형 기술: Trade Sniper의 AIgo는 시장 상황을 보여 주므로 끊임없이 변화하는 시장에서도 성능이 뛰어난 상태를 유지합니다.
사용자 친화적 인터페이스: 고급 기술에도 불구하고 Trade Sniper는 사용하기 매우 쉽습니다. 초보 거래자와 노련한 전문가 모두에게 적합합니다.
성과 추적기: 내장된 승/패 비율 디스플레이로 매개변수 거래의 성공 여부를 파악하여 거래 결정에 자신감을 가질 수 있습니다.
사용자 정의 알림: 잠재적인 설정을 알려주는 사용자 정의 알림으로 다시는 거래 기회를 놓치지 마세요.
Trade Sniper는 단순한 지표가 아닙니다. 거래 파트너입니다. 시장을 끊임없이 분석하여 위험을 관리하면서 수익성 있는 기회를 식별하는 데 도움이 됩니다.

빠른 스캘핑을 원하는 데이 트레이더이든 더 큰 움직임을 목표로 하는 스윙 트레이더이든 Trade Sniper는 귀하의 스타일에 맞게 조정됩니다. 마치 전문 분석가 팀이 24시간 내내 일하며 복잡한 시장 데이터를 명확하고 실행 가능한 정보로 정제하는 것과 같습니다.

또 다른 수익성 있는 거래를 손에서 놓치게 하지 마세요. Trade Sniper로 무장하고 프로의 자신감과 정확성으로 거래를 시작하세요. 보다 일관되고 수익성 있는 거래를 위한 여정은 여기에서 시작됩니다!

오늘 Trade Sniper로 거래 무기고를 업그레이드하세요. 거래가 거래의 우수성을 만나는 곳입니다!

기여 개발자 Victor Chukwudumebi Ovorakpor - victorovorakpor - 거래자 프로필 - MQL5 Algo Trading 커뮤니티
추천 제품
Color Histogram Volume Set
Ricardo Almeida Branco
Do you use volume in your reading of the market? Certainly many traders use it, and do not imagine operating without it. The Color Histogram Volume Set indicator allows the user to choose the value that he considers interesting to monitor. When you pass this you will have visual confirmation and if you want you will also have the audible alert that is given by the indicator. Of course, there are other ways to try to find a high volume, such as assessing whether the volume
Value Chart Candlesticks
Flavio Javier Jarabeck
4.75 (8)
The idea of a Value Chart indicator was presented in the very good book I read back in 2020 , " Dynamic Trading Indicators: Winning with Value Charts and Price Action Profile ", from the authors Mark Helweg and David Stendahl. The idea is simple and the result is pure genius: Present candlestick Price analysis in a detrended way! HOW TO READ THIS INDICATOR Look for Overbought and Oversold levels. Of course, you will need to test the settings a lot to find the "correct" one for your approach.
FREE
A countdown timer for the  Volume bar chart generator  and  Tick chart generator  products, which are available for download from the MQL5 Market: Tick chart generator: https://www.mql5.com/en/market/product/29215 Volume bar chart generator: https://www.mql5.com/en/market/product/47197 The counter conveniently displays the number of ticks or transactions (depending on the chart) that need to pass for a new bar to start printing. The user can set the following indicator inputs. Volume type
FREE
Blahtech Market Profile MT5
Blahtech Limited
5 (9)
Was: $249  Now: $99   Market Profile defines a number of day types that can help the trader to determine market behaviour. A key feature is the Value Area, representing the range of price action where 70% of trading took place. Understanding the Value Area can give traders valuable insight into market direction and establish the higher odds trade. It is an excellent addition to any system you may be using. Inspired by Jim Dalton’s book “Mind Over Markets”, this indicator is designed to suit the
Mt5 Market Profile
Mcblastus Gicharu Ndiba
Market Profile Introducing the Market Profile MetaTrader Indicator—your gateway to mastering market dynamics with precision and insight. This powerful tool delivers a classic Market Profile analysis, revealing price density over time and highlighting crucial levels, including the value area and control value for any trading session.  Compatible with timeframes from M1 to D1, it adapts to daily, weekly, monthly, or even intraday sessions, offering you unmatched flexibility. Lower timeframes pro
Aggression Volume
Flavio Javier Jarabeck
4.14 (14)
Aggression Volume Indicator is the kind of indicator that is rarely found in the MQL5 community because it is not based on the standard Volume data provided by the Metatrader 5 platform. It requires the scrutiny of all traffic Ticks requested on the platform... That said, Aggression Volume indicator requests all Tick Data from your Broker and processes it to build a very special version of a Volume Indicator, where Buyers and Sellers aggressions are plotted in a form of Histogram. Additionally,
FREE
Waves Sizer
Flavio Javier Jarabeck
3.4 (5)
Wyckoff fans, enjoy! Ideally to be used with the Weis Waves indicator, but it can be easily used alone, the Waves Sizer puts the range (in resulting Price movement) done by the Price on its market swings. You can control how accurate or loose will be the swings. This tool is very helpful for visually know how much the Price has traveled in your Timeframe. This way you can confront this level of effort with the resulting Volume, etc... Weis Waves indicator: https://www.mql5.com/en/market/pro
FREE
CVD SmoothFlow Pro
Thalles Nascimento De Carvalho
CVD SmoothFlow Pro - 모든 자산에 대한 무제한 볼륨 분석! CVD SmoothFlow Pro 는 정밀하고 무제한의 볼륨 분석을 원하는 트레이더를 위한 최적의 솔루션입니다. Cumulative Volume Delta (CVD) 계산과 고급 노이즈 필터링을 활용하여, Pro 버전은 모든 금융 자산 거래에 필요한 유연성과 정확성을 제공합니다. CVD SmoothFlow Pro가 제공하는 기능: 명확한 분석 : 시장 노이즈를 필터링하고 모든 금융 자산에서 중요한 볼륨 변동을 강조합니다. ️ 정확한 계산 : 매수와 매도 차이를 모니터링하여 외환, 지수, 암호화폐 등 자산의 볼륨 행동을 상세히 제공합니다. 직관적인 인터페이스 : 데이터가 명확하게 제시되어 분석이 쉽고 효율적입니다. 트렌드 식별 : 시장 트렌드를 자신 있게 식별하여 정보에 기반한 결정을 지원합니다. 실용적인 적용: 모든 자산의 실시간 매수자와 매도자 균형을 모니터링합니다. 볼륨을 기반
BoxChart MT5
Evgeny Shevtsov
5 (7)
The market is unfair if only because 10% of participants manage 90% of funds. An ordinary trader has slim changes to stand against these "vultures". This problem can be solved. You just need to be among these 10%, learn to predict their intentions and move with them. Volume is the only preemptive factor that faultlessly works on any timeframe and symbol. First, the volume appears and is accumulated, and only then the price moves. The price moves from one volume to another. Areas of volume accumu
Weis Waves
Flavio Javier Jarabeck
2.76 (17)
The original author is David Weis, an expert in the Wyckoff Method. The Weis Wave is a modern adaptation of the 1930's Wyckoff Method, another expert in Tape Reading techniques and Chart Analysis. Weis Waves takes market volume and stacks it into waves according to price conditions giving the trader valuable insights about the market conditions. If you want to learn more about this subject you can find tons of videos in YouTube. Just look for "The Wickoff Method", "Weis Wave" and "Volume Spread
FREE
Wapv Price and volume
Eduardo Da Costa Custodio Santos
MT5용 WAPV 가격 및 거래량 표시기는 (Wyckoff Academy Wave Market) 및 (Wyckoff Academy Price and Volume) 도구 세트의 일부입니다. MT5용 WAPV 가격 및 거래량 표시기는 차트에서 거래량 움직임을 직관적인 방식으로 쉽게 시각화할 수 있도록 만들어졌습니다. 그것으로 당신은 최대 거래량의 순간과 시장이 전문적인 관심을 갖지 않는 순간을 관찰할 수 있습니다 시장이 "스마트 머니"의 움직임이 아니라 관성에 의해 움직이는 순간을 식별합니다. 사용자가 수정할 수 있는 4가지 색상으로 구성되어 있습니다. 빨간색 = 제안 증가 녹색 = 수요 증가 회색 양초 = 수요와 공급의 감소 파란색 = 스마트머니 연기 위쪽 방향으로의 움직임은 강도를 나타냅니다. 하향 움직임 약점을 나타냅니다. Price의 방향에 상관없이 가장 강한 Volume이 올라가야 합니다. R. Wyckoff의 이론에 따라 생성된 지표
BoxInside MT5
Evgeny Shevtsov
5 (3)
This indicator calculates the volume profile and places labels that correspond to the VAH, VAL and POC levels, for each candle individually. Indicator operation features The indicator works on the timeframes from M3 to MN, but it uses the history data of smaller periods: M1 - for periods from M3 to H1, M5 - for periods from H2 to H12, M30 - for the D1 period, H4 - for the W1 period, D1 - for the MN period. The color and location of the VAL, VAH and POC labels on the current candle are consider
FREE
Stackable VWAP
Flavio Javier Jarabeck
3.5 (4)
Volume Weighted Average Price (VWAP) is a trading benchmark commonly used by Big Players that gives the average price a Symbol has traded throughout the day. It is based on both Volume and price. Additionally we put in this indicator the MVWAP (Moving Volume Weighted Average Price). For those who do not know the usage and the importance od this indicator I recommend a great article about this subject at Investopedia ( https://www.investopedia.com/articles/trading/11/trading-with-vwap-mvwap.asp
FREE
This z-score indicator shows the correct z-score of an asset, as it uses the normalized price data for calculation, which is the only correct way. Z-score is only applicable for normal distributed data, therefore not the actual price is considered, but the normalised returns, which were assumed to follow a normal distribution. Returns are mean reverting and assumed to follow a normal distribution, therefore z-score calculation of returns is more reliable than z-score on price, as price is NOT m
Market Marker MT5
Evgeny Shevtsov
3.8 (5)
The indicator displays peak levels of activity formed by the maximum volume, tracks the correlation of the candles on all timeframes (from the highest to the lowest one). Each volume level is a kind of key trading activity. The most important cluster is inside a month, week, day, hour, etc. Indicator operation features A volume level receives Demand status if the nearest volume level located to the left and above has been broken upwards. A volume level receives Supply status if the nearest vol
Volumes Direction MT5
William Oswaldo Mayorga Urduy
볼륨 방향 MT5 일반적으로 현재 볼륨이 이전 볼륨보다 높을 때 볼륨 표시기의 기본 색상 변경이 있습니다. 중요하지만 그다지 유용하지는 않습니다. 이러한 이유로 이 지표는 정상적인 볼륨 외에도 양초가 강세 또는 약세일 때 다른 색상으로 칠하도록 만들어졌습니다. 기본적으로 강세는 파란색이고 약세는 빨간색이지만 이러한 색상은 사용자 정의할 수 있습니다. 상인의 취향. 귀하의 거래를 개선하는 데 도움이 될 다른 지표를 확인하는 것을 잊지 마십시오. 볼륨 방향 MT5 일반적으로 현재 볼륨이 이전 볼륨보다 높을 때 볼륨 표시기의 기본 색상 변경이 있습니다. 중요하지만 그다지 유용하지는 않습니다. 이러한 이유로 이 지표는 정상적인 볼륨 외에도 양초가 강세 또는 약세일 때 다른 색상으로 칠하도록 만들어졌습니다. 기본적으로 강세는 파란색이고 약세는 빨간색이지만 이러한 색상은 사용자 정의할 수 있습니다. 상인의 취향. 귀하의 거래를 개선하는 데 도움이 될 다른
Introduction to Chart Pattern MT Chart Pattern MT is a chart pattern scanner to detect the triangle pattern, falling wedge pattern, rising wedge pattern, channel pattern and so on. Chart Pattern MT uses highly sophisticated chart pattern detection algorithm. However, we have designed it in the easy to use with intuitive user interface. Chart Pattern MT will show all the patterns in your chart in the most efficient format for your trading. You do not have to do tedious manual pattern detection an
Description The indicator uses market profile theory to show the most relevant trading zones, on a daily basis. The zones to be shown are LVN (low volume nodes) and POC (point of control). An LVN zone is one which represents price areas with the least time or volume throughout the day. Typically, these areas indicate a supply or demand initiative, and in the future, they can turn into important breakout or retracement zones. A POC zone is one which represents price areas with the most time or vo
Gioteen Volatility Index (GVI) - your ultimate solution to overcoming market unpredictability and maximizing trading opportunities. This revolutionary indicator helps you in lowering your losing trades due to choppy market movements. The GVI is designed to measure market volatility, providing you with valuable insights to identify the most favorable trading prospects. Its intuitive interface consists of a dynamic red line representing the volatility index, accompanied by blue line that indicate
VWAP Indicator
LUC JACOBUS A VERHEECKE
4.13 (23)
Volume Weighted Average Price (VWAP) The volume weighted average price (VWAP) is a  trading   benchmark  used by traders that gives the average price a security has traded at throughout the day, based on both volume and price. It is important because it provides traders with insight into both the trend and value of a security. This indicator VWAP V2 is free and is the manual version of the extended Easy VWAP indicator (30 Euro), where the date and time properties are automatically entered. With
FREE
MIDAS Super VWAP
Flavio Javier Jarabeck
4.44 (9)
Imagine VWAP, MVWAP and MIDAS in one place... Well, you found it! Now you can track the movement of Big Players in various ways, as they in general pursue the benchmarks related to this measuring, gauging if they had good execution or poor execution on their orders. Traders and analysts use the VWAP to eliminate the noise that occurs throughout the day, so they can measure what prices buyers and sellers are really trading. VWAP gives traders insight into how a stock trades for that day and deter
FREE
Blahtech Supply Demand MT5
Blahtech Limited
4.54 (13)
Was: $299  Now: $99   Supply Demand uses previous price action to identify potential imbalances between buyers and sellers. The key is to identify the better odds zones, not just the untouched ones. Blahtech Supply Demand indicator delivers functionality previously unavailable on any trading platform. This 4-in-1 indicator not only highlights the higher probability zones using a multi-criteria strength engine, but also combines it with multi-timeframe trend analysis, previously confirmed swings
이 표시기의 고유성은 거래량 계산 알고리즘에 있습니다. 누적은 하루의 시작을 참조하지 않고 선택한 기간 동안 직접 발생합니다. 마지막 막대는 계산에서 제외할 수 있습니다. 그러면 현재 데이터가 이전에 형성된 중요한 수준(볼륨)에 미치는 영향이 줄어듭니다. 보다 정확한 계산을 위해 기본적으로 M1 그래프의 데이터가 사용됩니다. 가격 볼륨의 분배 단계가 규제됩니다. 기본적으로 디스플레이의 오른쪽 테두리는 분석에 사용된 데이터의 시작 부분에 해당하는 막대로 설정되어 있지만, 필요한 경우 필요한 막대로 설정할 수 있습니다. 표시된 볼륨 밴드의 길이(오른쪽 테두리)는 계수에 의해 조절되며 왼쪽 또는 오른쪽으로 0(현재) 막대로 이동하거나 현재 막대를 참조하여 미러링할 수도 있습니다. 매개변수: Accumulation period - 부피 누적 계산 기간 Number of excluded last bars - 계산에서 제외된 마지막 막대의 수 Accumulation price step - 가격
No Demand No Supply MT5
Trade The Volume Waves Single Member P.C.
No Demand No Supply   This indicator identifies   No Demand –No Supply candles to your chart and plots volume bars colored according to the signal. It can be applied to all timeframes or to a specific one only. It can also be used as regular volume indicator  with exceptional future of WEIGHTED VOLUME. Furthermore is has an alert notification, sound and email when a signals occurs. The indicator does not repaint but the alert will come on two candles back due to the definition of No Demand No Su
Blahtech VWAP MT5
Blahtech Limited
5 (1)
Was: $69  Now: $34   Blahtech VWAP - Volume Weighted Average Price (VWAP) is the ratio of price to total volume. It provides an average price over a specified time interval.  Links [  Install  |  Update  |  Documentation   ] Feature Highlights Configurable VWAP Line Sessions, intervals, anchored or continuous Previous day settlement line Standard Deviation bands Alerts at bar close or real time Automatic Broker or Tick volumes Significantly reduced CPU usage Input Parameters Expert Advisor
Waves PRO
Flavio Javier Jarabeck
For those who appreciate Richard Wyckoff approach for reading the markets, we at Minions Labs designed a tool derived - yes, derived, we put our own vision and sauce into this indicator - which we called Waves PRO . This indicator provides a ZigZag controlled by the market volatility (ATR) to build its legs, AND on each ZigZag leg, we present the vital data statistics about it. Simple and objective. This indicator is also derived from the great book called " The Secret Science of Price and Volum
PZ Penta O MT5
PZ TRADING SLU
The Penta-O is a 6-point retracement harmonacci pattern which usually precedes big market movements. Penta-O patterns can expand and repaint quite a bit. To make things easier this indicator implements a twist: it waits for a donchian breakout in the right direction before signaling the trade. The end result is an otherwise repainting indicator with a very reliable trading signal. The donchian breakout period is entered as an input. [ Installation Guide | Update Guide | Troubleshooting | FAQ | A
Moving VVC mt5
Andriy Sydoruk
The   Visual Volatility Clustering   indicator clusters the market based on volatility. The indicator does not redraw and gives accurate data, does not use closing prices. Uses the opening prices or the highs or lows of the previous completed bar. Therefore, all information will be clear and unambiguous. The essence of the indicator is to divide the price market into certain areas according to a similar type of volatility. This can be done in any way. In this example, the indicator is configure
BoxProfile MT5
Evgeny Shevtsov
4.5 (8)
The indicator displays volume profiles based on the nesting principle. Profiles periods are pre-set so that each subsequent profile has a length twice as long as the length of the previous profile. In addition to profiles, the indicator displays volume clusters sorted by color, depending on the volume they contain. Indicator operation features The indicator works on typical timeframes from M5 to MN, but for calculations uses historical data from smaller timeframes: M1 - for timeframes from M5
FREE
VP hidden
Emr Aljnaby
4 (6)
The indicator works to convert normal volume into levels and determine financial liquidity control points. It is very similar in function to Fixed Volume Profile. But it is considered more accurate and easier to use than the one found on Trading View because it calculates the full trading volumes in each candle and in all the brokers present in MetaTrade, unlike what is found in Trading View, as it only measures the broker’s displayed prices. To follow us on social media platforms: tel
FREE
이 제품의 구매자들이 또한 구매함
TPSpro RFI Levels MT5
Roman Podpora
4.73 (11)
지침         러시아   -        영어       표시기와 함께 사용하는 것이 좋습니다   .       -       TPSpro   트렌드 프로 -   MT4 버전         거래에서 핵심 요소는 거래 상품을 매수 또는 매도하기로 결정하는 구역 또는 수준입니다. 주요 업체가 시장에서 자신의 존재를 숨기려는 시도에도 불구하고, 그들은 필연적으로 흔적을 남깁니다. 우리의 과제는 이러한 흔적을 식별하고 올바르게 해석하는 방법을 배우는 것이었습니다. 주요 기능:: 판매자와 구매자를 위한 활성 영역을 표시합니다! 이 지표는 매수 및 매도를 위한 모든 올바른 초기 임펄스 레벨/존을 보여줍니다. 진입점 검색이 시작되는 이러한 레벨/존이 활성화되면 레벨의 색상이 바뀌고 특정 음영으로 채워집니다. 또한 상황을 보다 직관적으로 이해하기 위해 화살표가 나타납니다. 더 높은 시간대의 레벨/존 표시(MTF 모드) 더 높은 시간 간격을 사용하여 레벨/존을 표시하는 기능을 추가했습니다.
TPSproTREND PrO MT5
Roman Podpora
4.89 (9)
TPSpro TREND PRO  - is a trend indicator that automatically analyzes the market and provides information about the trend and each of its changes, as well as giving signals for entering trades without redrawing! The indicator uses each candle, analyzing them separately. referring to different impulses - up or down impulse. Exact entry points into transactions for currencies, crypto, metals, stocks, indices!  Version MT4               DETAILED DESCRIPTION               R ecommended to use with an
Atbot
Zaha Feiz
4.97 (34)
AtBot: 작동 방식 및 사용 방법 ### 작동 방식 MT5 플랫폼용 "AtBot" 지표는 기술 분석 도구의 조합을 사용하여 매수 및 매도 신호를 생성합니다. 01:37 단순 이동 평균(SMA), 지수 이동 평균(EMA), 평균 진폭 범위(ATR) 지수를 통합하여 거래 기회를 식별합니다. 또한 Heikin Ashi 캔들을 사용하여 신호의 정확성을 향상시킬 수 있습니다. 구매 후 리뷰를 남기면 특별 보너스 선물을 받게 됩니다. ### 주요 기능: - 비재표시: 신호는 플로팅 후 변경되지 않습니다. - 비재작성: 신호는 일관되며 변경되지 않습니다. - 지연 없음: 지연 없이 시기적절한 신호를 제공합니다. - 다양한 시간대: 거래 전략에 맞게 모든 시간대에서 사용할 수 있습니다. ### 운영 단계: #### 입력 및 설정: - firstkey (TrendValue): 추세 감지의 민감도를 조정합니다. - Secondkey (SignalValue): 매수/매도 신호 생성의 민감도를 정의
Gold Stuff mt5
Vasiliy Strukov
4.92 (165)
Gold Stuff mt5는 금을 위해 특별히 설계된 추세 지표이며 모든 금융 상품에서도 사용할 수 있습니다. 표시기가 다시 그려지지 않고 지연되지 않습니다. 권장 기간 H1. 설정 및 개인 보너스를 받으려면 구매 후 즉시 저에게 연락하십시오!     강력한 지원 및 트렌드 스캐너 표시기의 무료 사본을 받으실 수 있습니다. 메시지를 보내주세요. 나!   설정 화살표 그리기 - 켜기 끄기. 차트에 화살표 그리기. 경고 - 가청 경고를 끕니다. 이메일 알림 - 켜기 끄기. 이메일 알림. Puch-notification - 켜기 끄기. 푸시 알림. 다음으로 색 영역을 조정합니다. Gold Stuff mt5는 금을 위해 특별히 설계된 추세 지표이며 모든 금융 상품에서도 사용할 수 있습니다. 표시기가 다시 그려지지 않고 지연되지 않습니다. 권장 기간 H1. 설정 및 개인 보너스를 받으려면 구매 후 즉시 저에게 연락하십시오!   설정 화살표 그리기 - 켜기 끄기. 차트에
우선 이 거래 시스템이 리페인팅, 리드로잉 및 레이그 인디케이터가 아니라는 점을 강조하는 것이 중요합니다. 이는 수동 및 로봇 거래 모두에 이상적인 것으로 만듭니다. 온라인 강좌, 설명서 및 프리셋 다운로드. "스마트 트렌드 트레이딩 시스템 MT5"은 새로운 및 경험이 풍부한 트레이더를 위해 맞춤형으로 제작된 종합적인 거래 솔루션입니다. 10개 이상의 프리미엄 인디케이터를 결합하고 7개 이상의 견고한 거래 전략을 특징으로 하여 다양한 시장 조건에 대한 다목적 선택이 가능합니다. 트렌드 추종 전략: 효과적인 트렌드 추이를 타기 위한 정확한 진입 및 손절 관리를 제공합니다. 반전 전략: 잠재적인 트렌드 반전을 식별하여 트레이더가 범위 시장을 활용할 수 있게 합니다. 스캘핑 전략: 빠르고 정확한 데이 트레이딩 및 단기 거래를 위해 설계되었습니다. 안정성: 모든 인디케이터가 리페인팅, 리드로잉 및 레이그가 아니므로 신뢰할 수 있는 신호를 보장합니다. 맞춤화: 개별 거래 선호도를 고려한 맞춤
Atomic Analyst MT5
Issam Kassas
4.42 (19)
우선적으로 언급할 점은이 거래 지표가 다시 그리지 않고 지연되지 않으며 이를 통해 수동 및 로봇 거래 모두에 이상적이라는 점입니다. 사용자 매뉴얼: 설정, 입력 및 전략. Atomic Analyst는 가격의 강도와 모멘텀을 활용하여 시장에서 더 나은 이점을 찾는 PA Price Action Indicator입니다. 고급 필터를 장착하여 잡음과 거짓 신호를 제거하고 거래 잠재력을 높이는 데 도움이 됩니다. 복잡한 지표의 다중 레이어를 사용하여 Atomic Analyst는 차트를 스캔하고 복잡한 수학적 계산을 간단한 신호와 색상으로 변환하여 초보 트레이더가 이해하고 일관된 거래 결정을 내릴 수 있도록합니다. "Atomic Analyst"는 새로운 및 경험이 풍부한 트레이더를위한 종합적인 거래 솔루션입니다. 프리미엄 지표와 최고 수준의 기능을 하나의 거래 전략에 결합하여 모든 종류의 트레이더에 대한 다재다능한 선택지가되었습니다. 인트라데이 거래 및 스캘핑 전략 : 빠르고 정확한
Trend Screener Pro MT5
STE S.S.COMPANY
4.87 (63)
트렌드 표시기, 트렌드 트레이딩 및 필터링을 위한 획기적인 고유 솔루션, 하나의 도구 안에 내장된 모든 중요한 트렌드 기능! Forex, 상품, 암호 화폐, 지수 및 주식과 같은 모든 기호/도구에 사용할 수 있는 100% 다시 칠하지 않는 다중 시간 프레임 및 다중 통화 표시기입니다. Trend Screener는 차트에 점이 있는 화살표 추세 신호를 제공하는 효율적인 지표 추세 추종 지표입니다. 추세 분석기 표시기에서 사용할 수 있는 기능: 1. 트렌드 스캐너. 2. 최대 이익 분석이 있는 추세선. 3. 추세 통화 강도 측정기. 4. 경고가 있는 추세 반전 점. 5. 경고가 있는 강력한 추세 점. 6. 추세 화살표 Trend Screener Indicator가 있는 일일 분석 예, 일일 신호 성능...등은 여기에서 찾을 수 있습니다. 여기를 클릭하십시오. LIMITED TIME OFFER : Trend Screener Indicator는 50$ 및 평생 동안만 사용할 수 있습니다
우선적으로, 이 거래 도구는 전문적인 거래에 이상적인 비-다시 그리기 및 지연되지 않는 지표입니다.  온라인 강좌, 사용자 매뉴얼 및 데모. 스마트 가격 액션 컨셉트 인디케이터는 신규 및 경험 많은 트레이더 모두에게 매우 강력한 도구입니다. Inner Circle Trader Analysis 및 Smart Money Concepts Trading Strategies와 같은 고급 거래 아이디어를 결합하여 20가지 이상의 유용한 지표를 하나로 결합합니다. 이 인디케이터는 스마트 머니 컨셉트에 중점을 두어 대형 기관의 거래 방식을 제공하고 이동을 예측하는 데 도움을 줍니다.  특히 유동성 분석에 뛰어나 기관이 어떻게 거래하는지 이해하는 데 도움을 줍니다. 시장 트렌드를 예측하고 가격 변동을 신중하게 분석하는 데 탁월합니다. 귀하의 거래를 기관 전략에 맞추어 시장의 동향에 대해 더 정확한 예측을 할 수 있습니다. 이 인디케이터는 시장 구조를 분석하고 중요한 주문 블록을 식별하
Quantum Trend Sniper
Bogdan Ion Puscasu
4.8 (49)
소개       Quantum Trend Sniper Indicator는   추세 반전을 식별하고 거래하는 방식을 변화시키는 획기적인 MQL5 지표입니다! 13년 이상의 거래 경험을 가진 숙련된 트레이더 팀이 개발한       Quantum Trend Sniper 표시기       매우 높은 정확도로 추세 반전을 식별하는 혁신적인 방법으로 거래 여정을 새로운 차원으로 끌어올리도록 설계되었습니다. ***Quantum Trend Sniper Indicator를 구입하면 Quantum Breakout Indicator를 무료로 받을 수 있습니다!*** Quantum Trend Sniper Indicator는 추세 반전을 식별하고 세 가지 이익실현 수준을 제안할 때 경고, 신호 화살표를 제공합니다. 초보자 거래자와 전문 거래자 모두에게 적합합니다. Quantum EA 채널:       여기를 클릭하세요 MT4 버전:       여기를 클릭하세요
TrendMaestro5
Stefano Frisetti
note: this indicator is for METATRADER4, if you want the version for METATRADER5 this is the link:  https://www.mql5.com/it/market/product/108106 TRENDMAESTRO ver 2.4 TRENDMAESTRO recognizes a new TREND in the bud, he never makes mistakes. The certainty of identifying a new TREND is priceless. DESCRIPTION TRENDMAESTRO identifies a new TREND in the bud, this indicator examines the volatility, volumes and momentum to identify the moment in which there is an explosion of one or more of these data a
이 대시보드는 선택한 심볼에 대해 사용 가능한 최신 고조파 패턴을 표시하므로 시간을 절약하고 더 효율적으로 사용할 수 있습니다 /   MT4 버전 . 무료 인디케이터:   Basic Harmonic Pattern 인디케이터 열 Symbol :   선택한 심볼이 나타납니다 Trend :   강세 또는 약세 Pattern :   패턴 유형(가틀리, 나비, 박쥐, 게, 상어, 사이퍼 또는 ABCD) Entry :   진입 가격 SL:   스톱로스 가격 TP1:   1차 테이크프로핏 가격 TP2:   2차 테이크프로핏 가격 TP3:   3차 테이크프로핏 가격 Current price:   현재 가격 Age (in bars):   마지막으로 그려진 패턴의 나이 주요 입력 Symbols :   "28개 주요 통화쌍" 또는 "선택한 심볼" 중에서 선택합니다. Selected Symbols :   쉼표로 구분하여 모니터링하려는 원하는 심볼("EURUSD,GBPUSD,XAUUSD")
FX Power MT5 NG
Daniel Stein
5 (5)
모닝 브리핑 여기 mql5 와 텔레그램에서 FX Power MT5 NG 는 오랫동안 인기 있는 통화 강도 측정기인 FX Power의 차세대 버전입니다. 이 차세대 강도 측정기는 무엇을 제공합니까? 기존 FX Power에서 좋아했던 모든 것 PLUS GOLD/XAU 강도 분석 더욱 정밀한 계산 결과 개별 구성 가능한 분석 기간 더 나은 성능을 위한 사용자 정의 가능한 계산 한도 특별 멀티더 많은 것을보고 싶은 사람들을위한 특별한 다중 인스턴스 설정 모든 차트에서 좋아하는 색상을위한 끝없는 그래픽 설정 수많은 알림 옵션, 중요한 것을 다시는 놓치지 않도록 Windows 11 및 macOS 스타일의 둥근 모서리가 있는 새로운 디자인 마법처럼 움직이는 인디케이터 패널 FX 파워 키 특징 모든 주요 통화의 완전한 강세 이력 모든 시간대에 걸친 통화 강세 이력 모든 브로커 및 차트에서 고유 계산 결과 100% 신뢰할 수있는 실시간100 % 신뢰할 수있는 실시간 계산-> 다시 칠하지 않음
The 1 2 3 Pattern Scanner MT5
Reza Aghajanpour
5 (18)
** All Symbols x All Timeframes scan just by pressing scanner button ** *** Contact me  to send you instruction and add you in "123 scanner group" for sharing or seeing experiences with other users. After 17 years of experience in the markets and programming, Winner indicator is ready. I would like to share with you! Introduction The 123 Pattern Scanner indicator with a special enhanced algorithm is a very repetitive common pattern finder with a high success rate . Interestingly, this Winner in
IX Power MT5
Daniel Stein
4.17 (6)
IX Power는   마침내 FX Power의 탁월한 정밀도를 외환이 아닌 기호에도 적용했습니다. 좋아하는 지수, 주식, 원자재, ETF, 심지어 암호화폐까지 단기, 중기, 장기 추세의 강도를 정확하게 파악할 수 있습니다. 단말기가 제공하는   모든 것을 분석할   수 있습니다. 사용해 보고 트레이딩   타이밍이 크게 향상되는   것을 경험해 보세요. IX Power 주요 특징 단말기에서 사용 가능한 모든 거래 심볼에 대해 100% 정확한 비재도장 계산 결과 제공 사전 구성 및 추가적으로 개별 구성 가능한 강도 분석 기간의 드롭다운 선택 가능 이메일, 메시지, 모바일 알림을 통한 다양한 알림 옵션 제공 EA 요청을 위한 액세스 가능한 버퍼 더 나은 성능을 위한 사용자 지정 가능한 계산 한도 더 많은 것을 보고 싶은 사용자를 위한 특별 다중 인스턴스 설정 모든 차트에서 좋아하는 색상을 위한 무한한 그래픽 설정 가능 Windows 11 및 macOS 스타일의 둥
Auto Order Block with break of structure based on ICT and Smart Money Concepts (SMC) Futures Break of Structure ( BoS )             Order block ( OB )            Higher time frame Order block / Point of Interest ( POI )    shown on current chart           Fair value Gap ( FVG ) / Imbalance   -  MTF      ( Multi Time Frame )    HH/LL/HL/LH  -  MTF      ( Multi Time Frame )  Choch  MTF      ( Multi Time Frame )  Volume Imbalance     ,  MTF          vIMB Gap’s Power of 3 Equal High
Matrix Arrow Indicator MT5
Juvenille Emperor Limited
5 (12)
매트릭스 화살표 표시기 MT5 는 외환, 상품, 암호 화폐, 지수, 주식과 같은 모든 기호/도구에 사용할 수 있는 100% 다시 칠하지 않는 다중 기간 표시기를 따르는 고유한 10 in 1 추세입니다.  Matrix Arrow Indicator MT5 는 다음과 같은 최대 10개의 표준 지표에서 정보와 데이터를 수집하여 초기 단계에서 현재 추세를 결정합니다. 평균 방향 이동 지수(ADX) 상품 채널 지수(CCI) 클래식 하이켄 아시 캔들 이동 평균 이동 평균 수렴 발산(MACD) 상대 활력 지수(RVI) 상대 강도 지수(RSI) 포물선 SAR 스토캐스틱 오실레이터 윌리엄스의 백분율 범위 모든 지표가 유효한 매수 또는 매도 신호를 제공하면 강력한 상승/하락 추세를 나타내는 다음 캔들/막대가 시작될 때 해당 화살표가 차트에 인쇄됩니다. 사용자는 사용할 표시기를 선택하고 각 표시기의 매개변수를 개별적으로 조정할 수 있습니다. 매트릭스 화살표 표시기 MT5는 선택한 표시기에서만 정보를 수
Entry Points Pro for MT5
Yury Orlov
4.46 (124)
다시 색을 칠하지 않고 거래에 진입할 수 있는 정확한 신호를 제공하는 MT5용 지표입니다. 외환, 암호화폐, 금속, 주식, 지수 등 모든 금융 자산에 적용할 수 있습니다. 매우 정확한 추정값을 제공하고 매수와 매도의 가장 좋은 시점을 알려줍니다. 하나의 시그널로 수익을 내는 지표의 예와 함께 비디오 (6:22)시청하십시오! 대부분의 거래자는 Entry Points Pro 지표의 도움으로 첫 거래 주 동안 트레이딩 결과를 개선합니다. 저희의   Telegram Group 을 구독하세요! Entry Points Pro 지표의 좋은점. 재도색이 없는 진입 신호 신호가 나타나고 확인되면(시그널 캔들이 완성된 경우) 신호는 더 이상 사라지지 않습니다. 여타 보조지표의 경우 신호를 표시한 다음 제거되기 때문에 큰 재정적 손실로 이어집니다. 오류 없는 거래 게시 알고리즘을 통해 트레이드(진입 또는 청산)를 할 이상적인 순간을 찾을 수 있으며, 이를 통해 이를 사용하는 모든 거래자의
FxaccurateLS
Shiv Raj Kumawat
WHY IS OUR FXACCCURATE LS MT5 THE PROFITABLE ? PROTECT YOUR CAPITAL WITH RISK MANAGEMENT Gives entry, stop and target levels from time to time. It finds Trading opportunities by analyzing what the price is doing during established trends. POWERFUL INDICATOR FOR A RELIABLE STRATEGIES We have made these indicators with a lot of years of hard work. It is made at a very advanced level. Established trends provide dozens of trading opportunities, but most trend indicators completely ignore them!
AT Forex Indicator MT5
Marzena Maria Szmit
5 (3)
The AT Forex Indicator MT5 is a sophisticated trading tool designed to provide traders with a comprehensive analysis of multiple currency pairs. This powerful indicator simplifies the complex nature of the forex market, making it accessible for both novice and experienced traders. AT Forex Indicator uses advanced algorithms to detect trends, patterns and is an essential tool for traders aiming to enhance their forex trading performance. With its robust features, ease of use, and reliable signal
ICT, SMC, SMART MONEY CONCEPTS, SMART MONEY, Smart Money Concept, Support and Resistance, Trend Analysis, Price Action, Market Structure, Order Blocks, BOS/CHoCH,   Breaker Blocks ,  Momentum Shift,   Supply&Demand Zone/Order Blocks , Strong Imbalance,   HH/LL/HL/LH,    Fair Value Gap, FVG,  Premium  &   Discount   Zones, Fibonacci Retracement, OTE, Buy Side Liquidity, Sell Side Liquidity, BSL/SSL Taken, Equal Highs & Lows, MTF Dashboard, Multiple Time Frame, BigBar, HTF OB, HTF Market Structure
Advanced Supply Demand MT5
Bernhard Schweigert
4.5 (14)
현재 33% 할인! 초보자나 전문 트레이더를 위한 최고의 솔루션! 이 보조지표는 우리가 다수의 독창적 기능과 새로운 공식을 통합한 독특하고 고품질이며 저렴한 거래 도구입니다. 이 업데이트를 통해 이중 시간대를 표시할 수 있습니다. 더 높은 TF를 표시할 수 있을 뿐만 아니라 차트 TF와 더 높은 TF 모두를 표시할 수 있습니다: 중첩 영역 표시. 모든 Supply Demand 트레이더들이 좋아할 것입니다. :) 중요한 정보 공개 Advanced Supply Demand의 잠재력을 극대화하려면 다음을 방문하십시오. https://www.mql5.com/ko/blogs/post/720245   진입 또는 목표의 명확한 트리거 포인트를 정확히 찾아냄으로 해서 거래가 어떻게 개선될지 상상해 보십시오. 새로운 알고리즘을 기반으로 매수자와 매도자 간의 잠재적인 불균형을 훨씬 더 쉽게 분간할 수 있습니다. 왜냐하면 가장 강한 공급영역과 가장 강한 수요 영역과 과거에 어떻게 진행 되었는지를(이
TPA True Price Action indicator reveals the true price action of the market makers through 100% non-repainting signals strictly at the close of a candle! TPA shows entries and re-entries, every time the bulls are definitely stronger than the bears and vice versa. Not to confuse with red/green candles. The shift of power gets confirmed at the earliest stage and is ONE exit strategy of several. There are available now two free parts of the TPA User Guide for our customers. The first "The Basics"
XQ Indicator MetaTrader 5
Marzena Maria Szmit
3 (2)
Step into the realm of Forex trading with confidence and precision using XQ, a cutting-edge Forex indicator designed to elevate your trading game to unprecedented heights. Whether you're a seasoned trader or just stepping into the world of currency exchange, XQ Forex Indicator empowers you with the insights and signals needed to make informed trading decisions. The signal conditions are a combination of three indicators, and XQ Forex Indicator only display  medium and long-term trends . The ind
PZ Swing Trading MT5
PZ TRADING SLU
5 (4)
Protect against whipsaws: revolutionize your swing trading approach Special Offer: Purchase now to receive free bonuses worth $135! (Read more for details) Swing Trading is the first indicator designed to detect swings in the direction of the trend and possible reversal swings. It uses the baseline swing trading approach, widely described in trading literature. The indicator studies several price and time vectors to track the aggregate trend direction and detects situations in which the market i
Trade smarter, not harder: Empower your trading with Harmonacci Patterns Special Offer: Purchase now to receive free bonuses worth $165! (Read more for details) This is arguably the most complete harmonic price formation auto-recognition indicator you can find for the MetaTrader Platform. It detects 19 different patterns, takes fibonacci projections as seriously as you do, displays the Potential Reversal Zone (PRZ) and finds suitable stop-loss and take-profit levels. [ Installation Guide | Up
FX Volume MT5
Daniel Stein
4.93 (14)
모닝 브리핑을 통해 세부 정보와 스크린샷으로 매일 시장 업데이트를 받으세요 여기 mql5 및 텔레그램에서 FX 거래량은 브로커의 관점에서 시장 심리에 대한 실제 통찰력을 제공하는 최초이자 유일한 거래량 지표입니다. 브로커와 같은 기관 시장 참여자가 외환 시장에서 어떤 포지션을 취하고 있는지에 대한 훌륭한 통찰력을 COT 보고서보다 훨씬 빠르게 제공합니다. 차트에서 이 정보를 직접 확인하는 것은 트레이딩의 진정한 판도를 바꾸고 획기적인 솔루션입니다. 다음과 같은 고유한 시장 데이터 인사이트의 이점 비율 는 통화의 매수/매도 포지션 비율을 백분율로 표시 비율 변화 는 선택한 기간 내 매수 비율과 비율 변화를 표시 총 거래량 는 해당 통화의 총 거래량(롱 및 숏)을 로트 단위로 보여줍니다 Volumes Long 는 해당 통화의 모든 롱 포지션의 거래량을 보여줍니다 Volumes Short 는 해당 통화의 모든 숏 포지션의 거래량을 보여줍니다 Net Long 는 순 롱 포지션의 거래량
Noize Absorption Index
Ekaterina Saltykova
Noize Absorption Index - is the manual trading system that measures the difference of pressure between bears forces and bulls forces. Green line - is a noize free index that showing curent situation. Zero value of index shows totally choppy/flat market.Values above zero level shows how powerfull bullish wave is and values below zero measures bearish forces.Up arrow appears on bearish market when it's ready to reverse, dn arrow appears on weak bullish market, as a result of reverse expectation.
PZ Support Resistance MT5
PZ TRADING SLU
4.17 (6)
Unlock key market insights with automated support and resistance lines Special Offer: Purchase now to receive free bonuses worth $75! (Read more for details) Tired of plotting support and resistance lines? This is a multi-timeframe indicator that detects and plots supports and resistance lines in the chart with the same precision as a human eye would. As price levels are tested over time and its importance increases, the lines become thicker and darker, making price leves easy to glance and ev
Gold Trend 5
Sergei Linskii
5 (1)
금 추세 - 좋은 주식 기술 지표입니다. 인디케이터 알고리즘은 자산의 가격 움직임을 분석하고 변동성과 잠재적 진입 구간을 반영합니다. 최고의 지표 신호: - 매도 = 빨간색 히스토그램 + 빨간색 숏 포인터 + 같은 방향의 노란색 신호 화살표. - 매수 = 파란색 히스토그램 + 파란색 롱 포인터 + 같은 방향의 아쿠아 신호 화살표. 인디케이터의 장점 1. 표시기는 높은 정확도로 신호를 생성합니다. 2. 확인된 화살표 신호는 추세가 바뀔 때만 다시 그릴 수 있습니다. 3. 모든 브로커의 메타트레이더 5 거래 플랫폼에서 거래할 수 있습니다. 4. 모든 자산(통화, 금속, 암호화폐, 주식, 지수 등)을 거래할 수 있습니다. 5. H1 차트주기(중기 트레이딩)에서 거래하는 것이 좋습니다. 6. 지표 설정에서 개별 매개 변수(TF, 색상 등)를 변경할 수 있으므로 각 트레이더가 지표를 쉽게 사용자 지정할 수 있습니다. 7. 이 보조지표는 독립적인 트레이딩 시스템뿐만 아니
이 대시보드는 선택한 기호에 대한 거래 전략에 따라 스캘핑 모드와 장기 모드 모두에서 차트의 공급 및 수요 영역을 검색하고 표시합니다. 또한 대시보드의 스캐너 모드를 통해 원하는 모든 기호를 한눈에 확인하고 적합한 위치를 놓치지 않도록 도와줍니다 / MT4 버전 . 무료 보조지표:   Basic Supply Demand 특징 여러 통화쌍에 대한 거래 기회를 볼 수 있으며, 공급 및 수요 영역에 대한 근접성에 따라 순위가 매겨진 모든 쌍을 명확하고 간결하게 볼 수 있습니다. 색상부터 감지 매개변수까지 특정 요구에 맞게 사용자 지정 설정 가능 주요 입력 Indicator mode :   표시기 모드 또는 새로운 기능이 포함된 패널 모드 중에서 선택 가능 Symbols :   "28개 주요 통화쌍" 또는 "선택한 심볼" 중에서 선택 Selected Symbols :   쉼표로 구분하여 모니터링하려는 원하는 심볼("EURUSD, GBPUSD, XAUUSD")을 선택합
제작자의 제품 더 보기
HFTHackerMT5
Thomas Bradley Butler
5 (2)
신호: 내 프로필의 HFT Hacker 링크 *테스트 및 사용 전에 EA를 최적화하세요. 최적화된 경우에만 구매하세요. 이는 최적화 방법을 알고 있으며 자신의 장점으로 수익을 창출하기를 원하는 트레이더를 위한 것입니다. 위험 매개변수는 귀하가 설정합니다. 선택한 경우 효과가 없는 거래에 대한 중지로 높은 승률을 얻을 수 있습니다. 장수 위험을 줄입니다. 이는 모든 계정에서 작동하며 위험 관리 도구입니다. 모든 댓글, 설명 및 블로그를 읽으십시오. 최상의 결과를 얻는 방법: https://www.mql5.com/en/blogs/post/754836 MT4 버전: https://www.mql5.com/en/market/product/73834 마이크로초 하나하나가 중요한 초단타매매(HFT)의 분주한 세계에는 HFT 해커라고만 알려진 신비한 인물이 살고 있었습니다. 빛처럼 빠른 반사 신경과 시장의 복잡한 알고리즘을 탐색하는 놀라운 능력을 갖춘 HFT 해커는 트레이더들 사이에서
Matrix Hacker
Thomas Bradley Butler
MT4 Version :   https://www.mql5.com/en/market/product/87060 Matrix Hacker는 헤지 계정 전용이며 랜덤 워크를 사용하므로 과거는 중요하지 않습니다. EA는 시장에서 안정적인 기반을 유지하고 매도호가와 매수호가를 모두 다룰 것입니다. 거래자에 따라 다양한 크기와 수량으로 매수 및 매도 매수 및 매도. 이것은 여전히 ​​​​최적화에 대해 알아야하고 과도하게 활용하지 않아야하기 때문에 초보자에게는 권장되지 않습니다. 작은 핍을 스캘핑하고 범위를 유지하기 위한 설정을 사용하는 것이 좋습니다. 이 EA는 잠재적으로 4개의 거래를 열 수 있으므로 이를 이해하여 입력의 크기가 올바른지 확인하십시오. 고정 로트 크기를 사용하므로 고정 랏으로 4개의 거래를 고려해야 합니다. 라이브로 거래하기 전에 먼저 데모에서 이 EA를 사용하고 확신할 때까지 증분 로트로만 라이브로 이동하십시오. 모든 마이크로 로트에 대해 $1000를 권장합니다. 데
Level 2 Trading
Thomas Bradley Butler
스마트 볼륨 추적기와 결합: https://www.mql5.com/en/market/product/116650 발자국 차트와 결합: https://www.mql5.com/en/market/product/94153 지역 내 거래와 결합: https://www.mql5.com/en/market/product/110194 VOLUM DAY TRADER와 결합: h https://www.mql5.com/en/market/product/72498 주문서와 결합: https://www.mql5.com/en/market/product/102247 레벨 2 트레이딩은 MetaTrader 차트에서 현재 매수 및 매도 거래량을 시각화하는 데 도움이 되는 지표입니다. 이는 시장에서 구매 및 판매 활동을 빠르게 파악하여 압력이 가해지는 위치를 이해할 수 있는 것과 같습니다. 그것이 보여주는 것 입찰 및 매도 금액: 표시기는 매수(매수) 및 매도(매도) 거래량을 보여주는 라벨을 표시
NeuroScalperMT5
Thomas Bradley Butler
MT4 indicator version https://www.mql5.com/en/market/product/72342 I personally use this indicator to scalp.  Accurate for accessing extremes and supports for buy positions primarily for 1 minute time frames.  Other time frames can be used but the levels are different. Its a better oscillator and compare with others to see the difference.          Day trade using neuro network concepts.  This indicator uses elementary forms of neuro networks to generate signals to buy and sell. Use the indicat
Bitcoin White Hat Hacker
Thomas Bradley Butler
Optimize before use in back test or live for better results for you  and don't forget to account for spreads and slippage in optimization. This Expert is for 1 minute charts trading BTC/USD.  Bitcoin on 1 minute use MACD, CCI and RSI for entry and exit logic.  This EA was back tested and traded out of sample.  Each trade has a stop loss and take profit.   BTC compared to the indexes and Gold have huge differences, look at the example of traditional investing vs. Bitcoin.  Yellow line represents
NeuroScalper
Thomas Bradley Butler
5 (1)
업데이트! 화살표가 100 및 200 레벨에 추가되었습니다. 이 지표는 극단적인 접근에 정확하고 주로 1분 기간 동안 매수 포지션을 지원합니다. 다른 시간 프레임을 사용할 수 있지만 수준이 다릅니다. 더 나은 오실레이터이며 차이점을 확인하기 위해 다른 오실레이터와 비교합니다. 신경망 개념을 사용한 데이 트레이드. 이 지표는 기본 형태의 신경망을 사용하여 구매 및 판매 신호를 생성합니다. 1분 차트에서 지표를 사용하십시오. 표시기는 다시 칠하지 않습니다. 1분 차트 또는 다른 레벨을 사용하는 다른 차트를 사용하여 테스터에서 다운로드하여 실행하고 거래를 분석하여 직접 확인하십시오. 시장을 스캘핑할 수 있는 많은 기회. 더 높은 시간 프레임에 사용할 수 있지만 수준은 재량에 따라 변경해야 합니다. 더 높은 시간 프레임은 더 높은 범위를 갖습니다. 이 모델에서 고려해야 할 개념 및 사항: 다중 표시기가 사용되고 가중치가 적용되며 최대 및 최소에 대한 2개의 데이터 포인트가
HFTHacker
Thomas Bradley Butler
신호: 내 프로필의 HFT Hacker 링크 *테스트 및 사용 전에 EA를 최적화하세요. 최적화된 경우에만 구매하세요. 이는 최적화 방법을 알고 있으며 자신의 장점으로 수익을 창출하기를 원하는 트레이더를 위한 것입니다. 위험 매개변수는 귀하가 설정합니다. 선택한 경우 효과가 없는 거래에 대한 중지로 높은 승률을 얻을 수 있습니다. 장수 위험을 줄입니다. 이는 모든 계정에서 작동하며 위험 관리 도구입니다. 모든 댓글, 설명 및 블로그를 읽으십시오. 최상의 결과를 얻는 방법: https://www.mql5.com/en/blogs/post/754836 MT4 버전: https://www.mql5.com/en/market/product/73834 마이크로초 하나하나가 중요한 초단타매매(HFT)의 분주한 세계에는 HFT 해커라고만 알려진 신비한 인물이 살고 있었습니다. 빛처럼 빠른 반사 신경과 시장의 복잡한 알고리즘을 탐색하는 놀라운 능력을 갖춘 HFT 해커는 트레이더들 사이에서
Bitcoin M5
Thomas Bradley Butler
테스트하고 사용하기 전에 EA를 최적화하세요. Bitcoin M5는 5분 차트에서 BTC/USD를 거래하기 위한 것입니다. SL 및 TP는 50000으로 시작해야 합니다. 사용하기 전에 최적화하세요. 거래 전략은 Bollinger Bands 및 Envelopes 지표를 사용하여 거래합니다. 가격이 밴드를 돌파하는 돌파 지점을 포착하고 가격이 한계선을 넘으면 종료하는 트레이딩입니다. 모든 거래에는 고정된 랏 금액이 사용되며 SL과 TP가 있습니다. EA는 로직에서 마틴게일이나 헤징을 사용하지 않습니다. 테스트하고 사용하기 전에 EA를 최적화하세요. Bitcoin M5는 5분 차트에서 BTC/USD를 거래하기 위한 것입니다. SL 및 TP는 50000으로 시작해야 합니다. 사용하기 전에 최적화하세요. 거래 전략은 Bollinger Bands 및 Envelopes 지표를 사용하여 거래합니다. 가격이 밴드를 돌파하는 돌파 지점을 포착하고 가격이 한계선을 넘으면 종
VolumeDayTrader
Thomas Bradley Butler
주식(CFD)에 대해서만 DAYTRADING. 거래에는 작업이 필요합니다. 모든 항목과 종료를 알려주는 바로 가기나 표시기는 없습니다. 이익은 마음의 상태에서 옵니다. 지표는 자금 관리 및 성공 심리학과 함께 사용되는 도구입니다. 볼륨 프로파일에서 불균형을 찾으십시오. 거래 가격 볼륨 불균형. 많은 불균형이 마감 및 공개 및 뉴스에서 발생합니다. 주식의 구매자 대 판매자를 참조하십시오. 5분에서 1시간 동안 사용하여 누가 가격을 통제하고 가격의 불균형을 찾을 수 있는지 확인합니다. 더 큰 주식은 15분 이상입니다. 이전 막대의 숫자를 보려면 색상 볼륨 막대 위로 마우스를 가져갑니다. 현재 막대 볼륨은 상단 모서리에 기록됩니다. 거래량의 불균형을 찾아 가격이 한동안 어떤 방향으로 갈지 확인하십시오. 최상의 결과를 위해 지배적인 경향을 따르십시오 추세가 발전하면 추세를 거래하십시오. 트레일링 스톱을 사용하고 큰 볼륨 반전 불균형을 주시하십시오.
MarketMakerMT5
Thomas Bradley Butler
수요 공급 거래를 자동화합니다. 시장을 만드십시오. 이 EA는 모두가 판매하고 모방하는 인기 있는 수요 공급 지표에서 영감을 받아 만들어졌습니다. EA는 거래와 헤징을 계속하여 시장을 만듭니다. 비 헤징 계정에서도 거래할 수 있습니다. 위험을 평가하고 시간 프레임, 로트 크기, 헤징 기능을 사용해야 합니다. 나는 한 번에 여러 쌍을 껐다가 켜고 한 달에 걸쳐 그것을 거래했습니다. 시스템의 개념: EA는 수요와 공급 수준을 거래합니다. 레벨이 변경되므로 EA는 계속해서 새로운 레벨을 거래할 것입니다. 더 낮은 로트를 가진 많은 쌍으로 분배하는 것은 시스템의 기능입니다. 꾸준한 이득을 유지하면서 큰 하락은 피해야 합니다. SL을 사용할 수 있지만 이것이 옵션이 될 수 있도록 내가 설명한 헷지된 측면입니다. 많은 쌍에 대해 작은 로트에서 얻는 손실은 4%이며 이것은 SL이 없는 것입니다. 더 큰 로트는 6%를 보여주고 있습니다. 따라서 크기가 작을수록 보수적이고 크면 공격적입
Black Gold M1
Thomas Bradley Butler
OPTIMIZE BEFORE BACKTEST AND USE Trade crude oil with this EA.  No EA turns hundreds into millions in a year or 2, This is a lie if presented this way.  Black Gold trades Brent Crude on 1 min charts.  It uses RSI, moving averages and directional indicators.  Try it out, load it onto the tester if you have the history and ability to trade Brent crude.    Adjust and optimize to get the most out of the expert advisor
ForexReversal
Thomas Bradley Butler
4 (1)
인내심은 스트레스 없는 스캘핑의 핵심입니다. 화살표가 200 이동 평균을 통과하는 것을 볼 때 거래하고 이동 평균 필터가 없는 마지막 스윙 포인트에서 확장하거나 추세를 만드십시오. 1분 시간 프레임에 적합하며 일중 움직임을 포착합니다. 후행 정지를 사용하여 쉽게 20핍을 가져오거나 더 큰 추세에 더 오래 머물 수 있습니다. 이 표시기에서 실제로 큰 거래의 사진에 있는 예를 보십시오. 1분의 시간 프레임이 가장 효과적입니다. 트렌드를 보려면 축소하십시오. 화살표는 다시 칠하거나 다시 계산하지 않습니다. 1분 시간 프레임에 연결하고 거래를 연구하고 전략에 사용할 수 있는지 확인하십시오. 나 규칙: 파란색 구매 레드 판매 옆 기간을 피하십시오 거래량이 많을 때 거래하고 모멘텀을 거래하십시오 손절매 사용 인내심은 스트레스 없는 스캘핑의 핵심입니다. 화살표가 200 이동 평균을 통과하는 것을 볼 때 거래하고 이동 평균 필터가 없는 마지막 스윙 포인트에서 확장하거나 추세를 만드
GoldBuyBackScalper
Thomas Bradley Butler
4 (1)
이 표시는 XAU/USD, 1분 차트 전용입니다. 모든 쌍에는 고유한 특성과 가격 변동이 있습니다. 이 지표로 V자형 반전을 거래하십시오. 두피는 후행 정지를 사용하여 매수하고 뉴스는 더 극단적이고 갑작스러운 매도를 유발할 수 있으므로 뉴스를 피합니다. 백테스트에서 1분 시간 프레임에 연결하고 반전 매수를 확인합니다. 표시기는 다시 그리거나 다시 계산하지 않습니다. 활성 시간에만 거래 이 표시는 XAU/USD, 1분 차트 전용입니다. 모든 쌍에는 고유한 특성과 가격 변동이 있습니다. 이 지표로 V자형 반전을 거래하십시오. 두피는 후행 정지를 사용하여 매수하고 뉴스는 더 극단적이고 갑작스러운 매도를 유발할 수 있으므로 뉴스를 피합니다. 백테스트에서 1분 시간 프레임에 연결하고 반전 매수를 확인합니다. 표시기는 다시 그리거나 다시 계산하지 않습니다. 활성 시간에만 거래
TrueSupplyandDemand
Thomas Bradley Butler
This is based on short term strength or weakness and not on moving averages.  Moving averages are used for filter only. Trade supply and demand with arrows. Supply and demand breakouts and strength of the buyers or sellers .  Don't trade buy arrow to sell arrow.  Trade the strength with trendlines or moving averages and use stops.  The arrow can have some strong moves.  Trade on all time frames.  Try it out in the back tester. The pips can be made with this indicator, follow the arrows and mak
ScalpingMaster
Thomas Bradley Butler
Master scalping with this indicator.  Trade on any time frame for scalps on buy or sells.  Follow trends using a 200 moving average and stops and targets.  Use with your own system.  This indicator can give pips if following it correctly.  Stick to rules and pick up pips daily.  Use as entries in a trend, scalp for a few pips or exit on opposite signal.  Best to follow higher time frame trends. Indicator doesn't repaint or recalculate. Rules: Don't trade overnight, only trade during active sessi
DayTradeKing
Thomas Bradley Butler
This indicator is good for small time frames like 1 and 5 minutes and made for day trading. The indicator never repaints or recalculates. The indicator works is for trading swing points in day trading, following bulls or bears.  Its a simple to use, non cluttered indicator with a high success rate.  This indicator works well to capture ranges.  All indicators come with limitations and no indicator or system is always accurate. Use money management for long term trading success.   Place in backte
DTKGold
Thomas Bradley Butler
This is the DayTradeKing for gold on a 1 minute time frame.  It is a different calculation for the range. Use a 200 period moving average as a filter.  Always use stops and avoid news, wait for more conformation.  This looks to capture intraday ranges. Put it in the back tester on 1 minute to see the price action and how it works. Trade with trend Use filter Use stops Alerts are added for pop ups and sound. 
SuperArrowScalper
Thomas Bradley Butler
Trade trends with the Super Scalper Use on all time frames and assets it is  designed for scalping trends. Works good on small time frames for day trading.  The arrows are easy to follow.  This is a simple no repaint/no recalculate arrow indicator to follow trends with.  Use in conjunction with your own system or use moving averages.  Always use stops just below or above the last swing point or your own money management system The indicator comes with push notifications, sound alerts and email
Levels Trading
Thomas Bradley Butler
This indicator is a simple stripped down version of any advanced support and resistance indicator.  All the support and resistance indicators work from a number of bars that have developed over time. Get rid of clutter and confusing levels.  Find levels according to a number of bars. Look at days, session, numbers of hours, periods of consolidation.  Watch levels develop and use as breakout points, or areas of buyers and sellers.  Features and things to consider This indicator is for a frame of
ForexReversalEA
Thomas Bradley Butler
https://www.mql5.com/en/market/product/57345 이 EA는 Forex Reversal 지표를 기반으로 합니다. 시스템을 수동으로 거래하고 싶다면 지표를 다운로드하여 사용해 보십시오. EA는 추세를 따르고 그에 따라 포지션을 열 것입니다. 결과는 더 낮은 드로다운으로 안정적인 이득을 보여주지만 백 테스터, 옵티마이저 및 시간 프레임에서 실험하여 무엇이 작동하는지 확인하십시오. 표시된 모든 결과는 가상입니다. 참고: 이것은 마틴게일이나 그리드가 아닙니다. 지표에 헤지 기능이 있습니다. 이 EA에는 다음과 같은 기능이 있으며 위험에 따라 변경하십시오. EA는 무료 마진에 따라 추가하고 매개변수에 따라 구매 및 판매합니다. 입력을 통해 위험을 제어합니다. inp 5는 판매 inp 7은 구매 고정 스톱 로트 고정 이익실현   여유 마진의 %
MarketMaker
Thomas Bradley Butler
수요 공급 거래를 자동화합니다. 시장을 만드십시오. 이 EA는 모두가 판매하고 모방하는 인기 있는 수요 공급 지표에서 영감을 받아 만들어졌습니다. EA는 거래와 헤징을 계속하여 시장을 만듭니다. 비 헤징 계정에서도 거래할 수 있습니다. 위험을 평가하고 시간 프레임, 로트 크기, 헤징 기능을 사용해야 합니다. 나는 한 번에 여러 쌍을 껐다가 켜고 한 달에 걸쳐 그것을 거래했습니다. 시스템의 개념: EA는 수요와 공급 수준을 거래합니다. EA가 계속해서 새로운 레벨을 거래할 수 있도록 레벨이 변경됩니다. 더 낮은 로트를 가진 많은 쌍 사이에 분배하는 것은 시스템의 기능입니다. 꾸준한 이득을 유지하면서 큰 하락은 피해야 합니다. SL을 사용할 수 있지만 이것이 옵션이 될 수 있도록 내가 설명한 헷지된 측면입니다. 많은 쌍에 대해 작은 로트에서 얻는 손실은 4%이며 이것은 SL이 없는 것입니다. 더 큰 로트는 6%를 보여주고 있습니다. 따라서 크기가 작을수록 보수적이며 크
Top Trader
Thomas Bradley Butler
Top Trader Indicator This is an arrow reversal indicator. This is with deviations and arrows.  Trade a blue arrow for buy and trade a red arrow for sell.  Change the time period and the deviations of the bands.  This is similar to others but these arrows don't repaint.  Load in back tester and study which periods and deviations work the best.  It works on all time frames.  15 min to 1 hr would give good results for take profits.  Try according to your own risk management.
Quant Bot
Thomas Bradley Butler
Quant Bot은 EUR/USD에 대한 1시간 프레임의 추세 거래를 위한 것입니다. 설정된 파일은 없지만 다른 쌍을 사용하는 경우 최적화가 필요할 수 있습니다. 봇 정보: 그것은 유전자 생성을 사용하고 ATR을 사용하여 거래합니다. 커브 핏을 방지하기 위해 앞으로 걷기 기간이 사용되었습니다. EA는 모든 거래에 스탑을 사용합니다. 자금 관리는 잔액의 %로 확장됩니다. 백셋 기간은 2003-2020년이고 앞으로 나아가는 기간은 2020-2022년입니다. (사진 참조). Quant Bot은 EUR/USD에 대한 1시간 프레임의 추세 거래를 위한 것입니다. 설정된 파일은 없지만 다른 쌍을 사용하는 경우 최적화가 필요할 수 있습니다. 봇 정보: 그것은 유전자 생성을 사용하고 ATR을 사용하여 거래합니다. 커브 핏을 방지하기 위해 앞으로 걷기 기간이 사용되었습니다. EA는 모든 거래에 스탑을 사용합니다. 자금 관리는 잔액의 %로 확장됩니다. 백셋 기간은 2003-2020
Crypto Net
Thomas Bradley Butler
Crypto Net은 1시간 단위로 BTCUSD를 거래하기 위한 것입니다. 그것은 전략을 발전시키기 위해 유전자 진화를 사용합니다. 이 EA 거래 추세는 ATR 및 Ichimoku 지표를 따릅니다. 이것은 구축되었으며 Monte Carlo 및 Walk Forward를 포함한 다양한 테스트를 통과했습니다. 입력: 최소 위험인 계정 비율입니다. 최대 로트 수 거래 중단 시간 다른 것은 변경되지 않습니다. Crypto Net은 1시간 단위로 BTCUSD를 거래하기 위한 것입니다. 그것은 전략을 발전시키기 위해 유전자 진화를 사용합니다. 이 EA 거래 추세는 ATR 및 Ichimoku 지표를 따릅니다. 이것은 구축되었으며 Monte Carlo 및 Walk Forward를 포함한 다양한 테스트를 통과했습니다. 입력: 최소 위험인 계정 비율입니다. 최대 로트 수 거래 중단 시간 다른 것은 변경되지 않습니다.
Golden Standard
Thomas Bradley Butler
XAU/USD의 경우 무작위 생성과 추세에 따른 거래를 사용하는 안정적인 거래 시스템입니다. Expert는 XAU/USD 1시간 프레임에서 과적합을 피하기 위해 Monte Carlo 시뮬레이션과 함께 최적화 기간을 완료한 후 품질 데이터로 다시 테스트했습니다. 손절매와 이익실현이 사용됩니다. EA에는 여러 구성이 있으며 거래할 로트 수를 파악하는 것 외에는 할 일이 없습니다. 특징: 잔액 복합 이익의 백분율을 사용합니다. XAU/USD의 경우 무작위 생성과 추세에 따른 거래를 사용하는 안정적인 거래 시스템입니다. Expert는 XAU/USD 1시간 프레임에서 과적합을 피하기 위해 Monte Carlo 시뮬레이션과 함께 최적화 기간을 완료한 후 품질 데이터로 다시 테스트했습니다. 손절매와 이익실현이 사용됩니다. EA에는 여러 구성이 있으며 거래할 로트 수를 파악하는 것 외에는 할 일이 없습니다. 특징: 잔액 복합 이익의 백분율을 사용합니다.
PropTrader
Thomas Bradley Butler
*사용하기 전에 EA를 최적화하세요* EUR/USD에 최적화된 외환 트레이딩 전략 EA(Expert Advisor)를 통해 1~2년 내에 상당한 부를 달성한다는 것은 비현실적인 주장입니다. 백테스팅과 실제 거래는 EUR/USD 통화 쌍에 중점을 둡니다. 이 전략 정보: 이는 우리 전략의 초기 반복을 나타내며 추가 발전 가능성이 있습니다. 100% 품질 데이터로 엄격한 테스트를 거쳤으며 MT4 오류가 없습니다. 이 전략은 추세 추종의 논리적 원리에 따라 운영됩니다. 추세가 강세일 때 EA는 후행 정지를 전개하고 그 반대의 경우도 마찬가지입니다. 본질적으로 이는 간단한 추세 추종 접근 방식입니다. 주요 장점 및 고려 사항: 쉬운 설정: 기본 설정을 그대로 유지하고 원하는 대로 로트 크기만 수정합니다. 위험 관리: 이 전략에는 마틴게일이나 헤징이 사용되지 않습니다. 위험 완화: 각 거래에는 ATR(Average True Range)에 따라 결정되는 추적 중지 및 이익
Down Under
Thomas Bradley Butler
Down Under는 1시간 프레임에 AUD/USD 쌍을 거래합니다. 이 EA는 ATR과 OHLC를 거래합니다. 이 시간 프레임에 이 쌍에 대해 형식이 지정됩니다. 혼합은 분과 함께 사용됩니다. 로트 크기 및 최대. 로트 크기. 잔액의 백분율은 거래에서 승리하면 복리됩니다. 잔고가 변동함에 따라 로트 규모도 변동합니다. 설정: mm 위험 % mm 로트 최대 부지 변경할 사항이 없습니다. 이것은 마틴게일이나 헤징 기능이 없습니다. 변경할 다른 기능은 거래하는 경우 AUD/USD의 CFD입니다. 브로커 플랫폼에서 이를 소수로 변경합니다. 위험 면책 조항 선물, 옵션 및 통화 거래는 모두 잠재적인 보상이 크지만 잠재적인 위험도 큽니다. 이러한 시장에 투자하려면 위험을 인식하고 기꺼이 감수해야 합니다.
Cable Trader
Thomas Bradley Butler
GBP/USD 1 hr. 이 EA는 모멘텀과 세션을 거래합니다. 이것은 고정된 로트 구성요소를 가지고 있으며 개발함에 따라 TP를 계속 수정할 것입니다. 설정: 로트 크기 변경할 사항이 없습니다. 이것은 마틴게일이나 헤징 기능이 없습니다. 변경할 다른 기능은 거래하는 경우 GBP/USD의 CFD입니다. 브로커 플랫폼에서 이를 소수로 변경합니다. 위험 면책 조항 선물, 옵션 및 통화 거래는 모두 잠재적인 보상이 크지만 잠재적인 위험도 큽니다. 이러한 시장에 투자하려면 위험을 인식하고 기꺼이 감수해야 합니다. Cable Trade는 1시간 동안 GBP/USD 쌍을 거래합니다. 라이브 거래 전 데모. 이 EA는 모멘텀과 세션을 거래합니다. 이것은 고정된 로트 구성요소를 가지고 있으며 개발함에 따라 TP를 계속 수정할 것입니다. 설정: 로트 크기 변경할 사항이 없습니다. 이것은 마틴게일이나 헤징 기능이 없습니다. 변경할 다른
Euclidean
Thomas Bradley Butler
Euclidean은 제가 8년 전에 생각해낸 독특한 거래 알고리즘입니다. 이 EA는 이 시스템의 일부입니다. 닫힌 시스템으로 작동합니다. EA는 추세를 포착하기에 각도가 정확할 때 매수를 시작합니다. 정지 손실은 각도에서 10%입니다. 간단합니다. 입력: $1,000에 대한 로트 1 마이크로 로트의 잔액 비율 볼륨 상위 로트 = 최대 로트 수량 이익 수준 = 기본값은 50핍입니다. 방법 및 고려해야 할 사항: 손절매가 내장되어 10%의 각도에서 가격에 따라 거래됩니다. 이익실현은 50핍으로 설정되지만 원하는 금액일 수 있습니다. 1 5분과 같은 짧은 시간에 거래하십시오. 백 테스터에서 이것을 테스트하는 데 오류가 없었습니다. 플랫폼 및 브로커마다 데이터가 다르므로 테스트할 데이터 다운로드를 확인하십시오. Forex 거래에 대한 위험 고지 마진으로 외환 거래는 높은 수준의 위험을 수반하며 모든 투자자에게 적합하지 않을 수 있습니다. 과거의 성과가 미래의 결과
Pip Scalper
Thomas Bradley Butler
모두를 위한 지표 Pip Scalper는 스캘핑 트렌드입니다. 이 표시기로 추세를 더 오래 유지하십시오. 모든 시간 프레임과 자산에서 작동합니다. 이 도구로 매일 핍을 얻으십시오. 200 이동 평균을 사용하여 거래를 필터링하십시오. 더 짧은 기간을 권장합니다. 데이 트레이딩에 사용합니다. 정보 및 사용 방법: Pips Scalper는 장기 추세 거래를 기반으로 합니다. 파란색으로 구매 레드에 판매 200 이동 평균을 필터로 사용하고 활성 기간 동안 거래하십시오. Pip Scalper는 스캘핑 트렌드입니다. 이 표시기로 추세를 더 오래 유지하십시오. 모든 시간 프레임과 자산에서 작동합니다. 이 도구로 매일 핍을 얻으십시오. 200 이동 평균을 사용하여 거래를 필터링하십시오. 더 짧은 기간을 권장합니다. 데이 트레이딩에 사용합니다. 정보 및 사용 방법: Pips Scalper는 장기 추세 거래를 기반으로 합니다. 파란색으로 구매 레드에 판매 200 이동 평
필터:
리뷰 없음
리뷰 답변
버전 2.20 2024.08.26
adjustments to panel
버전 2.10 2024.08.26
Referenced contributing developer