• 미리보기
  • 리뷰
  • 코멘트

Highs Lows and Bos Indicator for MT5

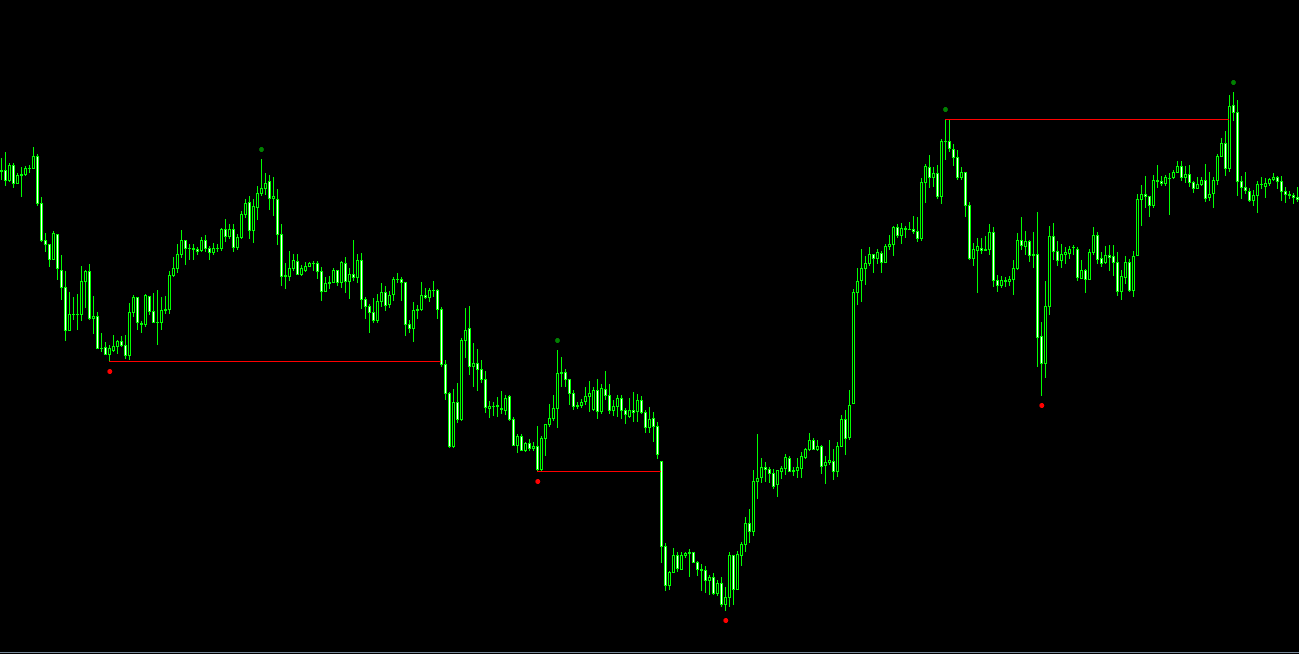
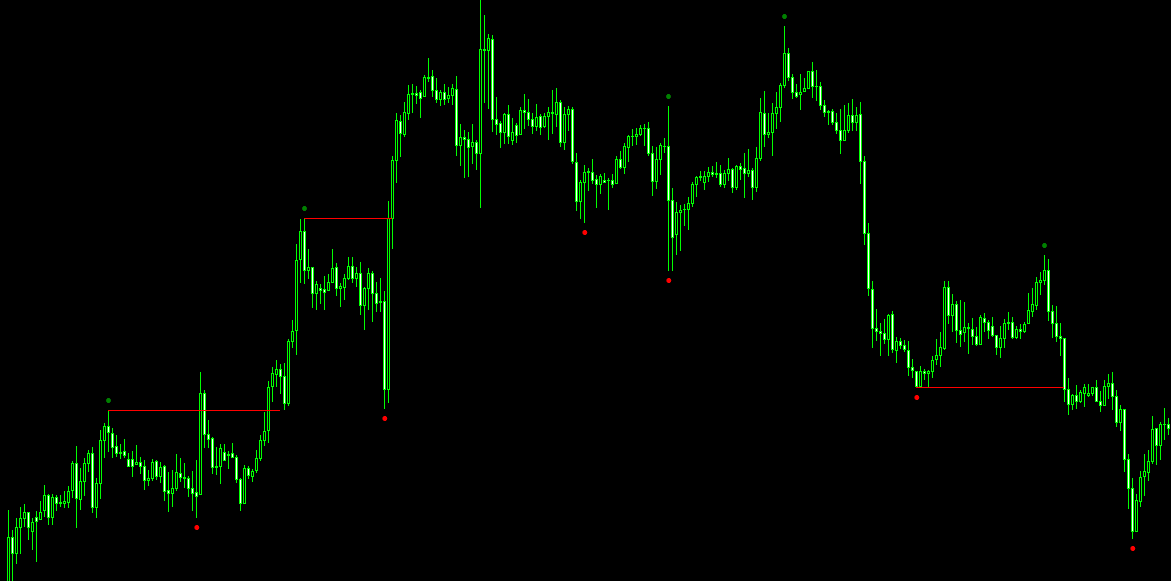
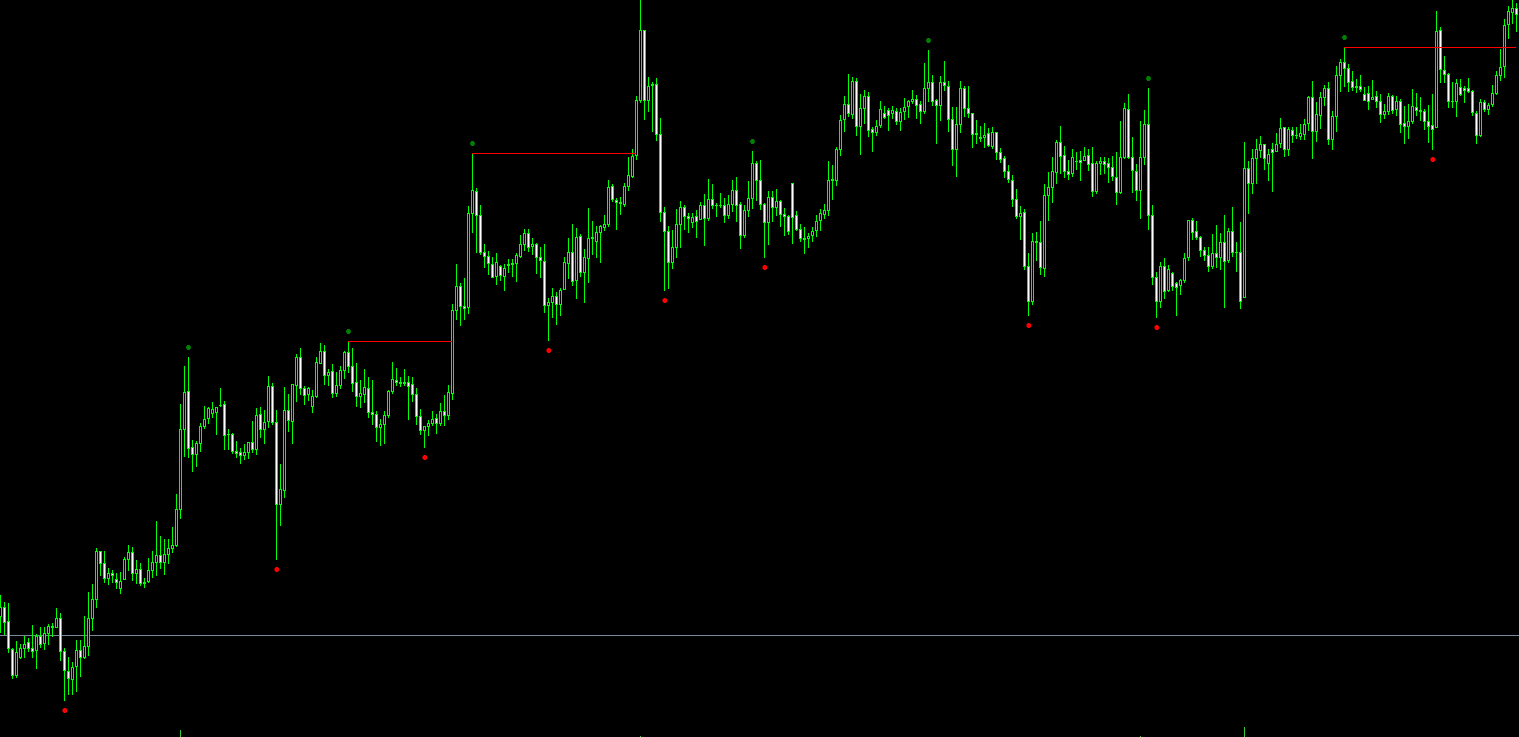
Highs, Lows and Bos Indicator for MT5; The indicator works on any type of market and on all TimeFrames. It also works on the MetaTrader5 Tester. the main function of the indicator is to identify the highs and lows by marking them with a point above/below the candle, then with a horizontal line it marks the Bos.

It is very simple and intuitive, there are only 2 inputs:

-the color of the maximums

-the color of the minima


For any other information do not hesitate to contact me.


추천 제품
KT Renko Patterns MT5
KEENBASE SOFTWARE SOLUTIONS
KT Renko Patterns scans the Renko chart brick by brick to find some famous chart patterns that are frequently used by traders across the various financial markets. Compared to the time-based charts, patterns based trading is easier and more evident on Renko charts due to their uncluttered appearance. KT Renko Patterns features multiple Renko patterns, and many of these patterns are extensively explained in the book titled Profitable Trading with Renko Charts by Prashant Shah. A 100% automate
- This is the exact conversion from TradingView: "Support/Resistance" By "BarsStallone". - This indicator lets you read the buffers for R/S values. - This is a non-repaint and light processing load indicator. - This is not a multi time frame indicator If you want the multi time frame version you should create a personal order and I deliver two files that you need them both to have the multi time frame indicator running on your system. - The MT4 version of the indicator is not light load from pr
이 표시기는 차트의 모든 주문에 대해 이미 설정한 TP 및 SL 값(해당 통화로)을 표시하여 모든 주문에 대한 손익을 추정하는 데 많은 도움이 됩니다(거래/주문 라인에 닫힘). 또한 PIP 값도 표시됩니다. 표시된 형식은 "이익 또는 손실 / PIP 값의 통화 값"입니다. TP 값은 녹색으로 표시되고 SL 값은 빨간색으로 표시됩니다.. 질문이나 자세한 내용은 fxlife.asia@hotmail.com  or  fxlife.asia@yahoo.com 으로 판매자에게 언제든지 문의하십시오. (그리고 곧 표시기에 추가될 다음 기능은 "자동 또는 반자동 TP 및 SL 설정"이며 고객은 무료로 업데이트 버전을 받을 것입니다. 감사합니다...) (또는 표시에 일부 기능을 추가해야 한다고 생각하시면 언제든지 말씀해 주십시오...)
The new update makes this indicator a complete tool for studying, analyzing and operating probabilistic patterns. It includes: On-chart Multi-asset percentage monitor. Configurable martingales. Twenty-one pre-configured patterns, including Mhi patterns and C3. An advanced pattern editor to store up to 5 custom patterns. Backtest mode to test results with loss reports. Trend filter. Hit operational filter. Martingale Cycles option. Various types of strategies and alerts. Confluence between patter
Antique Trend
Nadiya Mirosh
The Antique Trend Indicator is a revolutionary trend trading and filtering solution with all the important features of a trend tool built into one tool! The Antique Trend indicator is good for any trader, suitable for any trader both for Forex and binary options. There is no need to configure anything, everything has been perfected by time and experience, it works great during flats and trends. The Antique Trend indicator is a tool for technical analysis of financial markets, reflecting curre
ATrend
Zaha Feiz
4.75 (4)
ATREND: 작동 방식 및 사용 방법 ### 작동 방식 MT5 플랫폼을 위한 "ATREND" 지표는 기술 분석 방법론의 조합을 활용하여 트레이더에게 강력한 매수 및 매도 신호를 제공하도록 설계되었습니다. 이 지표는 주로 변동성 측정을 위해 평균 진폭 범위(ATR)를 활용하며, 잠재적인 시장 움직임을 식별하기 위한 트렌드 탐지 알고리즘과 함께 사용됩니다. 구매 후 메시지를 남기면 특별 보너스 선물을 받게 됩니다. 30달러에 8부 남았습니다. ### 주요 특징: - 동적 트렌드 탐지: 이 지표는 시장 트렌드를 평가하고 신호를 조정하여 트레이더가 현재 시장 상황에 맞춰 전략을 조정할 수 있도록 돕습니다. - 변동성 측정: ATR을 사용하여 시장의 변동성을 측정하며, 이는 최적의 손절매(SL) 및 이익 실현(TP) 수준을 결정하는 데 중요합니다. - 신호 시각화: 이 지표는 차트에 매수 및 매도 신호를 시각적으로 표시하여 트레이더의 의사 결정을 향상시킵니다. ### 운영 단계 ###
Identify precise entry and exit points with AB=CD patterns This indicator finds AB=CD retracement patterns. The AB=CD Retracement pattern is a 4-point price structure where the initial price segment is partially retraced and followed by an equidistant move from the completion of the pullback, and is the basic foundation for all harmonic patterns. [ Installation Guide | Update Guide | Troubleshooting | FAQ | All Products ] Customizable pattern sizes Customizable AC and BD ratios Customizab
Volume by Price MT5
Brian Collard
3.25 (4)
The Volume by Price Indicator for MetaTrader 5 features Volume Profile and Market Profile TPO (Time Price Opportunity). Volume and TPO histogram bar and line charts. Volume Footprint charts. TPO letter and block marker collapsed and split structure charts. Static, dynamic and flexible range segmentation and compositing methods with relative and absolute visualizations. Session hours filtering and segment concatenation with Market Watch and custom user specifications. Graphical layering, positio
Crash 1000 Scalping Indicator for the Crash 1000 Deriv Synthetic Index. Introduction The Crash 1000 Scalping Indicator is a specialized tool designed for the Crash 1000 index on the Deriv Synthetic market. This indicator is particularly useful for scalping on the M1 timeframe, helping traders to identify precise entry and exit points for buy positions. It is designed to be non-repainting, providing clear signals with audible alerts and push notifications, and is compatible with mobile devices th
How to use Pair Trading Station Pair Trading Station is recommended for H1 time frame and you can use it for any currency pairs. To generate buy and sell signal, follow few steps below to apply Pair Trading Station to your MetaTrader terminal. When you load Pair Trading Station on your chart, Pair Trading station will assess available historical data in your MetaTrader platforms for each currency pair. On your chart, the amount of historical data available will be displayed for each currency pai
Noize Absorption Index
Ekaterina Saltykova
Noize Absorption Index - is the manual trading system that measures the difference of pressure between bears forces and bulls forces. Green line - is a noize free index that showing curent situation. Zero value of index shows totally choppy/flat market.Values above zero level shows how powerfull bullish wave is and values below zero measures bearish forces.Up arrow appears on bearish market when it's ready to reverse, dn arrow appears on weak bullish market, as a result of reverse expectation.
PZ Penta O MT5
PZ TRADING SLU
The Penta-O is a 6-point retracement harmonacci pattern which usually precedes big market movements. Penta-O patterns can expand and repaint quite a bit. To make things easier this indicator implements a twist: it waits for a donchian breakout in the right direction before signaling the trade. The end result is an otherwise repainting indicator with a very reliable trading signal. The donchian breakout period is entered as an input. [ Installation Guide | Update Guide | Troubleshooting | FAQ | A
Cumulative Delta NG
Anton Polkovnikov
Cumulative delta indicator As most traders believe, the price moves under the pressure of market buying or selling. When someone redeems an offer standing in the cup, the deal is a "buy". If someone pours into the bid standing in the cup - the deal goes with the direction of "sale". The delta is the difference between purchases and sales. A cumulative delta - the difference between the cumulative sum of purchases and sales for a certain period of time. It allows you to see who is currently contr
Surf Board
Mohammadal Alizadehmadani
Benefits of the Surfboard indicator : Entry signals without repainting If a signal appears and is confirmed, it does NOT disappear anymore, unlike indicators with repainting, which lead to major financial losses because they can show a signal and then remove it. perfect opening of trades The indicator algorithms allow you to find the Peak and floor position to enter a deal (buy or sell an asset), which increases the success rate for each and every trader using it. Surfboard works with any asse
Before installing the HeatMap indicator make sure you are using a broker that gives you access to the Depth of market (DOM) !! This indicator creates a heatmap on your chart allowing you to see the buy or sell limit orders easily and in real time. You have the possibility to change the setting and the colors of the HeatMap in order to adapt to all markets and all charts. Here is an example of a setting you can use with the NASDAQ100 on the AMPGlobal broker :  https://www.youtube.com/watch?v=x0
SMT (Smart Money Technique) Divergence refers to the price divergence between correlated assets or their relationship to inversely correlated assets.  By analyzing SMT Divergence, traders can gain insights into the market's institutional structure and identify whether smart money is accumulating or distributing assets.  Every price fluctuation should be confirmed by market symmetry, and any price asymmetry indicates an SMT Divergence, suggesting a potential trend reversal. MT4 Version -  https:/
Blahtech Market Profile MT5
Blahtech Limited
5 (9)
Was: $249  Now: $99   Market Profile defines a number of day types that can help the trader to determine market behaviour. A key feature is the Value Area, representing the range of price action where 70% of trading took place. Understanding the Value Area can give traders valuable insight into market direction and establish the higher odds trade. It is an excellent addition to any system you may be using. Inspired by Jim Dalton’s book “Mind Over Markets”, this indicator is designed to suit the
Paula Bollinger Bands Strategy
Francisco Gomes Da Silva
4 (2)
Bollinger bands out/in strategy A strategy created by Joe Ross, and very useful for finding trades when the market is overloaded. Indicator You don't need to find where there are entries on the chart, this indicator shows them for you. The entrance The trade is confirmed when the price closes outside the bollinger bands on a candle and the candle after the price closes inside the bands. comment I want to improve this indicator, so you can help me sending me your reviews and comments, thanks :).
FREE
UR Gamma MT5
Krzysztof Jan Debski
UR 감마 (머신 러닝 시스템에서 발견되는 유사한 계산으로 구동됨) UR Gamma는 기존 WaveTrend 지표에 새롭고 향상된 기능을 제공하는 최첨단 재무 분석 도구입니다. 고급 디지털 신호 처리 기술을 통합함으로써 UR 감마는 기존 WaveTrend 알고리즘의 일부 제한 사항을 해결하고 가격 움직임의 추세를 식별하고 측정하기 위한 보다 정확하고 강력하며 역동적인 접근 방식을 제공합니다. UR 감마 사용의 이점: 최소한의 설정 모든 데이터는 백그라운드에서 계산되고 있으며 사용자를 위한 출력은 단 1개로 명확하고 깔끔합니다. 피로를 암시하는 배경 수준 모든 종류의 자산에 맞게 조정됩니다. 도구 업데이트를 최신 상태로 유지하고 빠진 것이 있다고 생각되면 요청을 보낼 수 있는 특별한 텔레그램 채팅이 있습니다! 왜 UR 감마인가? 목표는 확률 분포가 -1과 1 사이에서 진동하도록 하고 0을 중간 지점으로 하는 것입니다. 이를 달성하기 위해 활성화 함수라고 하는 기
Big Black Shark MT5
Yaroslav Varankin
Tool for Identifying Potential Reversal Points and Trend Direction This tool is excellent for identifying potential reversal points and trend direction in the market. It works well with confirming indicators such as MACD, Stochastic, RSI - standard indicators available on all MT5 platforms. Together with them, it forms a reliable strategy. In the settings, you can adjust the channel distance and period. It is recommended to enter a trade when the signal line crosses the upper channel bounda
Follow The Line MT5
Oliver Gideon Amofa Appiah
4.5 (28)
This indicator obeys the popular maxim that: "THE TREND IS YOUR FRIEND" It paints a GREEN line for BUY and also paints a RED line for SELL. (you can change the colors). It gives alarms and alerts of all kinds. IT DOES NOT REPAINT and can be used for all currency pairs and timeframes. Yes, as easy and simple as that. Even a newbie can use it to make great and reliable trades. NB: For best results, get my other premium indicators for more powerful and reliable signals. Get them here: https://www.m
FREE
Owl Smart Levels MT5
Sergey Ermolov
4.07 (28)
MT4 버전  |  FAQ Owl Smart Levels Indicator 는 Bill Williams 의 고급 프랙탈, 시장의 올바른 파동 구조를 구축하는 Valable ZigZag, 정확한 진입 수준을 표시하는 피보나치 수준과 같은 인기 있는 시장 분석 도구를 포함하는 하나의 지표 내에서 완전한 거래 시스템입니다. 시장과 이익을 취하는 장소로. 전략에 대한 자세한 설명 표시기 작업에 대한 지침 고문-거래 올빼미 도우미의 조수 개인 사용자 채팅 ->구입 후 나에게 쓰기,나는 개인 채팅에 당신을 추가하고 거기에 모든 보너스를 다운로드 할 수 있습니다 힘은 단순함에 있습니다! Owl Smart Levels 거래 시스템은 사용하기 매우 쉽기 때문에 전문가와 이제 막 시장을 연구하고 스스로 거래 전략을 선택하기 시작한 사람들 모두에게 적합합니다. 전략 및 지표에는 눈에 보이지 않는 비밀 공식 및 계산 방법이 없으며 모든 전략 지표는 공개되어 있습니다. Owl Smart Levels를
To get access to MT4 version please click here . - This is the exact conversion from TradingView: "Stochastic Momentum Index" By "UCSgears". - This is a popular version of stochastic oscillator on tradingview. - This is a light-load processing and non-repaint indicator. - Buffers are available for the lines on chart. - You can message in private chat for further changes you need. Thanks for downloading
HMA Trend Professional MT5
Pavel Zamoshnikov
4.25 (4)
Improved version of the free HMA Trend indicator (for MetaTrader 4) with statistical analysis. HMA Trend is a trend indicator based on the Hull Moving Average (HMA) with two periods. HMA with a slow period identifies the trend, while HMA with a fast period determines the short-term movements and signals in the trend direction. The main differences from the free version: Ability to predict the probability of a trend reversal using analysis of history data. Plotting statistical charts for analyz
Binary Options Assistant (BOA) Multi Currency Dashboard for Binary Options (MT5) . You can use any of the BOA Signals Indicators with the dashboard. Just change the BOA Signals Indicator Name in the dashboard settings to the indicator you want to get signals from. For example: CHILL. BLAZE:  BOA_BLAZE_Indicator_v1   Strategy :   BLW Online Trading Binary Options Strategy (3 Moving Average) LAVA:  BOA_LAVA_Indicator_v1   Strategy:   Lady Trader Binary Options Strategy (Bollinger Bands & Stoc
M & W Pattern Pro is an advanced scanner for M and W patters , it uses extra filters to ensure scanned patterns are profitable. The indicator can be used with all symbols and time frames. The indicator is a non repaint indicator with accurate statistics calculations. To use , simply scan the most profitable pair using the statistics dashboard accuracy , then enter trades on signal arrow and exit at the TP and SL levels. STATISTICS : Accuracy 1 : This is the percentage of the times price hit
Kenko Trend Indicator mt5
Felix Kenechi Onodu
5 (1)
For anyone studying forex charts, the aim is to identify trends, and spot reversals. If you have years of experience it may be easy, but most of us need something to make the trend apparent. If you're familiar with the popular renko charting method, you know that it was developed for this purpose. But renko charting has a flaw; the trend is often broken by false reversals. So I developed my own version - the Kenko Trend Indicator. The kenko trend indicator draws renko style trend following block
Orders SL and TP Values Show
Nelson Queiros De Almeida
Orders SL and TP Values Show 이것은 메인 차트의 선 위에 이익과 손실의 값을 표시하는 지표입니다. 또한, 포인트 단위의 거리가 표시됩니다. 이 지표의 일부 특징은 다음과 같습니다. 주문 손절매 및 이익 실현 값을 보다 정확하게 계산하기 위해 스왑 값을 포함하는 옵션입니다. (기본적으로 활성화됨) 가격 값의 왼쪽에 티켓 번호를 포함하는 옵션입니다. 이것은 터미널의 도구 상자에 따라 레벨을 식별하는 데 유용합니다. (기본적으로 비활성화됨) 값이 손절매 또는 이익 실현인지에 관계없이 이익이 발생하면 파란색으로 칠해지고 손실이 발생하면 빨간색으로 칠해집니다. 동일한 값을 가진 다른 티켓의 손절매 또는 이익 실현이 2개 이상 있는 경우 각각을 올바르게 식별하기 위해 티켓 번호와 함께 정보가 무작위로 회전됩니다. 값은 계정에 있는 통화로 표시됩니다. 포인트도 표시됩니다. 색상 또는 거리는 입력 매개변수를 통해 조정할 수 있습니다. 카운터는 매치된 총 티켓의 현
**   All Symbols   x   All Timeframes   scan just by pressing scanner button ** *** Contact me  to send you instruction and add you in "Head & Shoulders Scanner group" for sharing or seeing experiences with other users. Introduction: Head and Shoulders   Pattern  is a very repetitive common type of price reversal patterns.   The pattern appears on all time frames and can be used by all types of traders and investors.   The  Head and Shoulders  Scanner indicator  Scans All charts just by pressing
Elevate Your Trading Experience with Wamek Trend Consult!   Unlock the power of precise market entry with our advanced trading tool designed to identify early and continuation trends. Wamek Trend Consult empowers traders to enter the market at the perfect moment, utilizing potent filters that reduce fake signals, enhancing trade accuracy, and ultimately increasing profitability.   Key Features: 1. Accurate Trend Identification: The Trend Consult indicator employs advanced algorithms and unparall
이 제품의 구매자들이 또한 구매함
TPSpro RFI Levels MT5
Roman Podpora
4.73 (11)
지침         러시아   -        영어       표시기와 함께 사용하는 것이 좋습니다   .       -       TPSpro   트렌드 프로 -   MT4 버전         거래에서 핵심 요소는 거래 상품을 매수 또는 매도하기로 결정하는 구역 또는 수준입니다. 주요 업체가 시장에서 자신의 존재를 숨기려는 시도에도 불구하고, 그들은 필연적으로 흔적을 남깁니다. 우리의 과제는 이러한 흔적을 식별하고 올바르게 해석하는 방법을 배우는 것이었습니다. 주요 기능:: 판매자와 구매자를 위한 활성 영역을 표시합니다! 이 지표는 매수 및 매도를 위한 모든 올바른 초기 임펄스 레벨/존을 보여줍니다. 진입점 검색이 시작되는 이러한 레벨/존이 활성화되면 레벨의 색상이 바뀌고 특정 음영으로 채워집니다. 또한 상황을 보다 직관적으로 이해하기 위해 화살표가 나타납니다. 더 높은 시간대의 레벨/존 표시(MTF 모드) 더 높은 시간 간격을 사용하여 레벨/존을 표시하는 기능을 추가했습니다.
TPSproTREND PrO MT5
Roman Podpora
4.89 (9)
TPSpro TREND PRO  - is a trend indicator that automatically analyzes the market and provides information about the trend and each of its changes, as well as giving signals for entering trades without redrawing! The indicator uses each candle, analyzing them separately. referring to different impulses - up or down impulse. Exact entry points into transactions for currencies, crypto, metals, stocks, indices!  Version MT4               DETAILED DESCRIPTION               R ecommended to use with an
Atbot
Zaha Feiz
4.97 (34)
AtBot: 작동 방식 및 사용 방법 ### 작동 방식 MT5 플랫폼용 "AtBot" 지표는 기술 분석 도구의 조합을 사용하여 매수 및 매도 신호를 생성합니다. 01:37 단순 이동 평균(SMA), 지수 이동 평균(EMA), 평균 진폭 범위(ATR) 지수를 통합하여 거래 기회를 식별합니다. 또한 Heikin Ashi 캔들을 사용하여 신호의 정확성을 향상시킬 수 있습니다. 구매 후 리뷰를 남기면 특별 보너스 선물을 받게 됩니다. ### 주요 기능: - 비재표시: 신호는 플로팅 후 변경되지 않습니다. - 비재작성: 신호는 일관되며 변경되지 않습니다. - 지연 없음: 지연 없이 시기적절한 신호를 제공합니다. - 다양한 시간대: 거래 전략에 맞게 모든 시간대에서 사용할 수 있습니다. ### 운영 단계: #### 입력 및 설정: - firstkey (TrendValue): 추세 감지의 민감도를 조정합니다. - Secondkey (SignalValue): 매수/매도 신호 생성의 민감도를 정의
우선 이 거래 시스템이 리페인팅, 리드로잉 및 레이그 인디케이터가 아니라는 점을 강조하는 것이 중요합니다. 이는 수동 및 로봇 거래 모두에 이상적인 것으로 만듭니다. 온라인 강좌, 설명서 및 프리셋 다운로드. "스마트 트렌드 트레이딩 시스템 MT5"은 새로운 및 경험이 풍부한 트레이더를 위해 맞춤형으로 제작된 종합적인 거래 솔루션입니다. 10개 이상의 프리미엄 인디케이터를 결합하고 7개 이상의 견고한 거래 전략을 특징으로 하여 다양한 시장 조건에 대한 다목적 선택이 가능합니다. 트렌드 추종 전략: 효과적인 트렌드 추이를 타기 위한 정확한 진입 및 손절 관리를 제공합니다. 반전 전략: 잠재적인 트렌드 반전을 식별하여 트레이더가 범위 시장을 활용할 수 있게 합니다. 스캘핑 전략: 빠르고 정확한 데이 트레이딩 및 단기 거래를 위해 설계되었습니다. 안정성: 모든 인디케이터가 리페인팅, 리드로잉 및 레이그가 아니므로 신뢰할 수 있는 신호를 보장합니다. 맞춤화: 개별 거래 선호도를 고려한 맞춤
Atomic Analyst MT5
Issam Kassas
4.42 (19)
우선적으로 언급할 점은이 거래 지표가 다시 그리지 않고 지연되지 않으며 이를 통해 수동 및 로봇 거래 모두에 이상적이라는 점입니다. 사용자 매뉴얼: 설정, 입력 및 전략. Atomic Analyst는 가격의 강도와 모멘텀을 활용하여 시장에서 더 나은 이점을 찾는 PA Price Action Indicator입니다. 고급 필터를 장착하여 잡음과 거짓 신호를 제거하고 거래 잠재력을 높이는 데 도움이 됩니다. 복잡한 지표의 다중 레이어를 사용하여 Atomic Analyst는 차트를 스캔하고 복잡한 수학적 계산을 간단한 신호와 색상으로 변환하여 초보 트레이더가 이해하고 일관된 거래 결정을 내릴 수 있도록합니다. "Atomic Analyst"는 새로운 및 경험이 풍부한 트레이더를위한 종합적인 거래 솔루션입니다. 프리미엄 지표와 최고 수준의 기능을 하나의 거래 전략에 결합하여 모든 종류의 트레이더에 대한 다재다능한 선택지가되었습니다. 인트라데이 거래 및 스캘핑 전략 : 빠르고 정확한
Trend Screener Pro MT5
STE S.S.COMPANY
4.87 (63)
트렌드 표시기, 트렌드 트레이딩 및 필터링을 위한 획기적인 고유 솔루션, 하나의 도구 안에 내장된 모든 중요한 트렌드 기능! Forex, 상품, 암호 화폐, 지수 및 주식과 같은 모든 기호/도구에 사용할 수 있는 100% 다시 칠하지 않는 다중 시간 프레임 및 다중 통화 표시기입니다. Trend Screener는 차트에 점이 있는 화살표 추세 신호를 제공하는 효율적인 지표 추세 추종 지표입니다. 추세 분석기 표시기에서 사용할 수 있는 기능: 1. 트렌드 스캐너. 2. 최대 이익 분석이 있는 추세선. 3. 추세 통화 강도 측정기. 4. 경고가 있는 추세 반전 점. 5. 경고가 있는 강력한 추세 점. 6. 추세 화살표 Trend Screener Indicator가 있는 일일 분석 예, 일일 신호 성능...등은 여기에서 찾을 수 있습니다. 여기를 클릭하십시오. LIMITED TIME OFFER : Trend Screener Indicator는 50$ 및 평생 동안만 사용할 수 있습니다
우선적으로, 이 거래 도구는 전문적인 거래에 이상적인 비-다시 그리기 및 지연되지 않는 지표입니다.  온라인 강좌, 사용자 매뉴얼 및 데모. 스마트 가격 액션 컨셉트 인디케이터는 신규 및 경험 많은 트레이더 모두에게 매우 강력한 도구입니다. Inner Circle Trader Analysis 및 Smart Money Concepts Trading Strategies와 같은 고급 거래 아이디어를 결합하여 20가지 이상의 유용한 지표를 하나로 결합합니다. 이 인디케이터는 스마트 머니 컨셉트에 중점을 두어 대형 기관의 거래 방식을 제공하고 이동을 예측하는 데 도움을 줍니다.  특히 유동성 분석에 뛰어나 기관이 어떻게 거래하는지 이해하는 데 도움을 줍니다. 시장 트렌드를 예측하고 가격 변동을 신중하게 분석하는 데 탁월합니다. 귀하의 거래를 기관 전략에 맞추어 시장의 동향에 대해 더 정확한 예측을 할 수 있습니다. 이 인디케이터는 시장 구조를 분석하고 중요한 주문 블록을 식별하
Quantum Trend Sniper
Bogdan Ion Puscasu
4.8 (49)
소개       Quantum Trend Sniper Indicator는   추세 반전을 식별하고 거래하는 방식을 변화시키는 획기적인 MQL5 지표입니다! 13년 이상의 거래 경험을 가진 숙련된 트레이더 팀이 개발한       Quantum Trend Sniper 표시기       매우 높은 정확도로 추세 반전을 식별하는 혁신적인 방법으로 거래 여정을 새로운 차원으로 끌어올리도록 설계되었습니다. ***Quantum Trend Sniper Indicator를 구입하면 Quantum Breakout Indicator를 무료로 받을 수 있습니다!*** Quantum Trend Sniper Indicator는 추세 반전을 식별하고 세 가지 이익실현 수준을 제안할 때 경고, 신호 화살표를 제공합니다. 초보자 거래자와 전문 거래자 모두에게 적합합니다. Quantum EA 채널:       여기를 클릭하세요 MT4 버전:       여기를 클릭하세요
TrendMaestro5
Stefano Frisetti
note: this indicator is for METATRADER4, if you want the version for METATRADER5 this is the link:  https://www.mql5.com/it/market/product/108106 TRENDMAESTRO ver 2.4 TRENDMAESTRO recognizes a new TREND in the bud, he never makes mistakes. The certainty of identifying a new TREND is priceless. DESCRIPTION TRENDMAESTRO identifies a new TREND in the bud, this indicator examines the volatility, volumes and momentum to identify the moment in which there is an explosion of one or more of these data a
이 대시보드는 선택한 심볼에 대해 사용 가능한 최신 고조파 패턴을 표시하므로 시간을 절약하고 더 효율적으로 사용할 수 있습니다 /   MT4 버전 . 무료 인디케이터:   Basic Harmonic Pattern 인디케이터 열 Symbol :   선택한 심볼이 나타납니다 Trend :   강세 또는 약세 Pattern :   패턴 유형(가틀리, 나비, 박쥐, 게, 상어, 사이퍼 또는 ABCD) Entry :   진입 가격 SL:   스톱로스 가격 TP1:   1차 테이크프로핏 가격 TP2:   2차 테이크프로핏 가격 TP3:   3차 테이크프로핏 가격 Current price:   현재 가격 Age (in bars):   마지막으로 그려진 패턴의 나이 주요 입력 Symbols :   "28개 주요 통화쌍" 또는 "선택한 심볼" 중에서 선택합니다. Selected Symbols :   쉼표로 구분하여 모니터링하려는 원하는 심볼("EURUSD,GBPUSD,XAUUSD")
FX Power MT5 NG
Daniel Stein
5 (5)
모닝 브리핑 여기 mql5 와 텔레그램에서 FX Power MT5 NG 는 오랫동안 인기 있는 통화 강도 측정기인 FX Power의 차세대 버전입니다. 이 차세대 강도 측정기는 무엇을 제공합니까? 기존 FX Power에서 좋아했던 모든 것 PLUS GOLD/XAU 강도 분석 더욱 정밀한 계산 결과 개별 구성 가능한 분석 기간 더 나은 성능을 위한 사용자 정의 가능한 계산 한도 특별 멀티더 많은 것을보고 싶은 사람들을위한 특별한 다중 인스턴스 설정 모든 차트에서 좋아하는 색상을위한 끝없는 그래픽 설정 수많은 알림 옵션, 중요한 것을 다시는 놓치지 않도록 Windows 11 및 macOS 스타일의 둥근 모서리가 있는 새로운 디자인 마법처럼 움직이는 인디케이터 패널 FX 파워 키 특징 모든 주요 통화의 완전한 강세 이력 모든 시간대에 걸친 통화 강세 이력 모든 브로커 및 차트에서 고유 계산 결과 100% 신뢰할 수있는 실시간100 % 신뢰할 수있는 실시간 계산-> 다시 칠하지 않음
The 1 2 3 Pattern Scanner MT5
Reza Aghajanpour
5 (18)
** All Symbols x All Timeframes scan just by pressing scanner button ** *** Contact me  to send you instruction and add you in "123 scanner group" for sharing or seeing experiences with other users. After 17 years of experience in the markets and programming, Winner indicator is ready. I would like to share with you! Introduction The 123 Pattern Scanner indicator with a special enhanced algorithm is a very repetitive common pattern finder with a high success rate . Interestingly, this Winner in
IX Power MT5
Daniel Stein
4.17 (6)
IX Power는   마침내 FX Power의 탁월한 정밀도를 외환이 아닌 기호에도 적용했습니다. 좋아하는 지수, 주식, 원자재, ETF, 심지어 암호화폐까지 단기, 중기, 장기 추세의 강도를 정확하게 파악할 수 있습니다. 단말기가 제공하는   모든 것을 분석할   수 있습니다. 사용해 보고 트레이딩   타이밍이 크게 향상되는   것을 경험해 보세요. IX Power 주요 특징 단말기에서 사용 가능한 모든 거래 심볼에 대해 100% 정확한 비재도장 계산 결과 제공 사전 구성 및 추가적으로 개별 구성 가능한 강도 분석 기간의 드롭다운 선택 가능 이메일, 메시지, 모바일 알림을 통한 다양한 알림 옵션 제공 EA 요청을 위한 액세스 가능한 버퍼 더 나은 성능을 위한 사용자 지정 가능한 계산 한도 더 많은 것을 보고 싶은 사용자를 위한 특별 다중 인스턴스 설정 모든 차트에서 좋아하는 색상을 위한 무한한 그래픽 설정 가능 Windows 11 및 macOS 스타일의 둥
Blahtech Supply Demand MT5
Blahtech Limited
4.54 (13)
Was: $299  Now: $99   Supply Demand uses previous price action to identify potential imbalances between buyers and sellers. The key is to identify the better odds zones, not just the untouched ones. Blahtech Supply Demand indicator delivers functionality previously unavailable on any trading platform. This 4-in-1 indicator not only highlights the higher probability zones using a multi-criteria strength engine, but also combines it with multi-timeframe trend analysis, previously confirmed swings
Auto Order Block with break of structure based on ICT and Smart Money Concepts (SMC) Futures Break of Structure ( BoS )             Order block ( OB )            Higher time frame Order block / Point of Interest ( POI )    shown on current chart           Fair value Gap ( FVG ) / Imbalance   -  MTF      ( Multi Time Frame )    HH/LL/HL/LH  -  MTF      ( Multi Time Frame )  Choch  MTF      ( Multi Time Frame )  Volume Imbalance     ,  MTF          vIMB Gap’s Power of 3 Equal High
Matrix Arrow Indicator MT5
Juvenille Emperor Limited
5 (12)
매트릭스 화살표 표시기 MT5 는 외환, 상품, 암호 화폐, 지수, 주식과 같은 모든 기호/도구에 사용할 수 있는 100% 다시 칠하지 않는 다중 기간 표시기를 따르는 고유한 10 in 1 추세입니다.  Matrix Arrow Indicator MT5 는 다음과 같은 최대 10개의 표준 지표에서 정보와 데이터를 수집하여 초기 단계에서 현재 추세를 결정합니다. 평균 방향 이동 지수(ADX) 상품 채널 지수(CCI) 클래식 하이켄 아시 캔들 이동 평균 이동 평균 수렴 발산(MACD) 상대 활력 지수(RVI) 상대 강도 지수(RSI) 포물선 SAR 스토캐스틱 오실레이터 윌리엄스의 백분율 범위 모든 지표가 유효한 매수 또는 매도 신호를 제공하면 강력한 상승/하락 추세를 나타내는 다음 캔들/막대가 시작될 때 해당 화살표가 차트에 인쇄됩니다. 사용자는 사용할 표시기를 선택하고 각 표시기의 매개변수를 개별적으로 조정할 수 있습니다. 매트릭스 화살표 표시기 MT5는 선택한 표시기에서만 정보를 수
Entry Points Pro for MT5
Yury Orlov
4.46 (124)
다시 색을 칠하지 않고 거래에 진입할 수 있는 정확한 신호를 제공하는 MT5용 지표입니다. 외환, 암호화폐, 금속, 주식, 지수 등 모든 금융 자산에 적용할 수 있습니다. 매우 정확한 추정값을 제공하고 매수와 매도의 가장 좋은 시점을 알려줍니다. 하나의 시그널로 수익을 내는 지표의 예와 함께 비디오 (6:22)시청하십시오! 대부분의 거래자는 Entry Points Pro 지표의 도움으로 첫 거래 주 동안 트레이딩 결과를 개선합니다. 저희의   Telegram Group 을 구독하세요! Entry Points Pro 지표의 좋은점. 재도색이 없는 진입 신호 신호가 나타나고 확인되면(시그널 캔들이 완성된 경우) 신호는 더 이상 사라지지 않습니다. 여타 보조지표의 경우 신호를 표시한 다음 제거되기 때문에 큰 재정적 손실로 이어집니다. 오류 없는 거래 게시 알고리즘을 통해 트레이드(진입 또는 청산)를 할 이상적인 순간을 찾을 수 있으며, 이를 통해 이를 사용하는 모든 거래자의
FxaccurateLS
Shiv Raj Kumawat
WHY IS OUR FXACCCURATE LS MT5 THE PROFITABLE ? PROTECT YOUR CAPITAL WITH RISK MANAGEMENT Gives entry, stop and target levels from time to time. It finds Trading opportunities by analyzing what the price is doing during established trends. POWERFUL INDICATOR FOR A RELIABLE STRATEGIES We have made these indicators with a lot of years of hard work. It is made at a very advanced level. Established trends provide dozens of trading opportunities, but most trend indicators completely ignore them!
AT Forex Indicator MT5
Marzena Maria Szmit
5 (4)
The AT Forex Indicator MT5 is a sophisticated trading tool designed to provide traders with a comprehensive analysis of multiple currency pairs. This powerful indicator simplifies the complex nature of the forex market, making it accessible for both novice and experienced traders. AT Forex Indicator uses advanced algorithms to detect trends, patterns and is an essential tool for traders aiming to enhance their forex trading performance. With its robust features, ease of use, and reliable signal
ICT, SMC, SMART MONEY CONCEPTS, SMART MONEY, Smart Money Concept, Support and Resistance, Trend Analysis, Price Action, Market Structure, Order Blocks, BOS/CHoCH,   Breaker Blocks ,  Momentum Shift,   Supply&Demand Zone/Order Blocks , Strong Imbalance,   HH/LL/HL/LH,    Fair Value Gap, FVG,  Premium  &   Discount   Zones, Fibonacci Retracement, OTE, Buy Side Liquidity, Sell Side Liquidity, BSL/SSL Taken, Equal Highs & Lows, MTF Dashboard, Multiple Time Frame, BigBar, HTF OB, HTF Market Structure
Advanced Supply Demand MT5
Bernhard Schweigert
4.5 (14)
현재 33% 할인! 초보자나 전문 트레이더를 위한 최고의 솔루션! 이 보조지표는 우리가 다수의 독창적 기능과 새로운 공식을 통합한 독특하고 고품질이며 저렴한 거래 도구입니다. 이 업데이트를 통해 이중 시간대를 표시할 수 있습니다. 더 높은 TF를 표시할 수 있을 뿐만 아니라 차트 TF와 더 높은 TF 모두를 표시할 수 있습니다: 중첩 영역 표시. 모든 Supply Demand 트레이더들이 좋아할 것입니다. :) 중요한 정보 공개 Advanced Supply Demand의 잠재력을 극대화하려면 다음을 방문하십시오. https://www.mql5.com/ko/blogs/post/720245   진입 또는 목표의 명확한 트리거 포인트를 정확히 찾아냄으로 해서 거래가 어떻게 개선될지 상상해 보십시오. 새로운 알고리즘을 기반으로 매수자와 매도자 간의 잠재적인 불균형을 훨씬 더 쉽게 분간할 수 있습니다. 왜냐하면 가장 강한 공급영역과 가장 강한 수요 영역과 과거에 어떻게 진행 되었는지를(이
TPA True Price Action indicator reveals the true price action of the market makers through 100% non-repainting signals strictly at the close of a candle! TPA shows entries and re-entries, every time the bulls are definitely stronger than the bears and vice versa. Not to confuse with red/green candles. The shift of power gets confirmed at the earliest stage and is ONE exit strategy of several. There are available now two free parts of the TPA User Guide for our customers. The first "The Basics"
XQ Indicator MetaTrader 5
Marzena Maria Szmit
3 (2)
Step into the realm of Forex trading with confidence and precision using XQ, a cutting-edge Forex indicator designed to elevate your trading game to unprecedented heights. Whether you're a seasoned trader or just stepping into the world of currency exchange, XQ Forex Indicator empowers you with the insights and signals needed to make informed trading decisions. The signal conditions are a combination of three indicators, and XQ Forex Indicator only display  medium and long-term trends . The ind
PZ Swing Trading MT5
PZ TRADING SLU
5 (4)
Protect against whipsaws: revolutionize your swing trading approach Special Offer: Purchase now to receive free bonuses worth $135! (Read more for details) Swing Trading is the first indicator designed to detect swings in the direction of the trend and possible reversal swings. It uses the baseline swing trading approach, widely described in trading literature. The indicator studies several price and time vectors to track the aggregate trend direction and detects situations in which the market i
Trade smarter, not harder: Empower your trading with Harmonacci Patterns Special Offer: Purchase now to receive free bonuses worth $165! (Read more for details) This is arguably the most complete harmonic price formation auto-recognition indicator you can find for the MetaTrader Platform. It detects 19 different patterns, takes fibonacci projections as seriously as you do, displays the Potential Reversal Zone (PRZ) and finds suitable stop-loss and take-profit levels. [ Installation Guide | Up
FX Volume MT5
Daniel Stein
4.93 (14)
모닝 브리핑을 통해 세부 정보와 스크린샷으로 매일 시장 업데이트를 받으세요 여기 mql5 및 텔레그램에서 FX 거래량은 브로커의 관점에서 시장 심리에 대한 실제 통찰력을 제공하는 최초이자 유일한 거래량 지표입니다. 브로커와 같은 기관 시장 참여자가 외환 시장에서 어떤 포지션을 취하고 있는지에 대한 훌륭한 통찰력을 COT 보고서보다 훨씬 빠르게 제공합니다. 차트에서 이 정보를 직접 확인하는 것은 트레이딩의 진정한 판도를 바꾸고 획기적인 솔루션입니다. 다음과 같은 고유한 시장 데이터 인사이트의 이점 비율 는 통화의 매수/매도 포지션 비율을 백분율로 표시 비율 변화 는 선택한 기간 내 매수 비율과 비율 변화를 표시 총 거래량 는 해당 통화의 총 거래량(롱 및 숏)을 로트 단위로 보여줍니다 Volumes Long 는 해당 통화의 모든 롱 포지션의 거래량을 보여줍니다 Volumes Short 는 해당 통화의 모든 숏 포지션의 거래량을 보여줍니다 Net Long 는 순 롱 포지션의 거래량
PZ Support Resistance MT5
PZ TRADING SLU
4.17 (6)
Unlock key market insights with automated support and resistance lines Special Offer: Purchase now to receive free bonuses worth $75! (Read more for details) Tired of plotting support and resistance lines? This is a multi-timeframe indicator that detects and plots supports and resistance lines in the chart with the same precision as a human eye would. As price levels are tested over time and its importance increases, the lines become thicker and darker, making price leves easy to glance and ev
Gold Trend 5
Sergei Linskii
5 (1)
금 추세 - 좋은 주식 기술 지표입니다. 인디케이터 알고리즘은 자산의 가격 움직임을 분석하고 변동성과 잠재적 진입 구간을 반영합니다. 최고의 지표 신호: - 매도 = 빨간색 히스토그램 + 빨간색 숏 포인터 + 같은 방향의 노란색 신호 화살표. - 매수 = 파란색 히스토그램 + 파란색 롱 포인터 + 같은 방향의 아쿠아 신호 화살표. 인디케이터의 장점 1. 표시기는 높은 정확도로 신호를 생성합니다. 2. 확인된 화살표 신호는 추세가 바뀔 때만 다시 그릴 수 있습니다. 3. 모든 브로커의 메타트레이더 5 거래 플랫폼에서 거래할 수 있습니다. 4. 모든 자산(통화, 금속, 암호화폐, 주식, 지수 등)을 거래할 수 있습니다. 5. H1 차트주기(중기 트레이딩)에서 거래하는 것이 좋습니다. 6. 지표 설정에서 개별 매개 변수(TF, 색상 등)를 변경할 수 있으므로 각 트레이더가 지표를 쉽게 사용자 지정할 수 있습니다. 7. 이 보조지표는 독립적인 트레이딩 시스템뿐만 아니
이 대시보드는 선택한 기호에 대한 거래 전략에 따라 스캘핑 모드와 장기 모드 모두에서 차트의 공급 및 수요 영역을 검색하고 표시합니다. 또한 대시보드의 스캐너 모드를 통해 원하는 모든 기호를 한눈에 확인하고 적합한 위치를 놓치지 않도록 도와줍니다 / MT4 버전 . 무료 보조지표:   Basic Supply Demand 특징 여러 통화쌍에 대한 거래 기회를 볼 수 있으며, 공급 및 수요 영역에 대한 근접성에 따라 순위가 매겨진 모든 쌍을 명확하고 간결하게 볼 수 있습니다. 색상부터 감지 매개변수까지 특정 요구에 맞게 사용자 지정 설정 가능 주요 입력 Indicator mode :   표시기 모드 또는 새로운 기능이 포함된 패널 모드 중에서 선택 가능 Symbols :   "28개 주요 통화쌍" 또는 "선택한 심볼" 중에서 선택 Selected Symbols :   쉼표로 구분하여 모니터링하려는 원하는 심볼("EURUSD, GBPUSD, XAUUSD")을 선택합
Price Action Finder Multi MT5
Siarhei Vashchylka
5 (5)
The Price Action Finder Multi indicator is an indicator of entry points that searches for and displays Price Action system patterns on dozens of trading instruments and on all standard time frames: (m1, m5, m15, m30, H1, H4, D1, Wk, Mn). The indicator places the found patterns in a table at the bottom of the screen. By clicking on the pattern names in the table, you can move to the chart where this pattern is located. Manual (Be sure to read before purchasing) | Version for MT4 Advantages 1. Pa
제작자의 제품 더 보기
Ultimate Gold Advisor for MetaTrader 4 – 성공을 보장하는 최첨단 거래 도구! Ultimate Gold Advisor는 단순한 지표 그 이상입니다. MetaTrader 4에서 거래 접근 방식을 혁신적으로 변화시킬 기술의 보석입니다. 가장 까다로운 트레이더의 요구를 충족하도록 설계된 이 최첨단 지표는 외과적 정밀성, 정교한 분석, 강력한 기능을 결합하여 시장에서 무적의 경쟁 우위를 제공합니다. 금 거래에 최적화되어 있지만 다양한 자산에 활용할 수 있는 Ultimate Gold Advisor는 귀하의 진정한 수익 잠재력을 열 수 있는 열쇠입니다. Ultimate Gold Advisor가 모든 트레이더에게 필수적인 이유는 무엇인가요? 탁월한 성능: 최대 89%에 이르는 놀라운 성공률을 자랑하는 이 지표는 단순히 신뢰할 수 있을 뿐만 아니라 매우 효과적입니다. 모든 승리 및 패배 거래가 차트에 명확하게 표시되어 귀하의 전략의 진정한 잠재력을 실시간으로 확인할
Follow Line 지표는 시장 트렌드를 정확하게 식별하고 따라가는 트레이더에게 필수적인 도구입니다. 이 지표는 가격 변동에 따라 동적으로 조정되며, 가격 움직임을 매끄럽고 지속적으로 추적하는 선을 그립니다. 시각적으로 단순하고 트렌드 변화를 신호하는 데 효과적인 Follow Line은 모든 트레이더의 전략에 훌륭한 추가 요소가 됩니다. 주요 특징: 트렌드 추적: Follow Line은 가격을 면밀히 추적하여 트레이더가 진행 중인 시장 트렌드를 쉽게 식별할 수 있도록 합니다. 시각적 단순성: 명확하고 잘 정의된 선으로, 경험이 적은 트레이더도 시장 방향을 빠르게 이해할 수 있습니다. 적응성: 다양한 시간대와 도구에서 작동하여, 데이 트레이딩에서 스윙 트레이딩까지 다양한 거래 전략에 이상적입니다. 사용 방법: 설치: 분석하려는 금융 상품의 차트에 Follow Line 지표를 추가합니다. 설정: 거래 전략에 맞게 지표의 매개변수를 조정합니다. 트렌드 분석: Follow Line 선을
MetaTrader 5 무료 스프레드 지표 이 지표는 MetaTrader 5에서 스프레드에 대한 자세한 분석을 제공합니다. 스프레드는 자산의 매수 가격(Ask)과 매도 가격(Bid) 간의 차이를 나타내므로, 트레이더에게 중요한 매개변수 중 하나입니다. 지표에는 다음이 포함됩니다: 평균 스프레드 : 당일 관찰된 최고 스프레드와 최저 스프레드 간의 평균으로 계산됩니다. 현재 스프레드 : 현재 시장 스프레드를 표시합니다. 최저 스프레드 : 당일 기록된 최저 스프레드 값을 보여줍니다. 최대 스프레드 : 당일 기록된 최대 스프레드 값을 보여줍니다. 이 지표는 시장 상황에 대한 명확하고 즉각적인 뷰를 제공하도록 설계되었으며, 트레이더가 거래 비용을 보다 잘 평가하고 전략에 영향을 미칠 수 있는 스프레드 변동을 식별할 수 있도록 도와줍니다. 제 제품에 관심이 있으시면 다음 페이지를 방문해 보세요: 전문가 자문 : https://www.mql5.com/it/market/product/119456?
FREE
FREE Spread indicator for MetaTrader 4 this indicator includes: -average spread -current spread -minimum spread -maximum spread If you are interested in my products I recommend you visit my page where you can find: Experts Advisors:  https://www.mql5.com/it/market/product/119456?source=Site+Profile indicators:  https://www.mql5.com/it/market/product/120038?source=Site+Profile I hope the spread indicator will be useful to you. https://www.mql5.com/it/users/kappa05
FREE
Enhance Your Trading Strategies with the "Order Block" Indicator for MT4 Discover the "Order Block" Indicator: The "Order Block" Indicator for MT4 is designed to help you precisely identify order blocks in the market by marking the highs and lows of the order block candles. This powerful tool enables you to understand where large institutions place their orders, improving your ability to predict market movements. Key Features: Precise Order Block Detection: Automatically highlights the highs and
IMPORTANT: The indicator will remain at the price of $34.90 until the release of the update scheduled for July 16, 2024. The New Price will be $49.90 (taxes excluded) FVG indicator. If you are an SMC trader this indicator will be very useful to you, it automatically identifies the FVGs on the graph distinguishing them into 2 types: bearish FVGs and bullish FVGs (see the photos to understand better). This indicator works on any Timeframe and on any market you want to use it. If you are interested
Volume Profile Indicator for MT4 Gain a trading edge with the "Volume Profile" indicator for MetaTrader 4 (MT4). This advanced technical analysis tool allows you to precisely identify key support and resistance levels based on transaction volume. Easily visualize market areas of high interest, where trading volumes are highest, and use this information to make more informed trading decisions. Key Features: Clear and detailed visualization : The indicator displays volume histograms directly on th
Presentation of the "Color Range Indicator" The "Color Range Indicator" is a powerful technical analysis tool designed for the MT4 platform, perfect for traders who want a clear and immediate view of market trends. This indicator draws a colored line based on the current trend, making it easier to interpret price movements. Indicator Description: Green line : Indicates an uptrend. Use this signal to consider buying opportunities. Red line : Indicates a downtrend. Use this signal to consider sell
"Real Time MultiIndicator"란 무엇인가요? "Real Time MultiIndicator"는 기술 분석을 단순화하고 최적화하기 위해 설계된 고급 거래 도구입니다. 이 혁신적인 지표는 여러 시간 프레임과 기술 지표에서 신호를 수집하여 하나의 명확하고 읽기 쉬운 표로 표시합니다. 차트를 계속 변경하거나 각 지표를 수동으로 분석하지 않고도 시장에 대한 전체적이고 상세한 통찰을 원하신다면, "Real Time MultiIndicator"가 최적의 솔루션입니다. 왜 "Real Time MultiIndicator"를 선택해야 하나요? 다중 시간 프레임 분석: "Real Time MultiIndicator"는 다양한 시간 프레임에서 시장을 동시에 모니터링할 수 있게 해줍니다. M15에서 H4까지, 이 지표는 각 시간 프레임에서 추세가 상승 중인지 하락 중인지를 명확하게 보여주어 시장의 전체적인 모습을 바탕으로 정보를 기반으로 한 결정을 내릴 수 있도록 도와줍니다. 다양한 지표
9월 1일 일요일까지 77.90달러에서 37.90달러로 할인 "Forex Scanner"란 무엇입니까? "Forex Scanner"는 실시간으로 외환 시장에 대한 포괄적인 개요를 제공하도록 설계된 강력한 거래 도구입니다. 이 고급 지표는 여러 기술 지표와 시간 프레임에서 주요 데이터를 수집하여 거래 기회를 신속하게 식별할 수 있게 해줍니다. 여러 자산과 매개변수를 모니터링하면서 차트를 변경하지 않고자 한다면 "Forex Scanner"는 완벽한 솔루션입니다. "Forex Scanner"를 선택해야 하는 이유는 무엇입니까? 다중 시간대 스캔: "Forex Scanner"는 분 단위에서 시간 단위까지 다양한 시간대에서 시장을 모니터링할 수 있게 해줍니다. 이 도구는 여러 시간 레벨에서 추세 및 거래 신호를 즉시 식별할 수 있도록 도와주며, 완전하고 상세한 시장 뷰에 따라 조치를 취할 수 있게 해줍니다. 다중 지표 통합: 이 지표는 ATR, RSI, 스토캐스틱, ADX, 피벗 및 MA와
Enhanced RSI는 트레이더에게 더 포괄적이고 정확한 시장 분석을 제공하기 위해 설계된 다재다능하고 맞춤화 가능한 기술 지표입니다. 이동 평균, RSI 및 MACD의 최고의 기능을 결합하여 이 지표는 모멘텀과 트렌드 강도에 대한 다차원적 관점을 제공합니다. 주요 특징: 완벽한 하이브리드화: Enhanced RSI는 이동 평균, RSI 및 MACD의 기능을 결합하여 가격 움직임에 대한 보다 완전한 그림을 제공합니다. 최대 유연성: 맞춤화 가능한 기간을 통해 이 지표는 모든 거래 스타일과 시간 프레임에 적응합니다. 다양한 활용: Forex부터 암호화폐, 주식, 지수에 이르기까지 모든 금융 자산에 대해 작동합니다. 분석 지원: Enhanced RSI는 자동 거래 시스템이 아니라 유용한 신호와 확인을 제공하여 기술 분석을 보완하는 도구입니다. 작동 방식: Enhanced RSI는 RSI의 지수 이동 평균을 계산하고 이를 MACD에서 나온 신호와 결합합니다. 그 결과는 과매수 및 과매도
MetaTrader 5용 Dynamic Cycle Indicator – 사이클 트레이딩에서의 당신의 이점! Dynamic Cycle Indicator 는 MetaTrader 5 에서 시장 주기를 정확하게 식별하고 거래 전략을 최적화할 수 있는 궁극적인 도구입니다. 고급 주기 분석 알고리즘을 기반으로, 이 지표는 전환점을 감지하고 향후 가격 움직임을 예측하는 데 있어 전례 없는 이점을 제공합니다. Dynamic Cycle Indicator가 독특한 이유는 무엇입니까? 완벽한 주기 식별 : 시장의 변동을 정밀하게 분석하여, 지표는 주기를 자동으로 감지하고 차트에 명확한 기호로 전환점을 표시합니다. 이러한 포인트는 최적의 진입 및 종료 시점을 식별하는 데 필수적입니다. 즉각적인 시각적 신호 : 차트의 빨간색 및 파란색 화살표는 피크 및 저점 신호를 명확하게 보여줍니다. 이러한 시각적 지표는 방향 변화에 대한 예측을 보다 자신 있게 할 수 있게 하여 타이밍 정확도를 높입니다. 해석의 용이성
Forex Scalper Indicator – 금융 시장에서 수익을 창출하는 정밀 도구 MT4용 Forex Scalper Indicator는 시장에서 최대한의 정밀도로 스캘핑하려는 모든 트레이더에게 완벽한 동반자입니다. 정확한 데이터에 기반한 분석 덕분에 이 지표는 빠른 의사 결정을 내리는 데 이상적인 적시의 정확한 신호를 제공합니다. 맞춤형 정밀도 차트에 표시되는 각 화살표는 신중한 계산을 기반으로 하며 최고의 진입 및 종료 기회를 제공합니다. 이들은 임의의 신호가 아닌 실시간으로 시장을 분석하는 정확한 지침입니다. 전환점의 정확한 감지 이 지표는 가격의 잠재적인 전환점을 높은 정확도로 식별하여 트레이딩에 필수적인 도구가 됩니다. 신뢰할 수 있는 데이터를 기반으로 생성된 신호 덕분에 시장의 가장 변동성이 큰 시기에도 수익을 극대화할 수 있습니다. 깨끗하고 읽기 쉬운 인터페이스 스크린샷에서 볼 수 있듯이 Forex Scalper Indicator는 차트에 명확하고 깔끔
OB Indicator
Nicola Capatti
Order Block indicator, highs and lows; the indicator focuses mainly on OBs, on the chart they are represented with a horizontal line on the minimum and maximum of that candle. While for the maximums and minimums only one line is marked (see the images to understand better). The indicator is for MT5, it works on all Timeframes, on any Forex Pair, on any index and on crypto markets. (For any information on the indicator do not hesitate to contact me). Limited time discount (50%) 74.90$ -> 38.60$
Expert Advisor for scalping; This EA was built for monthly profitability. Works on any asset: Forex, Indices, Crypto and Stocks. Perfectly usable in MT5 tester and usable on any TimeFrame. The EA has various inputs available to customize operations: -Lots -Risk% (0 = Fix) -OrderDist (the distance between one order and another, the distance is calculated in points not pips) -TP (in points) -Sl (in points) -TrailingStopTrigger(the trailing stop trigger point in points) -TrailingStop(distance from
Panel Info Trade For MT5; The indicator has 2 main objects: -An icon chart that you can change Timeframe, zoom, Forex Pair, crypto....the position of the graph can be modified via the (x;y) inputs. The chart is perfectly usable in the MT5 tester. If the graph isn't for you and doesn't help you with anything, you can press the button on the top right to make it smaller. -the second object is a dynamic control panel where you can change plots, place sl and tp, BE, close partial... (if you watch th
통화 강도 지수 (Currency Strength Index - CSI) 지표 지표를 활성화하기 전에 "TRUE"로 설정하여 페어를 표시하도록 하십시오 통화 강도 지수 (Currency Strength Index - CSI) 지표는 주요 통화의 상대 강도를 측정하는 데 사용되는 강력한 도구입니다. 이 지표는 거래자가 특정 시점에서 가장 강한 통화와 가장 약한 통화를 식별하는 데 도움을 주어 더 정보에 기반한 거래 결정을 내릴 수 있게 합니다. 주요 특징: 비교 분석: 역사적 및 현재 데이터를 기반으로 다양한 통화의 강도를 비교합니다. 거래 신호: 상대적인 강도를 기준으로 최적의 통화 쌍을 식별하는 데 도움이 됩니다. 사용자 정의: 사용자는 계산 기간 및 기타 매개변수를 구성하여 자신의 거래 전략에 맞출 수 있습니다. 직관적인 시각화: 정보를 명확하고 시각적으로 제시하여 데이터 해석을 용이하게 합니다. 사용 방법: 설치: 원하는 통화 쌍의 차트에 CSI 지표를 추가하십시오. 설정: 계
In the world of trading, the key to success lies in having the right tools at the right time. Our innovative Volume Profile indicator was developed with one goal in mind: to provide traders with unprecedented access to vital market activity information. This cutting-edge tool allows you to not only see where and when volumes are traded but also to understand market depth with clarity never seen before. Main Features: Temporal Flexibility: Set the analysis range up to 1800 minutes to perfectly ma
Maximize Your Trading Opportunities with the "Auto Trendlines" Indicator Discover the "Auto Trendlines" Indicator: "Auto Trendlines" is the essential tool for every technical trader. This indicator automatically plots trend lines, pinpointing support and resistance levels with surgical precision. It's ideal for those looking to capitalize on market breakouts and reversals. Key Features: Automatic Trendline Plotting: Identifies and draws crucial trend lines without manual intervention. Advanced C
AutoFibo for MT5
Nicola Capatti
Optimize Your Trading Decisions with the "autoFibo" Indicator Discover the "autoFibo" Indicator: "autoFibo" is the essential analysis tool for traders who want to fully leverage Fibonacci levels without the hassle of manual plotting. This indicator automates the Fibonacci retracement process, providing instant visual access to key support and resistance zones. Key Features: Automatic Fibonacci Retracement: Automatically plots Fibonacci levels, making it easy to identify support and resistance zo
Enhance Your Trading Performance with the "Better Volume" Indicator Discover the "Better Volume" Indicator: The "Better Volume" is the essential market volume analysis tool for traders aiming to stand out. It analyzes tick volumes with unprecedented accuracy, featuring an advanced moving average function (PERIOD_MA) and customizable buy and sell alerts. Key Features: Advanced Volume Analysis: Recognize volume peaks signaling crucial price movements. Intuitive Buy and Sell Alerts: Stay one step a
SuperTrend 는 트렌드 방향을 식별하고 진입 및 종료 신호를 생성하기 위해 거래에서 가장 효과적이고 널리 사용되는 기술 지표 중 하나입니다. 변동성과 트렌드를 기반으로 하는 이 지표는 시장 상황에 동적으로 적응하여 트레이더에게 명확한 시각적 참고 자료를 제공합니다. 주요 특징: 트렌드 탐지: SuperTrend는 시장 트렌드를 따라가며 하락 트렌드에서는 가격 위에, 상승 트렌드에서는 가격 아래에 선을 그립니다. 사용 용이성: 직관적인 그래픽 표현 덕분에 경험이 적은 트레이더도 쉽게 해석할 수 있습니다. 진입/종료 신호: 가격이 SuperTrend 라인을 위로 교차할 때 매수 신호를 생성하고 아래로 교차할 때 매도 신호를 생성합니다. 적응성: 다양한 시간 프레임과 도구에서 작동하여 일간 거래부터 스윙 거래에 이르기까지 다양한 거래 스타일에 맞게 다재다능합니다. 사용 방법: 설치: 분석하려는 금융 상품의 차트에 SuperTrend를 추가합니다. 설정: 거래 전략에 맞게 주기 및
새로운 통합 지표 - 3 in 1 시장 분석과 투자 전략을 향상시킬 거래 도구를 찾고 계십니까? 저희는 최고의 지표 세 가지를 강력하고 편리한 하나의 솔루션으로 결합하여, 거래에서 최고의 가치를 얻을 수 있도록 했습니다. 1. 오더 블록 지표 (이전에 32.90$에 판매됨) 오더 블록 지표는 시장에서 중요한 기관의 관심 영역을 식별하는 데 필수적인 도구입니다. 이 지표는 오더 블록 캔들의 고점과 저점을 표시하며, 이는 가격 반전이나 추세 지속이 발생할 수 있는 중요한 영역을 나타냅니다. 단독으로 사용될 때, 오더 블록 지표는 잠재적인 지지 및 저항 영역을 식별하여 더 나은 거래 결정을 내릴 수 있도록 도와줍니다. 링크: https://www.mql5.com/it/market/product/121633?source=Site+Market+MT5+Search+Rating006%3aorderblock+indicator 2. FVG 지표 (이전에 34.90$에 판매됨) FVG 지표는 공정 가
FVG for MT5
Nicola Capatti
"Fair Value Gap" (FVG) 인디케이터 - 시장 불균형의 힘을 발견하세요 트레이딩 세계는 숨겨진 기회로 가득 차 있지만, 적절한 도구를 가진 사람만이 이를 효과적으로 식별하고 활용할 수 있습니다. 우리의 FVG 인디케이터 는 이를 돕기 위해 설계되었습니다. 시장을 읽는 능력을 향상시키고 최적의 진입 및 퇴출 포인트를 찾고자 하는 트레이더에게 FVG 인디케이터는 완벽한 동반자입니다. Fair Value Gap (FVG)이란 무엇인가요? Fair Value Gap의 개념은 가격 차트에 "갭"을 생성하는 공급과 수요 사이의 불균형을 나타냅니다. 이 갭은 가격이 이 불균형을 채우기 위해 다시 돌아올 수 있는 영역을 나타내며, 이 영역은 잠재적으로 가치 있는 트레이딩 기회입니다. 이러한 갭은 가격이 급격히 움직일 때 발생하며, 향후 시장 행동을 이해하는 열쇠가 될 수 있습니다. 왜 FVG 인디케이터가 중요한가요? FVG 인디케이터는 차트에서 이 불균형 영역을 쉽게 식별하고 가격이
"Schaff RSX"란 무엇입니까? "Schaff RSX"는 상대 강도 지수(RSX)의 효율성을 Schaff 사이클의 정밀성과 결합하여 시장에 진입하고 퇴출할 최고의 순간을 쉽게 식별할 수 있는 독특한 지표를 만듭니다. 이는 숨겨진 거래 기회를 감지하는 레이더를 보유하는 것과 같으며, 다른 트레이더가 무시할 수 없는 경쟁 우위를 제공합니다. 왜 "Schaff RSX"를 선택해야 합니까? 명확하고 직관적인 시각적 단순성 : "Schaff RSX"의 색상과 라인은 시장이 과매수 또는 과매도 상태에 있을 때를 명확하게 보여줍니다. 더 이상 직관이나 운에 의존할 필요가 없습니다. 정확하고 신뢰할 수 있는 정보가 바로 앞에 있습니다. 완벽하게 사용자 정의 가능 : 각 트레이더는 자신의 전략을 가지고 있으며, "Schaff RSX"는 귀하의 전략에 완벽하게 적응합니다. 원하는 결과를 정확하게 얻기 위해 매개변수를 원하는 대로 구성할 수 있습니다. 모든 거래 스타일에 적합 : 귀하가 데이 트레
MetaTrader 5용 **"Positions Manager"**는 포지션 관리를 효율적이고 자동화된 방식으로 최적화하려는 트레이더에게 필수적인 도구입니다. 이 고급 도구는 트레이더가 자신의 작업을 제어하고 위험 관리를 개선하며 Break Even 및 Trailing Stop과 같은 기능을 통해 잠재적인 수익을 극대화할 수 있도록 설계되었습니다. 주요 기능: 자동 Break Even: Break Even을 활성화하는 옵션을 통해 "Positions Manager"는 시장이 트레이더에게 유리하게 움직일 때 이익을 보호할 수 있습니다. 활성화를 위한 핍(pip) 거리를 설정하고 수수료를 충당하기 위한 추가 핍을 추가할 수 있습니다. 동적 Trailing Stop: Trailing Stop을 활성화하여 시장 움직임을 추적하고 수익을 보호하십시오. 이 기능은 가격 움직임에 따라 자동으로 조정되어 시장이 유리한 한 포지션을 유지하고 트렌드가 반전될 때 자동으로 포지션을 종료할 수 있습니다.
Smart Fractals Indicator - MT5 거래를 위한 강화된 프랙탈 Smart Fractals는 당신이 알고 있는 클래식 프랙탈 지표의 진화입니다. MetaTrader 5를 위해 특별히 설계된 이 지표는 단순히 시장의 전통적인 반전 지점을 식별하는 것에 그치지 않고, 더 나아가 거래를 보다 효율적이고 수익성 있게 만들어 줍니다. 우리는 프랙탈의 기본 개념을 바탕으로 더 똑똑하고 기능적인 도구로 변환시켰습니다. 주요 특징: 매수 및 매도 신호: 전통적인 프랙탈이 시장의 전환점을 나타내는 것 외에도, Smart Fractals는 노란색과 보라색 화살표로 차트에 직접 표시되는 매수 및 매도 신호를 포함합니다. 이러한 신호는 보다 자신감을 가지고 포지션에 진입할 수 있게 해줍니다. 개선된 시각화: 각 프랙탈은 명확하고 직관적으로 표시되며, 사용자가 설정할 수 있는 색상을 통해 '상승' 및 '하락' 프랙탈을 구분할 수 있습니다. 또한 시장 구조의 붕괴를 나타내는 구조적 돌파 (
필터:
리뷰 없음
리뷰 답변