Boeta Rsi
- 지표
- Pieter Gerhardus Van Zyl
- 버전: 1.0
- 활성화: 10
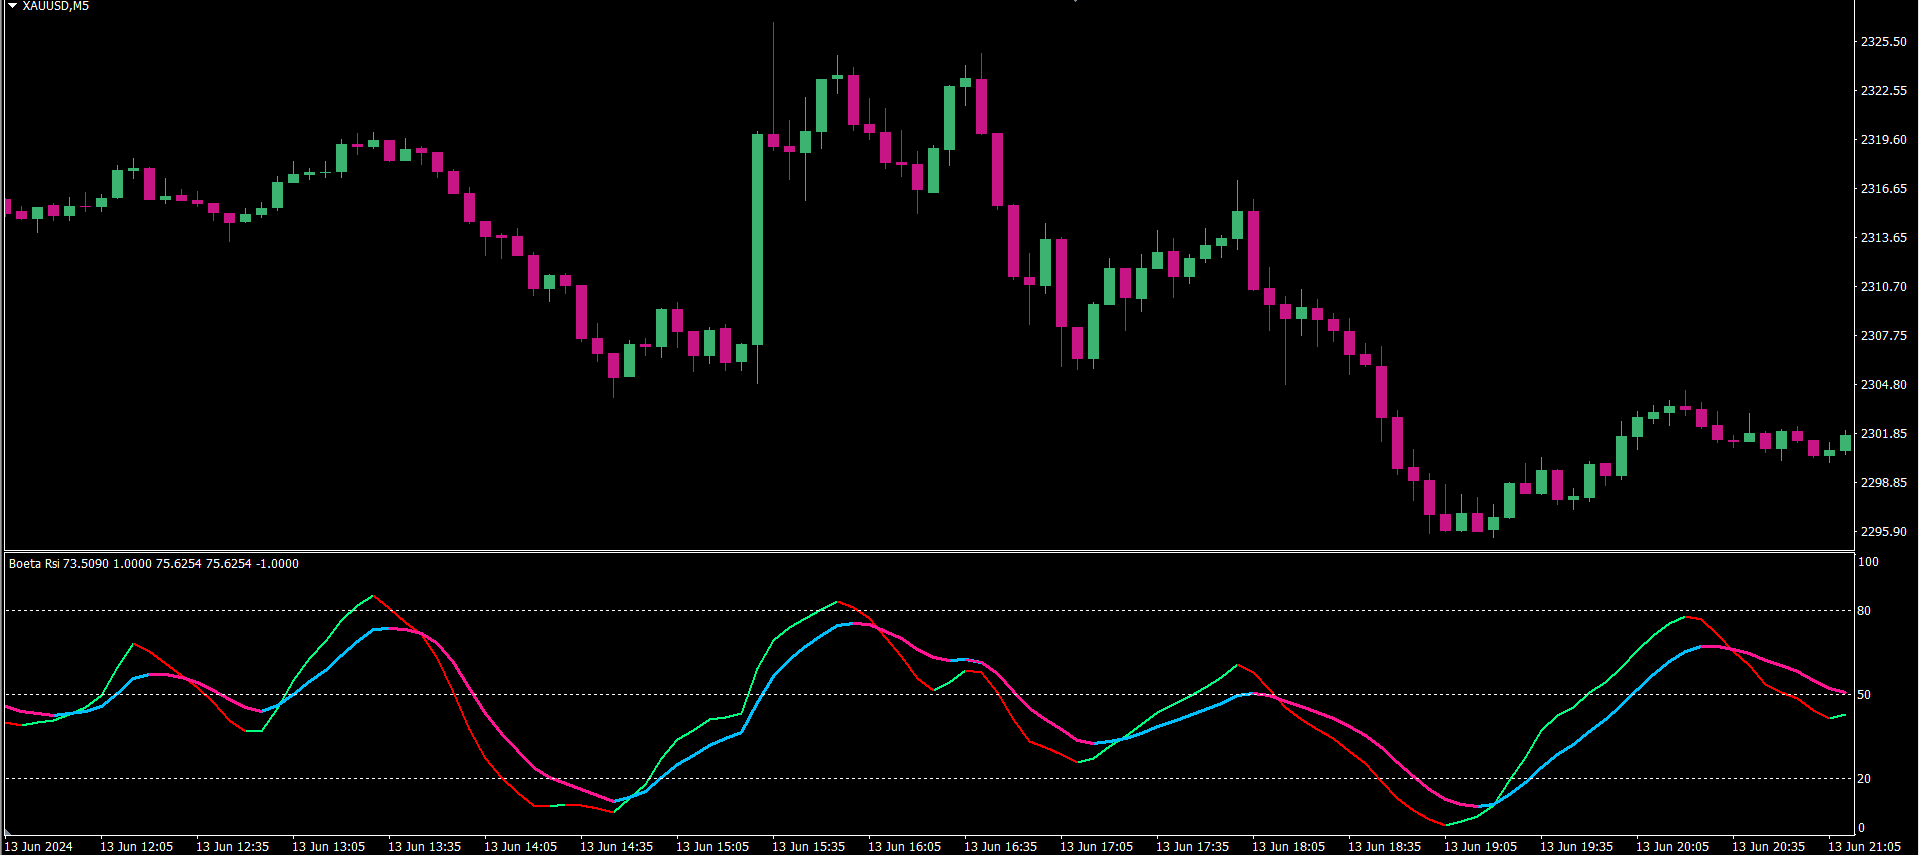
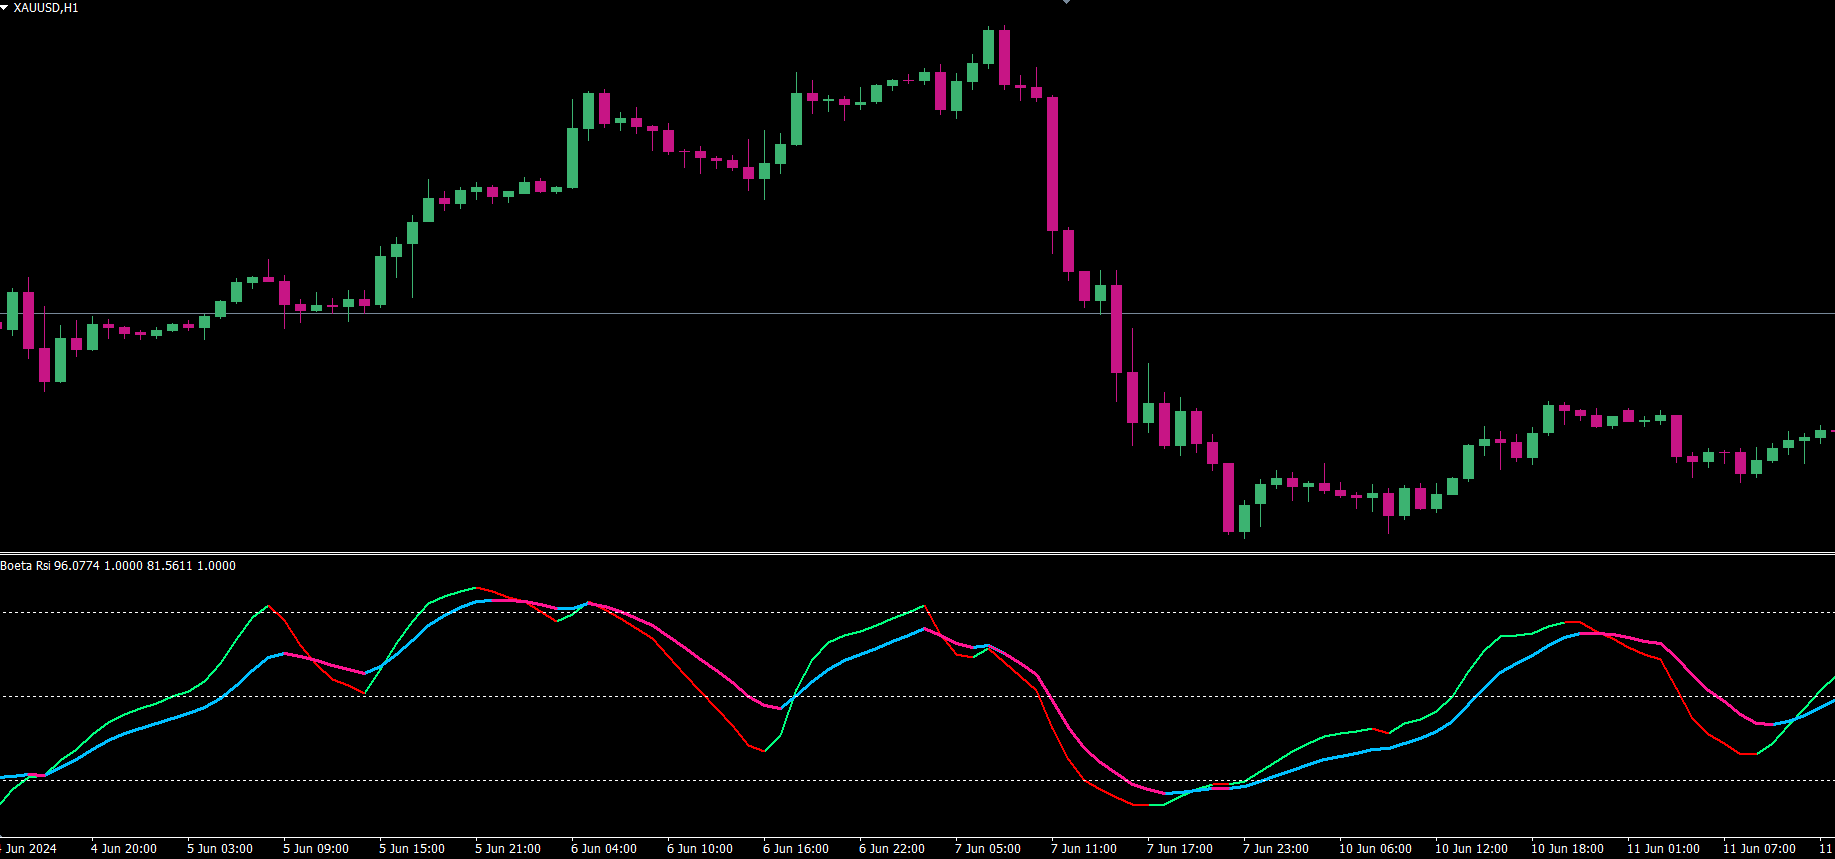
The indicator is a double Rsi based oscillator with color change.
The coloring sometimes repaints because of smoothing.
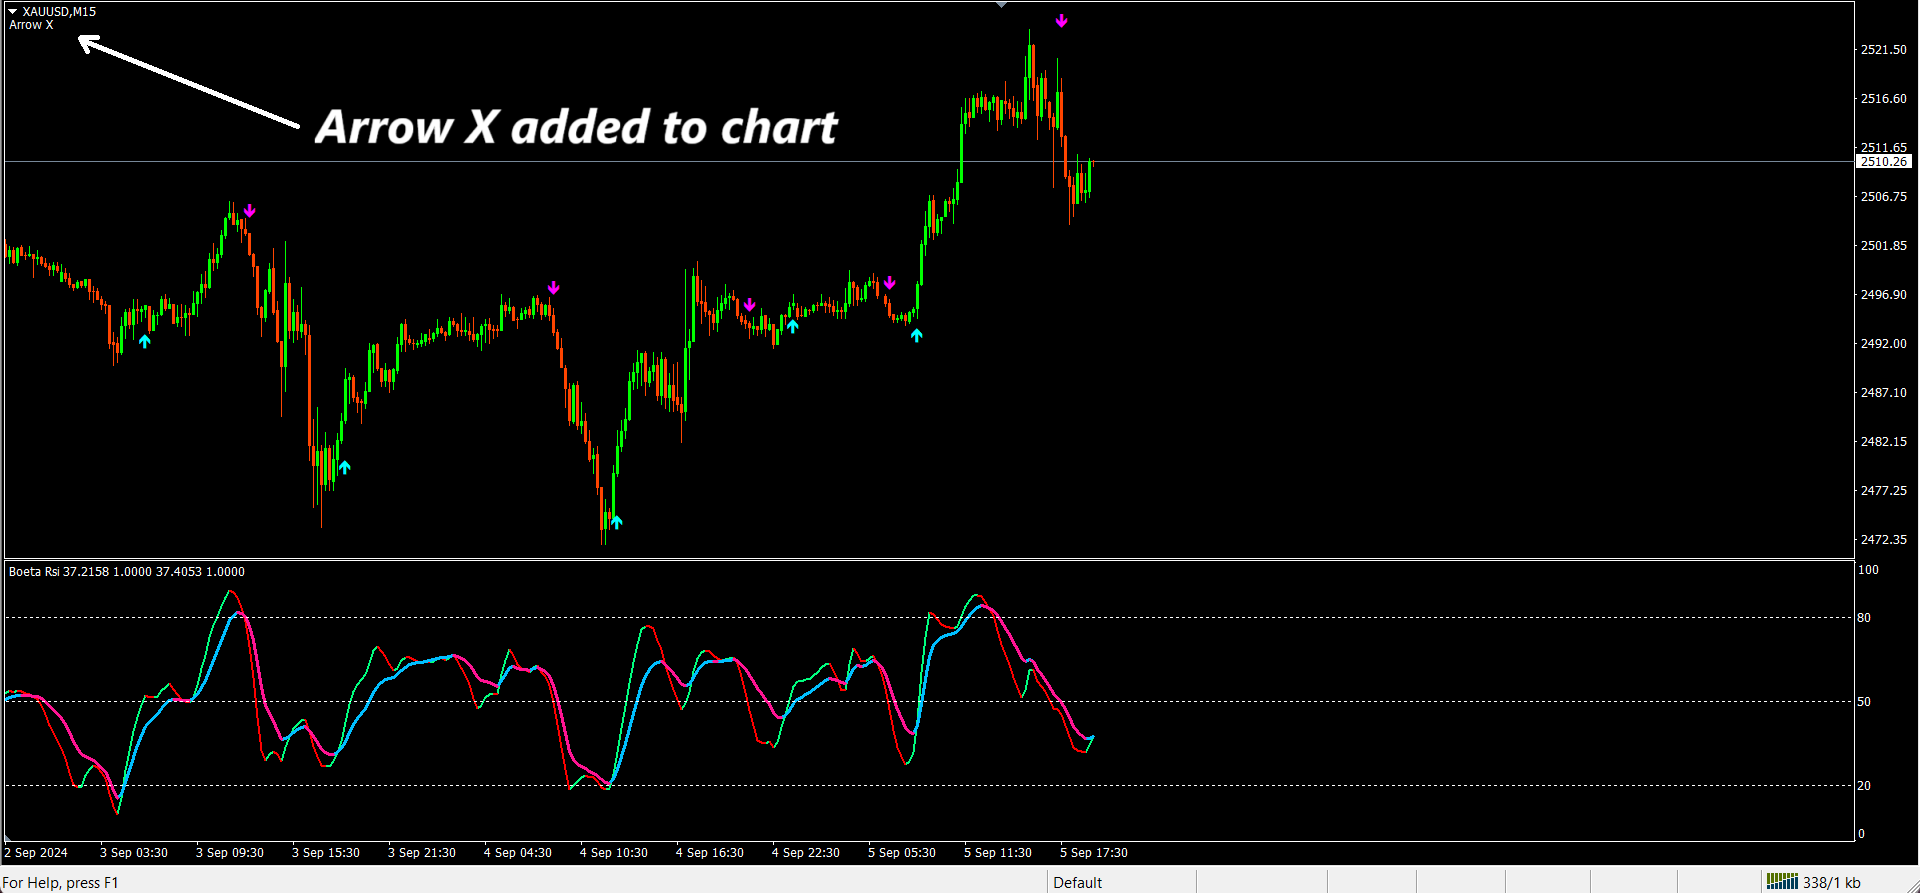
Check out my indicator - Arrow X - https://www.mql5.com/en/market/product/122515
# Please note the demo doesn't perform correctly in the backtester.
The values and colors can be changed as preferred.
The fast line gives earlier signals but if you want confirmation wait for the cross or slow line to change color also.
Buy when lines is closer to the 20 line and sell closer to the 80 line.
Symbol: Any
Timeframe: Any
Enjoy!