Dashboard Multi Currency MTF Double CCI
- 지표
- Anon Candra N
- 버전: 1.20
- 업데이트됨: 26 9월 2024
- 활성화: 20
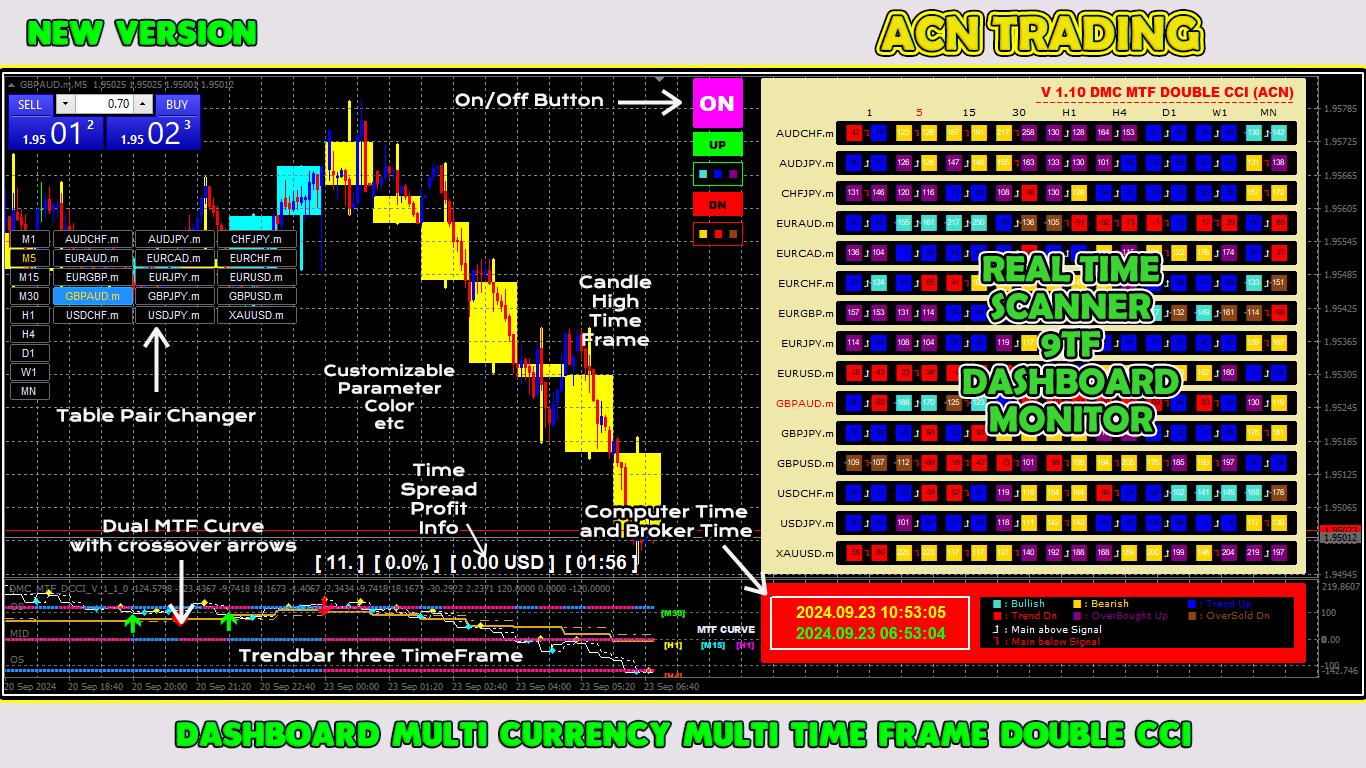
이 거래 도구를 사용하면 15개 시장을 동시에 스캔할 수 있습니다.
2024년 새로운 거래 지표 소개:
➡️ 대시보드 다중 통화 다중 시간 프레임 이중 CCI.
제가 이 거래 도구를 만든 이유는 최소한 두 가지입니다.
첫째, 하나의 시장만 관찰하는 것이 지루합니다.
둘째, 다른 시장에 진입하는 순간을 놓치고 싶지 않습니다.
그렇기 때문에 동시에 다른 시장 상황도 알고 싶습니다.
이러한 이유로 여러 시장의 상황을 동시에 스캔할 수 있는 스캐너가 필요합니다.
나는 종종 빠른 CCI 라인 > (또는 <=) 느린 CCI 라인이 M1에서 H4(또는 단지 M1에서 M30)까지 시작하는 시장을 찾습니다.
내 분석에 동의하신다면 이것이 바로 귀하가 찾고 있던 거래 지표입니다.
시장 상황이 위의 요구 사항을 충족하는 순간을 놓치지 마십시오.
이것은 많은 훌륭한 기능을 갖춘 확률론적 스캐너 또는 대시보드입니다.
빠른 CCI 라인의 데이터를 표시할 수 있습니다.
느린 CCI 라인의 데이터를 표시할 수 있습니다.
빠른 CCI 라인과 느린 CCI 라인의 위치를 표시할 수 있습니다(느린 라인 위의 빠른 라인 또는 느린 라인 아래의 빠른 라인).
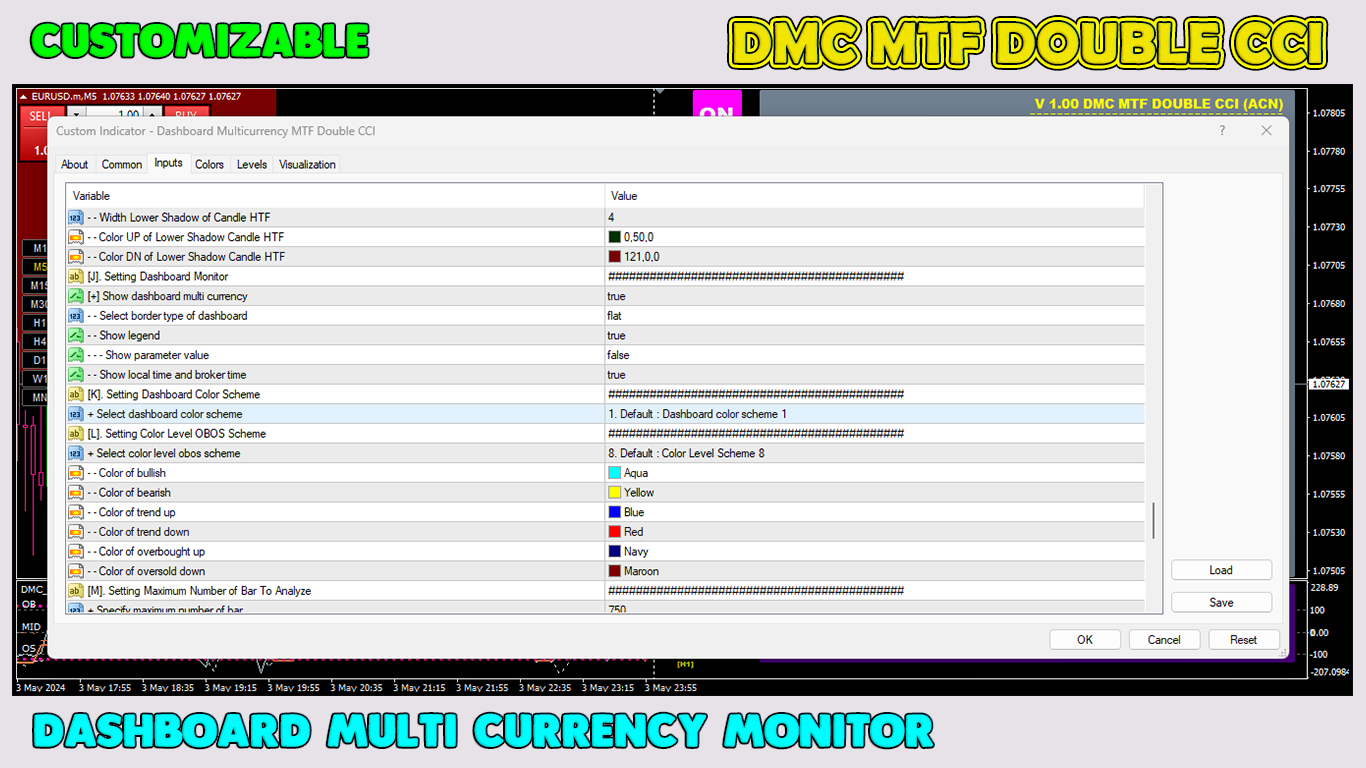
빠른 CCI 선과 느린 CCI 선의 데이터 수준을 모두 표시할 수 있습니다(강세, 약세, 상승 추세, 하락 추세, 과매수했지만 여전히 상승 및 과매도이지만 여전히 하락).
M1에서 MN1까지 실시간 데이터 표시 가능
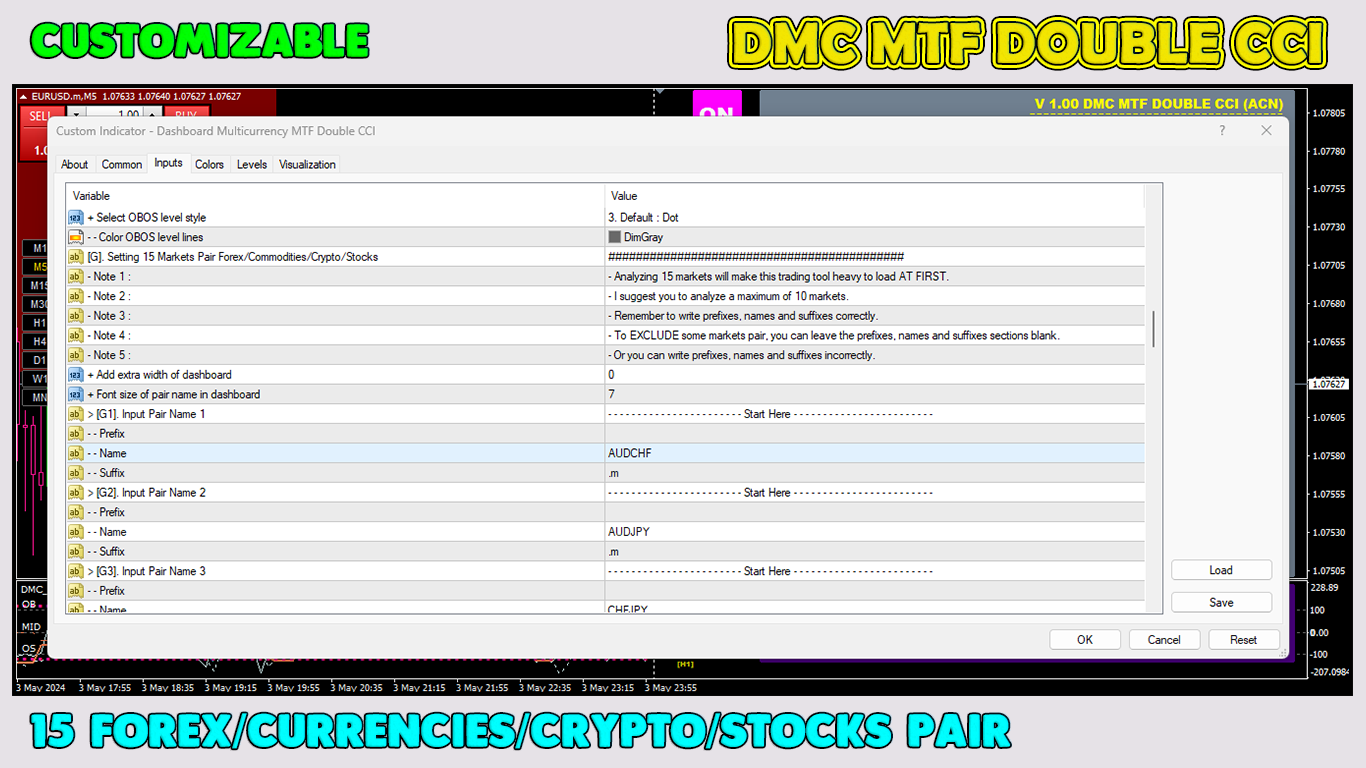
15개 통화쌍(다중통화 외환/상품/암호화폐/주식)의 데이터를 표시할 수 있습니다.
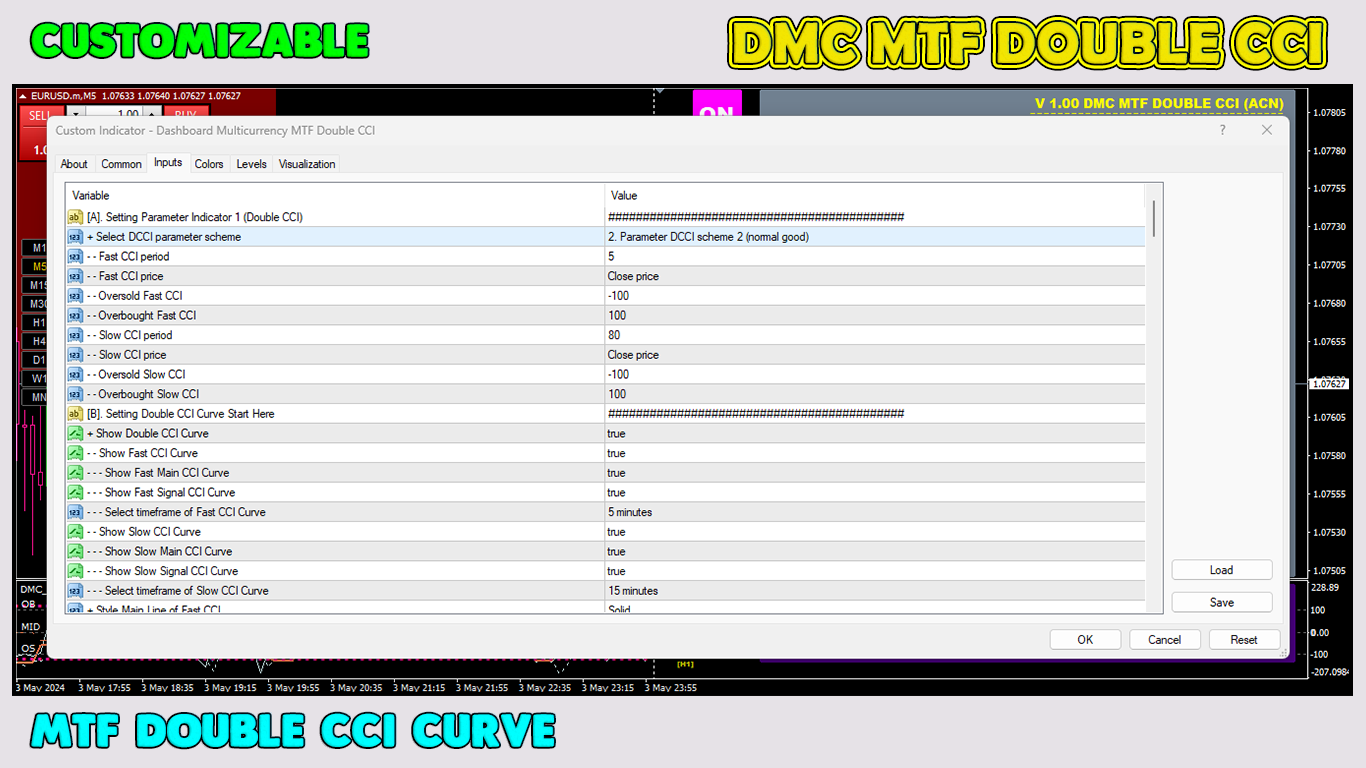
맞춤형 매개변수
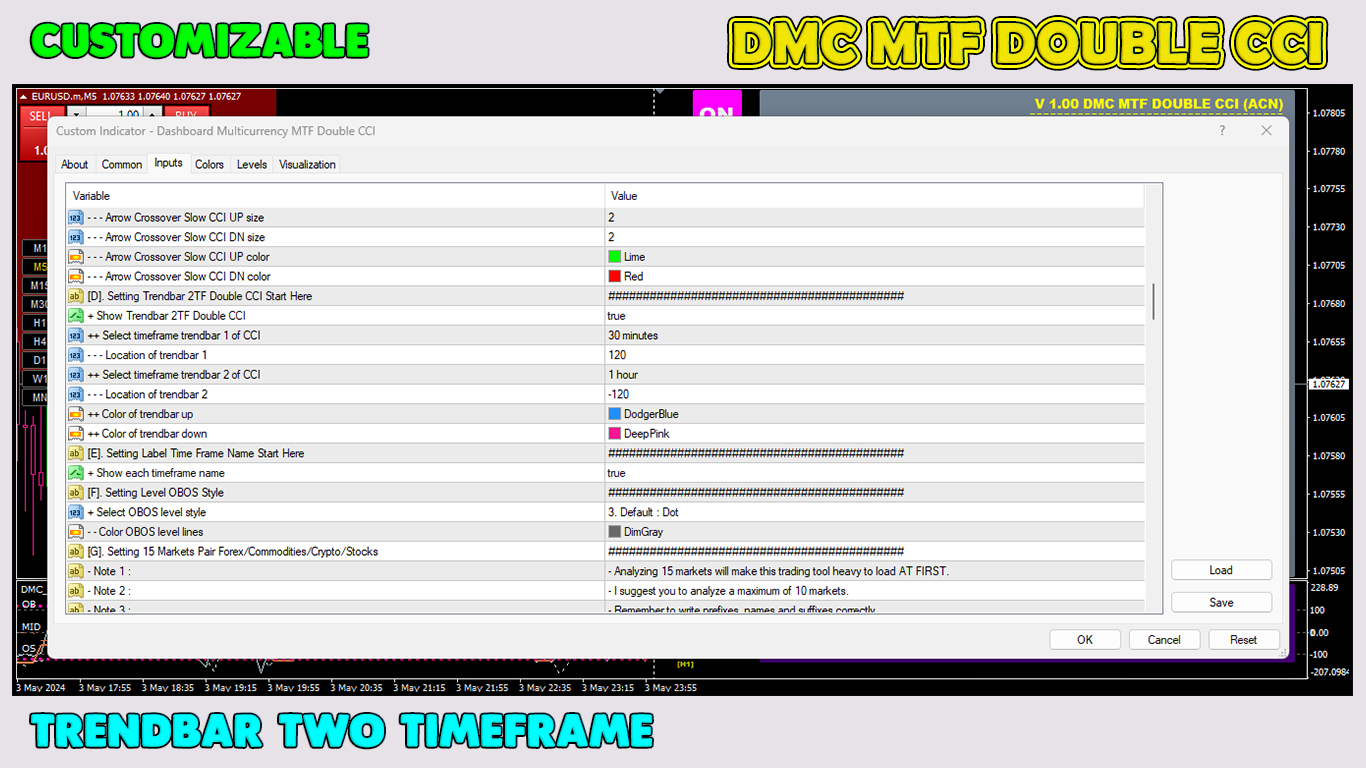
사용자 정의 가능한 색상 OBOS 레벨
아름다운 20가지 대시보드 색상 구성표
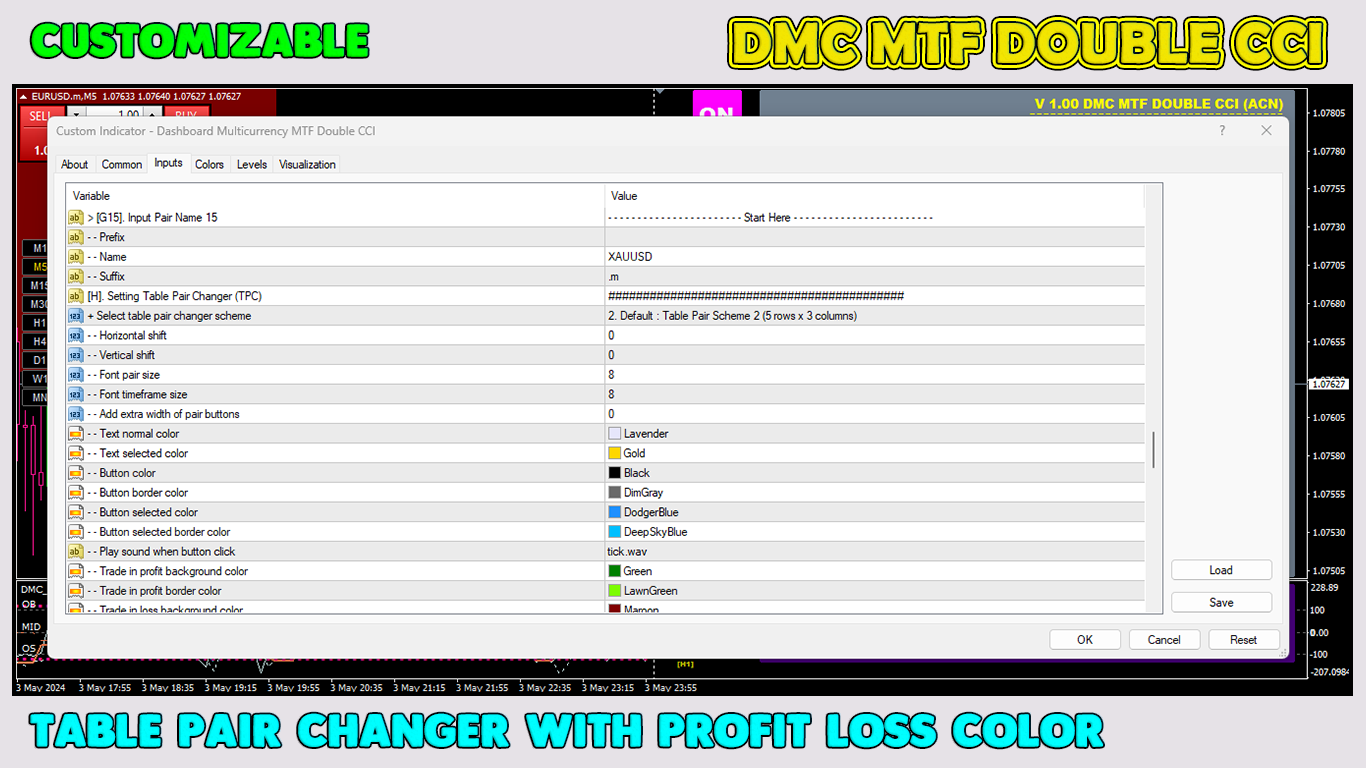
온/오프 통화쌍 교환기 장착
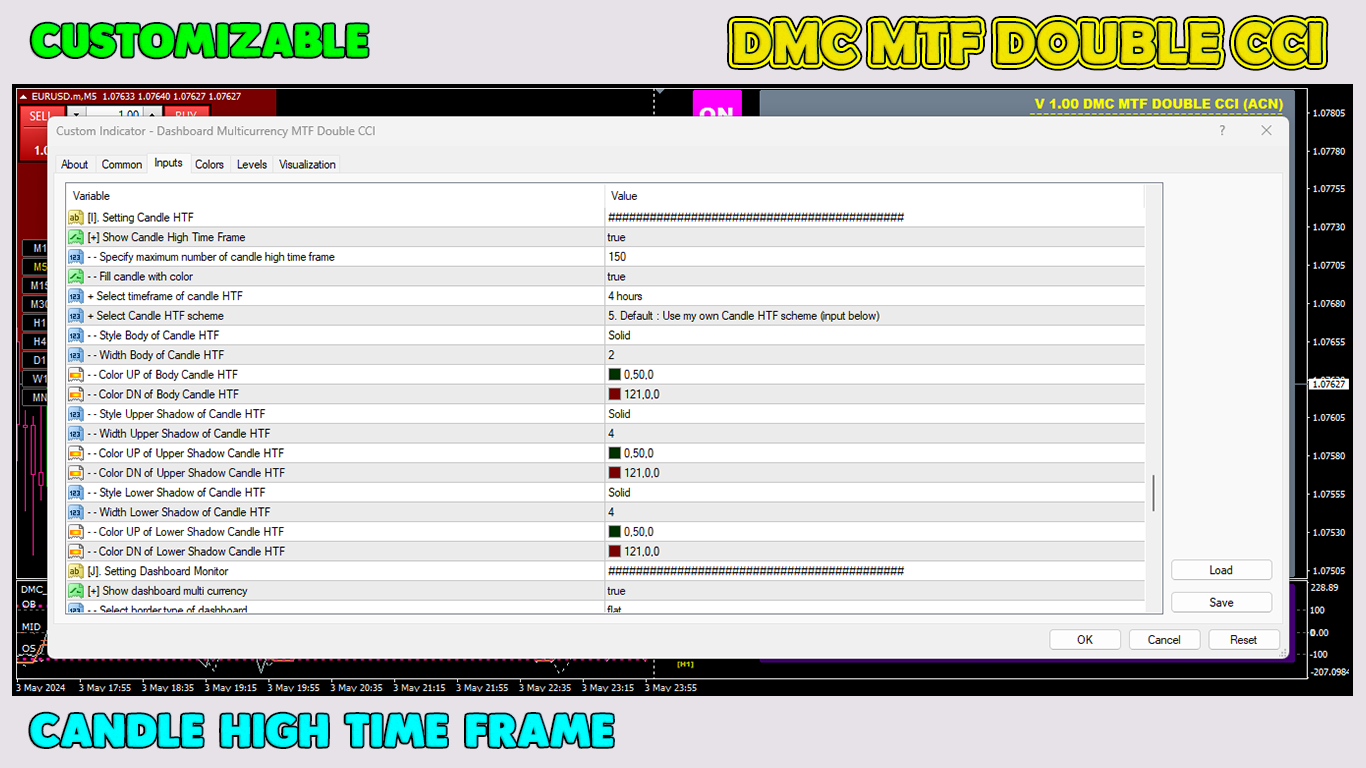
캔들하이타임프레임 장착
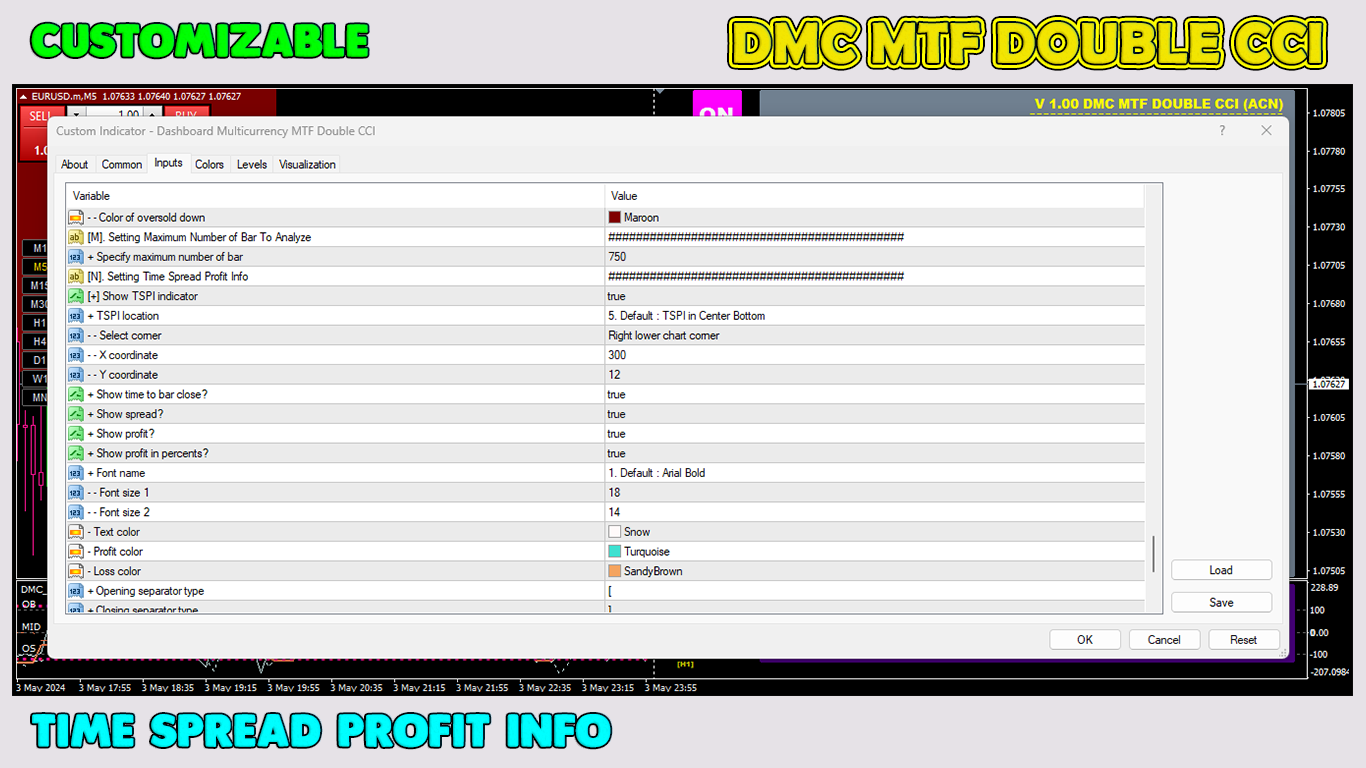
시간 스프레드 수익 정보 탑재
현재 로컬 컴퓨터 시간과 브로커 시간을 갖추고 있습니다.
MTF 이중 CCI 곡선 장착
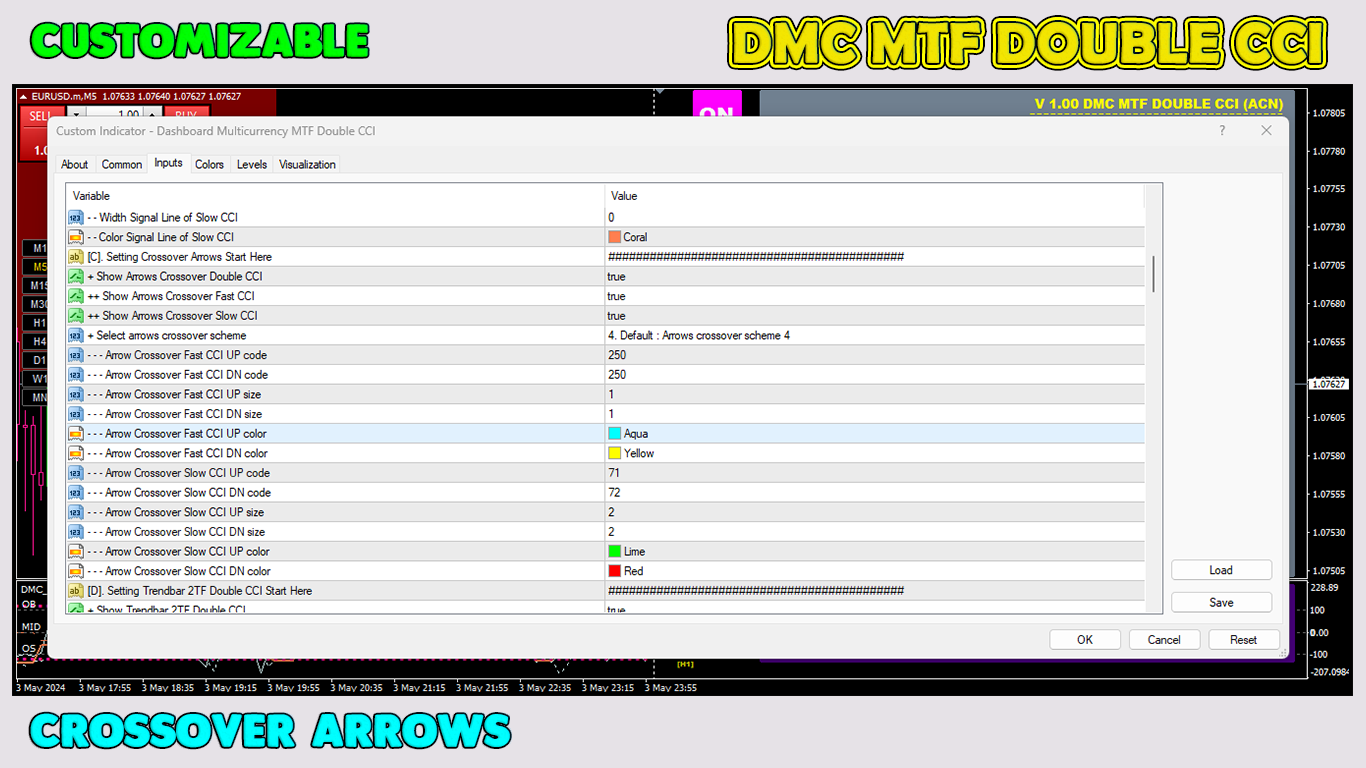
MTF 이중 CCI 곡선의 크로스오버 화살표 장착
트렌드바 2TF 더블 CCI 탑재
이 거래 도구는 모든 거래자에게 절대적으로 필요한 것입니다.
지금 다운로드하세요.
자신감 있게 참가하고 전문가처럼 거래하세요!
감사합니다.
이번 프로모션 가격을 활용해 보세요.
다양한 고급 기능을 갖춘 이 거래 도구는 $200의 가격으로 판매되어야 합니다.
그러니 지금 이 거래 지표를 구매하세요!
#dashboardCCI #multicurrency #multitimeframe #CCItradingstrategy