The Seismograph Marketquake Detector
- 지표
- Yohana Parmi
- 버전: 6.5
- 업데이트됨: 26 5월 2024
- 활성화: 5
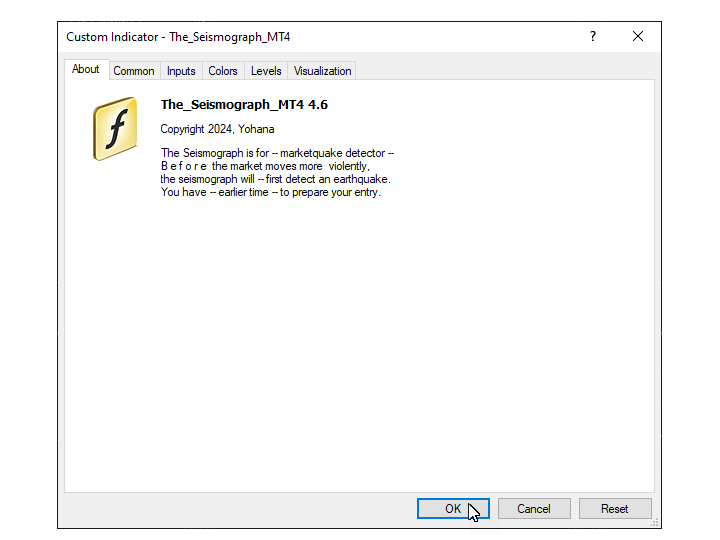
지진계
Marketquake Detector.
Description in English :
https://www.mql5.com/en/market/product/113869?source=Site+Market+Product+Page#description
How to use the Seismograph :
https://www.mql5.com/en/market/product/113869#!tab=comments&page=2&comment=52806941
Create an EA :
https://www.mql5.com/en/market/product/113869#!tab=comments&page=3&comment=52816509
어떤 방식으로 거래하든 유동성이 낮은 시장에 진입하는 것을 피하고 싶을 것입니다.- 지진계는 시장 랠리 전에 시장에 진입할 수 있는 적절한 시기를 도와줄 것입니다.
그러나 바쁠 시장 시간에 진입을 확인했음에도 불구하고 많은 사람들이 유동성이 부족한 시장에 갇혀 있는 경우가 많습니다.
몇 시간을 기다린 후 시장은 갑자기 붐볐지만... 알고 보니 많은 사람들이 이제 시장의 반대 방향에 있었다.
사람들이 플로팅 마이너스를 오래 기다려야 하거나 심지어 손실을 줄이거나 손절매를 해야 한다면 정말 피곤합니다.
제품 설명을 읽기 전에 대여하지 마십시오.* 설명을 읽고 나면 지진계가 어떻게 더 잘 작동하는지 이해할 수 있습니다.- - - - 지진계의 작동 기반은 Market Watch입니다.* MT4는 백 테스터에서 Market Watch 및 OnTimer() 기능을 제공하지 않기 때문에 테스터에서 지진계를 실행할 수 없습니다 .- - - - -
(!) 지진계는 규제된 브로커에서만 올바르게 실행될 수 있습니다. 규제되지 않은 브로커는 통화에 비합리적인 불균형을 만들어 The Seismograph에 불완전한 결과를 초래할 수 있습니다. 규제되지 않은 브로커를 사용하는 경우 지진계를 사용하지 마십시오.
ᅡ. 지진계는 무엇입니까?
일. 지진계를 발명한 사람은 중앙은행의 심리학을 잘 알고 있던 수학자이자 통계학자였다.
- 프로그램을 만들 수 있는 특별한 기회였습니다.
이. 진정한 선행 지표. 지진계는 선행 지표, 진품 및 정품입니다(100% 내장 MetaTrader 지표를 사용하지 않음).* 이 개념은 독창적이며 인터넷에 게시된 적이 없습니다.- - - - -선행 지표는 어떤 일이 발생하기 전에 초기 징후를 아는 것을 의미합니다. 재도색, 지연이 없습니다.- - - - -
삼. 시장 지진 감지기.
예를 들어, 화산의 경우 지진계는 화산이 폭발하기 전에 징후를 제공합니다.
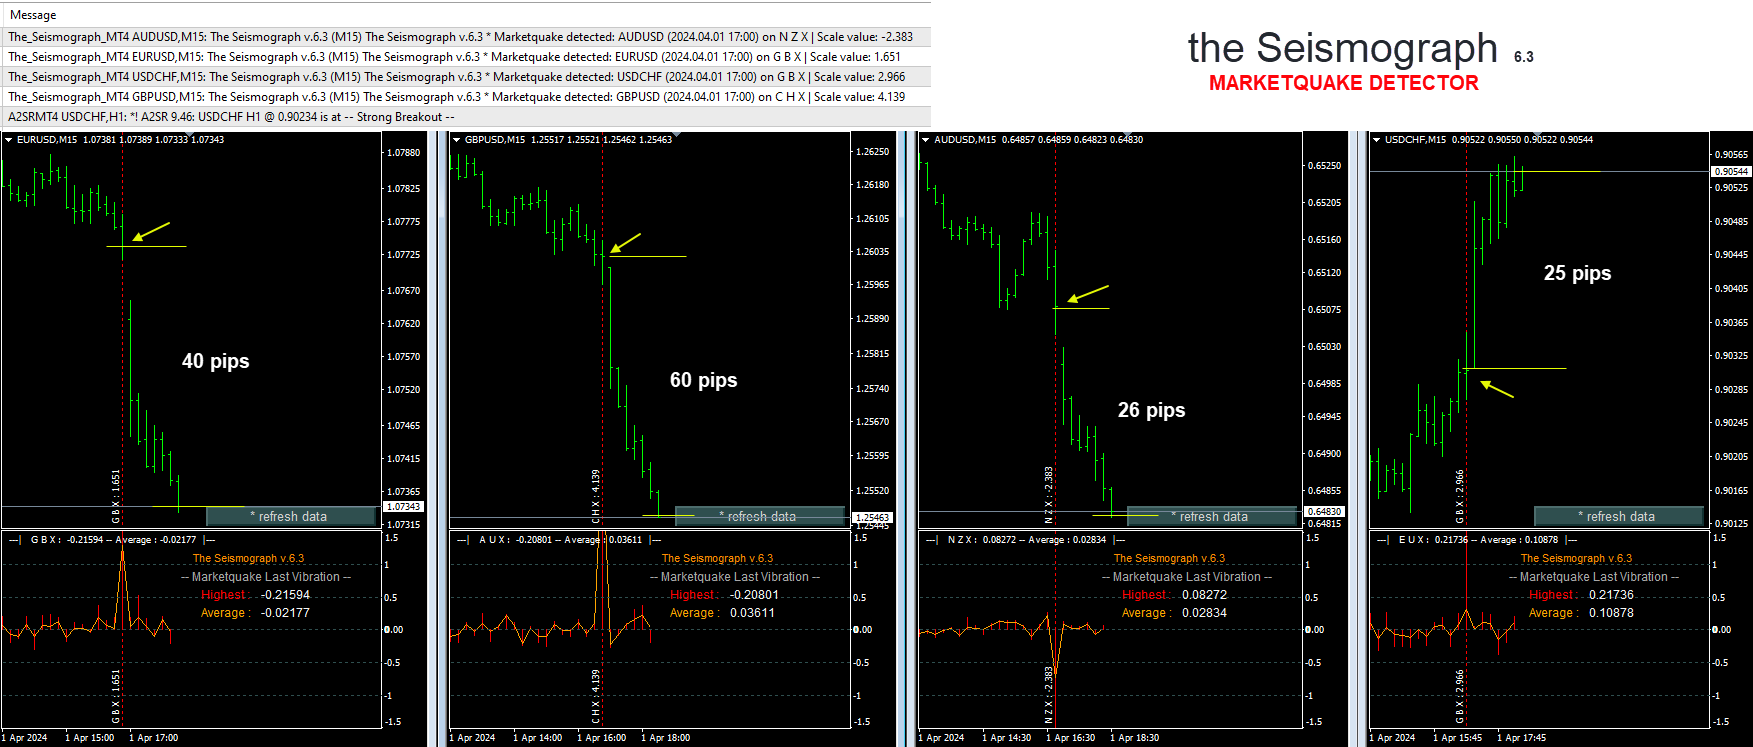
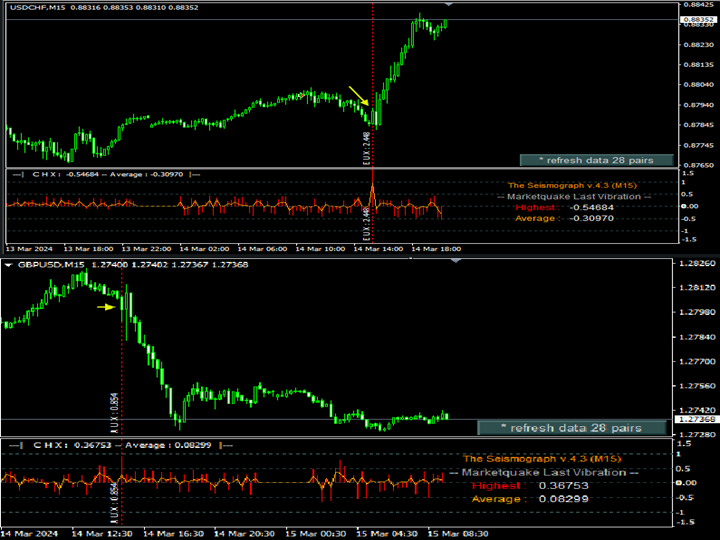
시장에서 지진계를 사용하는 것은 차트의 막대가 정상으로 보일지라도 시장 지진이 발생할 때를 알려주기 위한 것입니다.
우리가 들어본 용어인 '폭풍 전의 고요함'처럼, 지진계는 폭풍이 오기 전에 당신에게 알려줄 것입니다.
사. 쌍 및 시간 프레임. 현재 버전의 지진계는 M15 및 M30에서 가장 좋은 시간 프레임으로 EURUSD, GBPUSD, USDCAD, AUDUSD 및 USDCHF에서 작동합니다. - 하지만 더 많은 알림을 받으려면 M5를 사용할 수 있습니다.- - - - -a. 여기서 시간 프레임은 지진계가 시장 지진을 확인할 때마다 거리를 의미하며, * 해당 척도의 데이터 막대를 계산하지 않습니다. * Seismograh는 Market Watch에서 가격 변동을 읽기 때문입니다.
비. 선택한 시간 프레임은 bar.c가 변경될 때마다 이전 결과만 표시하는 것입니다. 진입에 가장 적합한 통화는 이동 특성에 따라 EURUSD와 GBPUSD 입니다. - 또는 현재 버전에서 제공되는 5 쌍을 시도 할 수 있습니다.
디. 각 쌍에 대해 한 번에 여러 시간 프레임에 지진계를 배치할 수도 있습니다. - 예: EURUSD - M5, M15, M30 및 H1.
오. 스크린 샷에서 수직선을 시장 지진 마커로 보면
인터넷에서 흔히 볼 수있는 다른 방법보다 더 큰 기회를 볼 수 있습니다.
육. 참고. 지진계는 판매용이 아닙니다.- 임대 전용입니다.
비. 거래자에게 지진계가 필요한 이유는 무엇입니까?
일. 시장 움직임에 대한 긍정적인 신뢰를 재생성합니다.
이. 더 나은 거래 습관을 구축하여 위험을 줄이십시오.
거래자는 지진계로부터 알림을 받기 전에 거래 포지션을 열지 않기 때문입니다.
삼. 높은 정확도, 사용하기 쉽고 사용자 친화적입니다.
다. 지진계를 백테스트할 수 없는 이유는 무엇입니까?
지진계의 발명가는 국제 은행 서비스 전문가 출신의 수학자이자 통계학자였습니다. 그들은 통화를 다른 통화와 비교하는 데 있어 중앙은행가의 심리를 이해하고 있습니다. 참고로 두 가지 중요한 사항이 있습니다.
일. 중앙은행은 자국 통화의 자연적 불균형을 알아낼 수 있는 '방법'을 가지고 있다. 그들은 조만간 그것을 안정시키기 위해 개입할 것입니다.
이. 어떤 이유로, 의도적으로 다른 방식으로 행동하여 다른 통화에 대한 불균형을 초래하는 다른 중앙 은행이 있으며, 이는 궁극적으로 다른 중앙 은행이 무언가를 하도록 강요합니다.
삼. 지진계는 모든 통화의 움직임을 면밀히 모니터링합니다.* 시장 지진이 발생하는 즉시 알림이 전송됩니다.
일반적으로 차트의 막대 캔들은 평소와 같이 평범해 보이지만 그 뒤에는 두 개의 지구 판이 충돌하는 것처럼 강한 당김이 있습니다.
이를 위해 :
불행히도 MT4의 테스터는 다중 쌍 및 시간 프레임에 대해 동시에 완벽하게 작동할 수 없습니다.지진계에는 Market Watch가 필요하지만 MetaTrader의 테스터는 이를 제공하지 않습니다.
* 테스터는 OnTimer()도 제공하지 않습니다.
- -
디. 지진계를 사용하기 전 첫 번째 단계.
일. MT4에 모든 쌍과 모든 시간 프레임에 대한 완전한 데이터가 있는지 확인하십시오
.- - 지진계는 데이터를 새로 고치는 기능을 제공합니다. - 새로 고침 버튼을 클릭하기만 하면 지진계가 자동으로 수행합니다.
- -
이. 최적의 첫 번째 처리 하중을 위해서는 막대 수 옵션을 적절한 수로 채우는 것이 가장 좋습니다.- 예를 들어 기본 200개 막대 또는 최대 800개 막대를 사용하여 이전 결과를 보려면
* 이는 지진계를 차트에 처음 배치할 때 첫 번째 프로세스에 영향을 미칩니다.
메모. 처리 부하가 합리적인데, 가격이 움직일 때마다 처리하지 않기 때문입니다. 지진계는 필요할 때만 자동으로 특정 시간을 처리합니다.
- - - - -
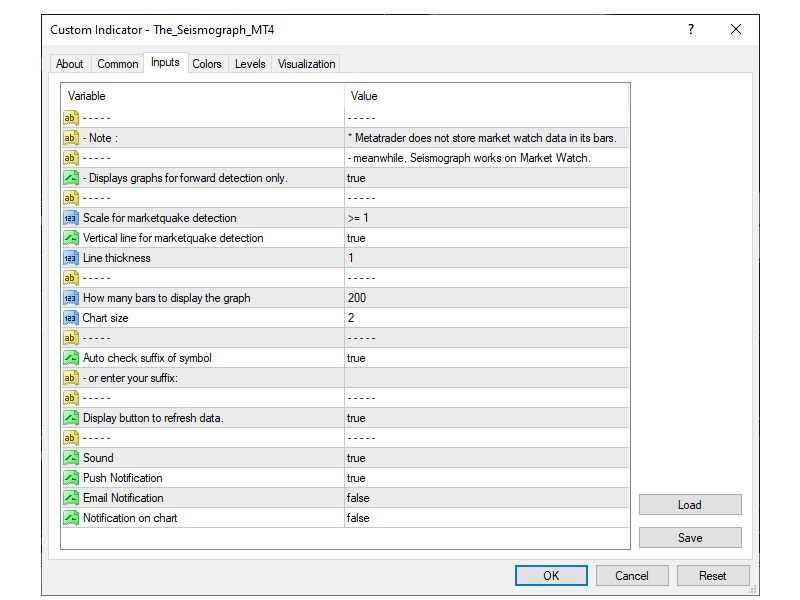
이자형. 입력 매개 변수.
일. 시장 지진 감지를 위한 스케일, 기본 옵션은 스케일 1입니다.
이것은 당신이 얻고자 하는 최소 척도입니다. 규모 1을 선택하면 규모 1 이상에서 지진이 발생할 때 알림을 받게 됩니다.
이. 그래프를 표시할 막대 수, 기본 옵션은 200개입니다.* 즉, 이전 결과를 볼 수 있습니다.
삼. 차트 크기, 기본 옵션은 2입니다.
사. 기호의 접미사 자동 검사, 기본 옵션은 true입니다.
- 그러나 필요한 경우 MT4의 기호에 따라 기호 접미사를 채울 수 있습니다.
오. 수직선 그리기, 기본 옵션은 true입니다. 지진계가 시장 지진을 감지하면 차트의 알림으로 마지막 막대에 새로운 수직선이 배치됩니다.
육. 선 두께, 기본 옵션은 1입니다.
굵은 선을 보고 싶다면 2로 채울 수 있습니다.
칠. 표시 버튼(차트)을 사용하여 데이터를 새로 고칠 수 있으며 기본 옵션은 true입니다.
팔. 소리, 기본 옵션은 true입니다. 지진계가 시장 진동을 감지하면 알림으로 소리를 재생합니다.
이 단계에서는 다음 옵션에서 알림을 사용자 지정할 수 있습니다.
구. 푸시 알림, 기본 옵션은 true입니다.
십. 이메일 알림, 기본 옵션은 false입니다.
십일. 차트에 알림, 기본 옵션은 false입니다.
- - -
감사합니다 & 친절한 안부.


Yohana is the best in the market. This indicator is fantastic! This can detect marketquakes very well and you can build a nice strategy. I had the pleasure of contributing to the development of the seismograph and I must say that she was most helpful in answering any questions I had. I hope the collaboration can continue in the future. I love Yahona