• 미리보기
  • 리뷰
  • 코멘트

Murray Math Xline

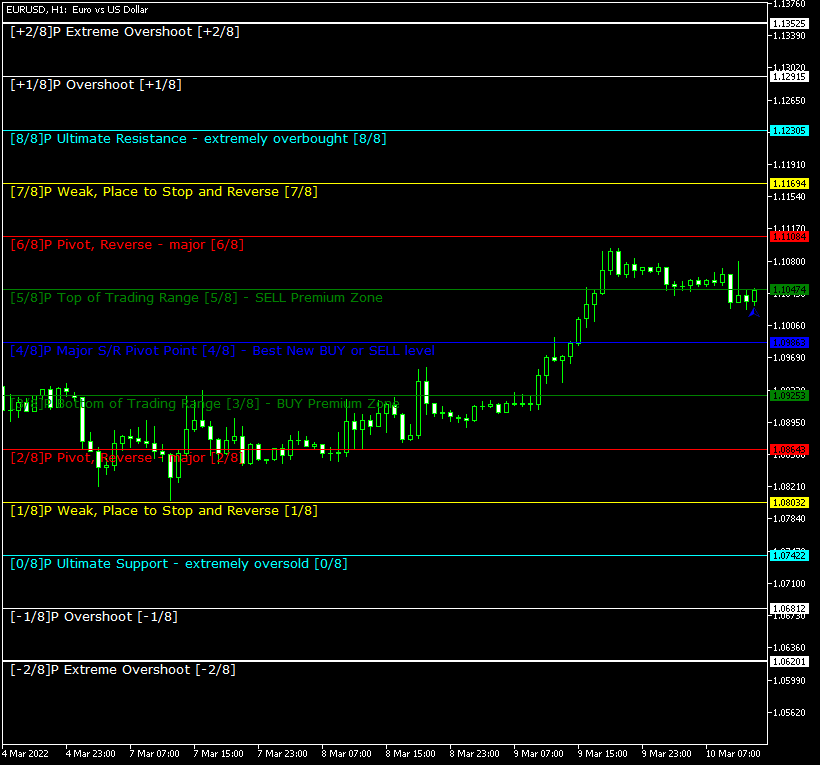
Murrey Math Line X MetaTrader SYSTEM — a pivot line system that will definitely help every trader who knows how to trade with support, resistance, and pivot lines. It displays 8 primary lines (with 5 more additional ones) on the main chart, helping you to find the best points to sell, buy, and exit your positions. You can download this indicator for MT4 and MT5 platform.

Input parameters

  • Period (default = 64) — a period in bars or in other upper timeframe periods (set via the UpperTimeFrame input), on which the lines will be calculated. The lower the number the more up-to-date but less accurate calculations.
  • UpperTimeframe (default = PERIOD_D1) — a basic period; if different from the current timeframe, the indicator will use Period × UpperTimeframe periods to calculate its lines. Otherwise, the indicator will use Period of the current chart bars to calculate its lines.
  • StepBack (default = 0) — a shift back for calculating the lines (in the current bars or in the number of UpperTimeframe periods).
  • LabelSide (default = Left) — the side of the screen to display the line labels. If you select Right, make sure, the chart is shifted to the left; otherwise, you won't be able to see the labels.
  • [N]/8 Color — colors for the indicator lines.
  • [N]/8 Width — the indicator lines' width.
  • MarkColor (default = clrBlue) — the color for the last calculated bar's arrow.
  • MarkNumber (default = 217) — the arrow code for the last calculated bar's arrow.
  • FontFace (default = "Verdana") — the font face to use for display.
  • FontSize (default = 10) — the font size to use for display.
  • ObjectPrefix (default = "MML-") — prefix for chart objects for compatibility with other indicators.
its is easy to use Murrey Math Line X. 0/8P and 8/8P lines are the ultimate resistance and support lines — they are very hard to break. 1/8P and 7/8P lines are weak support and resistance lines, but if the price stops near them, it will likely reverse and change direction. 2/8P and 6/8P lines are strong reverse points. 3/8P and 5/8P are the bottom and the top of the average trading range respectively; it is very likely that the price will either pierce this range fast or will remain inside it for a long time. 4/8P is a major support and resistance line; you can sell or buy when the price crosses it for a high-probability trade. The blue arrow marks the final calculated bar.


추천 제품
My Point MT5
Claudia Ramona Angerer
Diagnosis of major and minor pivot Trend detection with many signals Can be used in all symbols Can be used in all time frames Settings: Back Show: The number of candles it displays If you need any adjustments, or have any questions or suggestions, message me How to trade: Blue: sell signal Red: buy signal Blue and red at the same time: no signal Exit signal: Opposite signal
The indicator ‘Probability Range Bands’ gives a prediction of the amount, how much the asset is moving from its current price. The range bands give probabilities, that the candle close will not exceed this certain price level. It is also called the expected move for the current candle close.   This Indicator is based on statistical methods, probabilities and volatility. Asset price is assumed to follow a log-normal distribution. Therefore, log returns are used in this indicator to determine the
Custom Timeframe MAs
Behnam Farnaghinejad
Overview: The Custom_Timeframe_MAs indicator for MetaTrader 5 lets you study different timeframes using M1 candles. It offers 12 moving average methods for analyzing trends. Why It's Useful: Versatile Timeframes: Even though MetaTrader has fewer timeframes, this indicator expands options by using M1 candles. Various Moving Averages: Choose from 12 moving average types: SMA, EMA, DEMA,TEMA,WMA, VWMA,SMMA, HullMA, LSMA, ALMA, SSMA, TMA, to understand price movements better. For Automated Tradi
ABC Trend Levels MT5
Oleksandr Novosiadlyi
Description ABC Trend Levels  is an indicator that identifies market trends and important trend support and resistance levels. Recommendations You can use this indicator to determine the trend and, accordingly, to determine the direction of opening a position or closing an opposite position. Parameters ===== _INDICATOR_SETTINGS_ =====  - indicator settings Maximum History Bars  - maximum number of history bars for calculating the indicator. Average True Range Period  - ATR indicator p
B4S Adaptive YAxis Scaling
Henry Waribu Macharia
Product Description: Adaptive Y-Axis Scaling is a powerful MT5 indicator designed to enhance your trading experience by providing precise control over the Y-axis (price) scaling of your charts. This innovative tool allows you to customize the price scaling by specifying the number of pips from the visible chart's highs and lows. The calculated price range from this input is then used to set the maximum and minimum prices for the open chart, ensuring an optimized and comprehensive view of market
FREE
Space X
Marta Gonzalez
Space X  it is a Secure Automated Software for trade Forex market and indices. The architecture is a Fully Automatic Autonomous Robot Expert capable of independently analyzing the market and making trading decisions Space X It is an advanced and professional trading system. This is a FULL configurable system.     Space X     is a professional system, Ready to personalized your profile.                            You can download the demo and test it yourself.                        Space X
무료 다운로드를 원하시면 저희 그룹에 가입하세요. 제한된 시간 동안 제공됩니다! 일일 캔들의 경계를 낮은 타임프레임에서 명확하게 시각화하는 혁신적인 MQL5 인디케이터를 소개합니다. 이 도구는 일일 캔들의 진행 상황을 파악하여 더 나은 의사 결정과 전략 실행을 원하는 트레이더에게 완벽합니다. 주요 기능 일일 캔들 박스 시각화: 낮은 타임프레임에서 일일 캔들의 시작부터 끝까지 명확한 박스를 그립니다. 일일 캔들의 시작 및 끝 지점을 명확하게 강조하여 일일 시장 움직임을 추적하기 위한 시각적 참조를 제공합니다. 차트의 명확성 향상: 깨끗하고 정돈된 차트 보기를 제공하여 트레이더가 화면을 혼란스럽지 않게 일일 경계를 빠르게 식별할 수 있도록 도와줍니다. 일일 거래 활동의 맥락에서 시장 동향과 패턴을 분석하는 능력을 향상시킵니다. 원활한 통합: 기존의 MQL5 플랫폼 설정과 쉽게 통합되어 빠른 설치와 즉시 사용이 가능합니다. M1, M5, M15, M30, H1 등의 다양한 낮은 타임프레임
You shall not pass - it is a Secure Automated Software for trade Forex market and indices. This system detects the ranges between the end of the American session and the beginning of the Asian session, operating thinking that the volume of the market will not be able to maintain the break of the support or resistance, thinking that this break. To adapt to the different schedules of the different brokers, you have to set the closing time of the American session of your broker in the configurati
Swing High Low Price Channel
Mr Kanganapong Sriduang
This indicator, It can be applied to any financial assets:   forex, cryptocurrencies, metals, stocks, indices . And This indicator base on Golden cross with custom length signal Settings FastSignalLength : Length of Fast Signal SlowSignalLength :   Length of Slow Signal TimeFrame : Choose time frame to calculate ShowDeadCrossOnly : Show Dead Cross Channel Only ShowSignalMedianOnly : Show signal median line only when ShowDeadCrossOnly set to false alertOn : Send alert alertsOnCurrent : Alert
Trend Ruby
Ignacio Agustin Mene Franco
Trend Ruby, indicator 3 of the ruby ​​pack. trend ruby ​​has the strategy of breaking the structure or trend line How well do the lines mark and gives you the signal of breaking or following the trend? and bounce! works for any temporality, It is used for scalping and also intraday It works for the forex markets all the pairs, also for synthetic indices all pairs ideal for volatility and jumps! also crash and boom!
Volatility Meter
Ali Waqas Ahmad
A very good indicator for experienced and professional traders . A practical approach to trading. Easy to understand. A helping tool for traders looking for price movements . Signals: Signal Number 1: When yellow line which is a signal line  crossing the zero line  towards downward direction is  a selling opportunity. Signal Number 2: When yellow line which is a signal line  crossing the zero line  towards upward direction is  a buying opportunity.
Spike Oscillator
Vitalii Kondratiuk
Indicator for searching for price reversals Works well on commodity indices and currency pairs On charts such as Boom Cash, it shows the beginning of a protracted movement well. You can also catch splashes. The indicator uses algorithms, an oscillator and a trend indicator that work together. The indicator shows a candle opening signal (does not disappear, does not redraw and does not recalculate its readings) A good quality tool that can become the basis for creating your own trading system.
HiperCube ADX Histogram
Adrian Lara Carrasco
HiperCube ADX Histogram is here! This indicators helps you to know if could be a strong trend in the market . ADX is a very popular and usefull indicator, so many top traders reccomends use it as filter to bad trades, or in combinations of other analysis. With HiperCube ADX you will be a premium exoerience using a beautifula and great indicator for your trading. FEATURES: Fully Customizable Custom Your Chart! Custom Color to Histogram In Sub Windows for have a clear main chart Chat GPT and
FREE
Get Trend
Vitalii Zakharuk
The Get Trend indicator was created to neutralize temporary pauses and rollbacks. It analyzes the behavior of the price and, if there is a temporary weakness of the trend, you can notice this from the indicator, as in the case of a pronounced change in the direction of the trend. Currency pairs never rise or fall in a straight line. Their rises and falls are interspersed with pullbacks and turns. Every growth and every fall is reflected in your emotional state: hope is replaced by fear, and w
Xtrade Trend Detector
Dago Elkana Samuel Dadie
Xtrade Trend Detector is an indicator capable of finding the best opportunities to take a position in any stock market. Indeed, it is a great tool for scalpers but also for Daytraders. You could therefore use it to identify areas to trade, it fits easily on a chart. I use it to detect trends on Big timeframes and take positions on Small timeframes. Don't hesitate to give me a feedback if you test it.
Fibo Ruby
Ignacio Agustin Mene Franco
Fibo Ruby indicator 5/5 pack ruby fibo ruby ​​has the strategy of a programmed fibonacci to capture the bullish trend as bass player ideal for grabbing rebounds at the points of 23.6, 38.2, 50.0 and 61.8 It adapts to any temporality, be it for scalping or intraday. works for forex markets, all pairs It is used for synthetic index markets, all pairs great for boom and crash!
Info:   marcobarbosabots Pivot lines are an easy way to see market trend. The indicator provides the pivot line and three first support and Resistance lines. Calculations used was: Resistance 3 = High + 2*(Pivot - Low) Resistance 2 = Pivot + (R1 - S1) Resistance 1 = 2 * Pivot - Low Pivot point = ( High + Close + Low )/3 Suport 1 = 2 * Pivot - High Suport 2 = Pivot - (R1 - S1) Suport 3 = Low - 2*(High - Pivot) You can use the calculated values ​​on an EA too, just make sure the indicator
Aussenstab Markttechnik
Alexander Josef Zeidler
This indicator shows external bars ("Aussenstäbe") in the chart in candle form. The colors of the candles can be set individually. Also different colors for bearish and bullish bars are possible. In addition, the color of the wicks or outlines is also adjustable. Outside bars are mentioned e.g. by Michael Voigt in the book "Das große Buch der Markttechnik". All other candles are inner bars.
Supreme OBV Divergence Indicator
Eveline Van Neyghem
5 (1)
A lot of professional traders use high quality divergence signals as a part of their strategy to enter a position. Spotting correct divergences quickly can often be hard, especially if your eye isn’t trained for it yet. For this reason we’ve created a series of easy to use professional oscillator divergence indicators that are very customisable so you get only the signals you want to trade. We have this divergence indicator for RSI, MACD, Stochastics, CCI and OBV. RSI:   https://www.mql5.com/en/
Zigzag X Fibo
Ian David Emmanuel Bello
The ZigZag indicator's main objective is to highlight significant price movements by filtering out minor price fluctuations. It enables the visualization of trends by eliminating market "noise," which can assist traders in making more informed decisions. Adding the Fibonacci indicator, which is a powerful tool for identifying potential support and resistance levels in financial markets.
A useful feature may be to determine the normal frequency of round-sized trades, and monitor deviations from that expected value. The ML algorithm could, for example, determine if a larger-than-usual proportion of round-sized trades is associated with trends, as human traders tend to bet with a fundamental view, belief, or conviction. Conversely, a lower-than-usual proportion of round-sized trades may increase the likelihood that prices will move sideways, as silicon traders do not typically hol
Ali Levels Pro
Alexandra Voicu
Ali Levels Pro is an indicator designed to identify and draw levels of interest including: Opening Range High/Low with seconds precision,  Previous Session High/Low (if you are a Intraday trader who trades Indices or Commodities maybe you want to know yesterday New York Session high and low),  Overnight Session High/Low,  Previous Day High/Low,  Previous Week High/Low, and  Previous Month High/Low. Traders use this levels as support and resistance levels.  By searching for confluences between
KT Tether Line MT5
KEENBASE SOFTWARE SOLUTIONS
The KT Tether Line is a trend-following tool consisting of three indicators that work together to generate trading signals. It can correctly identify market trends while signaling trade entries. It was first introduced by Bryan Strain in the Stock & Commodities magazine in 2000 in "How to get with the trend and out at the end." The Concept When a market trend is confirmed, the most challenging part is determining the timing of the entries. This indicator alerts you to potential trend reversal
Harmonic Patterns Scanner MT5
Reza Aghajanpour
4.2 (5)
** All Symbols x All Time frames scan just by pressing scanner button ** *** Contact me  to send you instruction and add you in "Harmonic Scanner group" for sharing or seeing experiences with other users. Introduction Harmonic Patterns are best used to predict turning point. Harmonic Patterns give you high win rate and high opportunities for trade in during one day. This indicator detects the best and successful patterns based on Harmonic Trading concepts . The   Harmonic Patterns   Scanner   Sc
Hammer Star
Arkadii Zagorulko
This powerful tool is designed to help traders identify key reversal patterns in their charts, including the hammer and star bar formations. With this indicator, you can quickly and easily spot these patterns as they form, allowing you to make well-informed trades and potentially increase your profits. The Hammer Start indicator is customizable, allowing you to set your own parameters for identifying patterns and alerts. Whether you're a seasoned trader or just starting out, the Hammer and Star
Five Candles Pattern MT5
Miguel Antonio Rojas Martinez
The "Five Candle Pattern" indicator is a novel way to see the market, because with it we can compare and/or seek training or the pattern of the past 4 or 5 Candles, and identify them in the same graph, to view your behavior at an earlier time. The indicator creates a pattern of those 4 or 5 candles and searches backward, identifies, and marks the same formation or pattern. With that information you adjust the strategy that is operating, or create a new one, because you can compare the past devel
Super Highspeed volume
Mr Punnatorn Tunbee
Hello, I would like to tell you a little bit about EA. Before the EA opens an order, it measures the volume strength. If the volume is set, the EA will open the 1st order and can increase the open order by using MaxOrder function, will make your profit grow enormously. However It depends on the number of Maxlots that the broker can open as well. You can optimize to get the best settings for this EA. I may be miscommunicating some things. Because I don't speak English very well. I'm sorry . Thank
Tired of information overload when analyzing forex currency strength? Introducing "All Currency Strength Live", the ultimate dashboard indicator for MetaTrader 5 that simplifies your trading life. This innovative tool provides a clear, concise overview of the strength of all major currencies, empowering you to make informed trading decisions with ease. With "All Currency Strength Live,"  you gain access to real-time insights into both price and volume strength across all major currencies. No mor
Vision AGI
Franck Martin
4.78 (9)
Vision AGI is the result of over a year of development to create this expert. Equipped with an advanced algorithm and a combination of personalized indicators, this new version is even more powerful, making it one of the most complete robots of its generation. With its intelligent real-time technology and trading strategy inspired by the best traders, it offers reliable long-term trading and knows how to adapt to the situations it encounters over time. Contact me immediately after the purchase
Fixed Trend
Oleksii Ferbei
The Fixed Trend indicator searches for and displays the turning point price on the chart. Trend indicators are one of the main tools for analyzing trends in the Forex currency market. The goal, which was pursued in its creation, is to obtain signals that will give less noise and respond more quickly to price changes. The Fixed Trend indicator is a trend indicator that is used to search for reversals when its boundaries break. Trend indicators allow you to effectively determine the direction
이 제품의 구매자들이 또한 구매함
TPSpro RFI Levels MT5
Roman Podpora
4.73 (11)
지침         러시아   -        영어       표시기와 함께 사용하는 것이 좋습니다   .       -       TPSpro   트렌드 프로 -   MT4 버전         거래에서 핵심 요소는 거래 상품을 매수 또는 매도하기로 결정하는 구역 또는 수준입니다. 주요 업체가 시장에서 자신의 존재를 숨기려는 시도에도 불구하고, 그들은 필연적으로 흔적을 남깁니다. 우리의 과제는 이러한 흔적을 식별하고 올바르게 해석하는 방법을 배우는 것이었습니다. 주요 기능:: 판매자와 구매자를 위한 활성 영역을 표시합니다! 이 지표는 매수 및 매도를 위한 모든 올바른 초기 임펄스 레벨/존을 보여줍니다. 진입점 검색이 시작되는 이러한 레벨/존이 활성화되면 레벨의 색상이 바뀌고 특정 음영으로 채워집니다. 또한 상황을 보다 직관적으로 이해하기 위해 화살표가 나타납니다. 더 높은 시간대의 레벨/존 표시(MTF 모드) 더 높은 시간 간격을 사용하여 레벨/존을 표시하는 기능을 추가했습니다.
TPSproTREND PrO MT5
Roman Podpora
4.89 (9)
TPSpro TREND PRO  - is a trend indicator that automatically analyzes the market and provides information about the trend and each of its changes, as well as giving signals for entering trades without redrawing! The indicator uses each candle, analyzing them separately. referring to different impulses - up or down impulse. Exact entry points into transactions for currencies, crypto, metals, stocks, indices!  Version MT4               DETAILED DESCRIPTION               R ecommended to use with an
우선 이 거래 시스템이 리페인팅, 리드로잉 및 레이그 인디케이터가 아니라는 점을 강조하는 것이 중요합니다. 이는 수동 및 로봇 거래 모두에 이상적인 것으로 만듭니다. 온라인 강좌, 설명서 및 프리셋 다운로드. "스마트 트렌드 트레이딩 시스템 MT5"은 새로운 및 경험이 풍부한 트레이더를 위해 맞춤형으로 제작된 종합적인 거래 솔루션입니다. 10개 이상의 프리미엄 인디케이터를 결합하고 7개 이상의 견고한 거래 전략을 특징으로 하여 다양한 시장 조건에 대한 다목적 선택이 가능합니다. 트렌드 추종 전략: 효과적인 트렌드 추이를 타기 위한 정확한 진입 및 손절 관리를 제공합니다. 반전 전략: 잠재적인 트렌드 반전을 식별하여 트레이더가 범위 시장을 활용할 수 있게 합니다. 스캘핑 전략: 빠르고 정확한 데이 트레이딩 및 단기 거래를 위해 설계되었습니다. 안정성: 모든 인디케이터가 리페인팅, 리드로잉 및 레이그가 아니므로 신뢰할 수 있는 신호를 보장합니다. 맞춤화: 개별 거래 선호도를 고려한 맞춤
Atomic Analyst MT5
Issam Kassas
4.42 (19)
우선적으로 언급할 점은이 거래 지표가 다시 그리지 않고 지연되지 않으며 이를 통해 수동 및 로봇 거래 모두에 이상적이라는 점입니다. 사용자 매뉴얼: 설정, 입력 및 전략. Atomic Analyst는 가격의 강도와 모멘텀을 활용하여 시장에서 더 나은 이점을 찾는 PA Price Action Indicator입니다. 고급 필터를 장착하여 잡음과 거짓 신호를 제거하고 거래 잠재력을 높이는 데 도움이 됩니다. 복잡한 지표의 다중 레이어를 사용하여 Atomic Analyst는 차트를 스캔하고 복잡한 수학적 계산을 간단한 신호와 색상으로 변환하여 초보 트레이더가 이해하고 일관된 거래 결정을 내릴 수 있도록합니다. "Atomic Analyst"는 새로운 및 경험이 풍부한 트레이더를위한 종합적인 거래 솔루션입니다. 프리미엄 지표와 최고 수준의 기능을 하나의 거래 전략에 결합하여 모든 종류의 트레이더에 대한 다재다능한 선택지가되었습니다. 인트라데이 거래 및 스캘핑 전략 : 빠르고 정확한
Quantum Trend Sniper
Bogdan Ion Puscasu
4.8 (49)
소개       Quantum Trend Sniper Indicator는   추세 반전을 식별하고 거래하는 방식을 변화시키는 획기적인 MQL5 지표입니다! 13년 이상의 거래 경험을 가진 숙련된 트레이더 팀이 개발한       Quantum Trend Sniper 표시기       매우 높은 정확도로 추세 반전을 식별하는 혁신적인 방법으로 거래 여정을 새로운 차원으로 끌어올리도록 설계되었습니다. ***Quantum Trend Sniper Indicator를 구입하면 Quantum Breakout Indicator를 무료로 받을 수 있습니다!*** Quantum Trend Sniper Indicator는 추세 반전을 식별하고 세 가지 이익실현 수준을 제안할 때 경고, 신호 화살표를 제공합니다. 초보자 거래자와 전문 거래자 모두에게 적합합니다. Quantum EA 채널:       여기를 클릭하세요 MT4 버전:       여기를 클릭하세요
TrendMaestro5
Stefano Frisetti
note: this indicator is for METATRADER4, if you want the version for METATRADER5 this is the link:  https://www.mql5.com/it/market/product/108106 TRENDMAESTRO ver 2.4 TRENDMAESTRO recognizes a new TREND in the bud, he never makes mistakes. The certainty of identifying a new TREND is priceless. DESCRIPTION TRENDMAESTRO identifies a new TREND in the bud, this indicator examines the volatility, volumes and momentum to identify the moment in which there is an explosion of one or more of these data a
이 대시보드는 선택한 심볼에 대해 사용 가능한 최신 고조파 패턴을 표시하므로 시간을 절약하고 더 효율적으로 사용할 수 있습니다 /   MT4 버전 . 무료 인디케이터:   Basic Harmonic Pattern 인디케이터 열 Symbol :   선택한 심볼이 나타납니다 Trend :   강세 또는 약세 Pattern :   패턴 유형(가틀리, 나비, 박쥐, 게, 상어, 사이퍼 또는 ABCD) Entry :   진입 가격 SL:   스톱로스 가격 TP1:   1차 테이크프로핏 가격 TP2:   2차 테이크프로핏 가격 TP3:   3차 테이크프로핏 가격 Current price:   현재 가격 Age (in bars):   마지막으로 그려진 패턴의 나이 주요 입력 Symbols :   "28개 주요 통화쌍" 또는 "선택한 심볼" 중에서 선택합니다. Selected Symbols :   쉼표로 구분하여 모니터링하려는 원하는 심볼("EURUSD,GBPUSD,XAUUSD")
FX Power MT5 NG
Daniel Stein
5 (5)
모닝 브리핑 여기 mql5 와 텔레그램에서 FX Power MT5 NG 는 오랫동안 인기 있는 통화 강도 측정기인 FX Power의 차세대 버전입니다. 이 차세대 강도 측정기는 무엇을 제공합니까? 기존 FX Power에서 좋아했던 모든 것 PLUS GOLD/XAU 강도 분석 더욱 정밀한 계산 결과 개별 구성 가능한 분석 기간 더 나은 성능을 위한 사용자 정의 가능한 계산 한도 특별 멀티더 많은 것을보고 싶은 사람들을위한 특별한 다중 인스턴스 설정 모든 차트에서 좋아하는 색상을위한 끝없는 그래픽 설정 수많은 알림 옵션, 중요한 것을 다시는 놓치지 않도록 Windows 11 및 macOS 스타일의 둥근 모서리가 있는 새로운 디자인 마법처럼 움직이는 인디케이터 패널 FX 파워 키 특징 모든 주요 통화의 완전한 강세 이력 모든 시간대에 걸친 통화 강세 이력 모든 브로커 및 차트에서 고유 계산 결과 100% 신뢰할 수있는 실시간100 % 신뢰할 수있는 실시간 계산-> 다시 칠하지 않음
Blahtech Supply Demand MT5
Blahtech Limited
4.54 (13)
Was: $299  Now: $99   Supply Demand uses previous price action to identify potential imbalances between buyers and sellers. The key is to identify the better odds zones, not just the untouched ones. Blahtech Supply Demand indicator delivers functionality previously unavailable on any trading platform. This 4-in-1 indicator not only highlights the higher probability zones using a multi-criteria strength engine, but also combines it with multi-timeframe trend analysis, previously confirmed swings
Entry Points Pro for MT5
Yury Orlov
4.46 (124)
다시 색을 칠하지 않고 거래에 진입할 수 있는 정확한 신호를 제공하는 MT5용 지표입니다. 외환, 암호화폐, 금속, 주식, 지수 등 모든 금융 자산에 적용할 수 있습니다. 매우 정확한 추정값을 제공하고 매수와 매도의 가장 좋은 시점을 알려줍니다. 하나의 시그널로 수익을 내는 지표의 예와 함께 비디오 (6:22)시청하십시오! 대부분의 거래자는 Entry Points Pro 지표의 도움으로 첫 거래 주 동안 트레이딩 결과를 개선합니다. 저희의   Telegram Group 을 구독하세요! Entry Points Pro 지표의 좋은점. 재도색이 없는 진입 신호 신호가 나타나고 확인되면(시그널 캔들이 완성된 경우) 신호는 더 이상 사라지지 않습니다. 여타 보조지표의 경우 신호를 표시한 다음 제거되기 때문에 큰 재정적 손실로 이어집니다. 오류 없는 거래 게시 알고리즘을 통해 트레이드(진입 또는 청산)를 할 이상적인 순간을 찾을 수 있으며, 이를 통해 이를 사용하는 모든 거래자의
FxaccurateLS
Shiv Raj Kumawat
WHY IS OUR FXACCCURATE LS MT5 THE PROFITABLE ? PROTECT YOUR CAPITAL WITH RISK MANAGEMENT Gives entry, stop and target levels from time to time. It finds Trading opportunities by analyzing what the price is doing during established trends. POWERFUL INDICATOR FOR A RELIABLE STRATEGIES We have made these indicators with a lot of years of hard work. It is made at a very advanced level. Established trends provide dozens of trading opportunities, but most trend indicators completely ignore them!
AT Forex Indicator MT5
Marzena Maria Szmit
5 (4)
The AT Forex Indicator MT5 is a sophisticated trading tool designed to provide traders with a comprehensive analysis of multiple currency pairs. This powerful indicator simplifies the complex nature of the forex market, making it accessible for both novice and experienced traders. AT Forex Indicator uses advanced algorithms to detect trends, patterns and is an essential tool for traders aiming to enhance their forex trading performance. With its robust features, ease of use, and reliable signal
Advanced Supply Demand MT5
Bernhard Schweigert
4.5 (14)
현재 33% 할인! 초보자나 전문 트레이더를 위한 최고의 솔루션! 이 보조지표는 우리가 다수의 독창적 기능과 새로운 공식을 통합한 독특하고 고품질이며 저렴한 거래 도구입니다. 이 업데이트를 통해 이중 시간대를 표시할 수 있습니다. 더 높은 TF를 표시할 수 있을 뿐만 아니라 차트 TF와 더 높은 TF 모두를 표시할 수 있습니다: 중첩 영역 표시. 모든 Supply Demand 트레이더들이 좋아할 것입니다. :) 중요한 정보 공개 Advanced Supply Demand의 잠재력을 극대화하려면 다음을 방문하십시오. https://www.mql5.com/ko/blogs/post/720245   진입 또는 목표의 명확한 트리거 포인트를 정확히 찾아냄으로 해서 거래가 어떻게 개선될지 상상해 보십시오. 새로운 알고리즘을 기반으로 매수자와 매도자 간의 잠재적인 불균형을 훨씬 더 쉽게 분간할 수 있습니다. 왜냐하면 가장 강한 공급영역과 가장 강한 수요 영역과 과거에 어떻게 진행 되었는지를(이
TPA True Price Action indicator reveals the true price action of the market makers through 100% non-repainting signals strictly at the close of a candle! TPA shows entries and re-entries, every time the bulls are definitely stronger than the bears and vice versa. Not to confuse with red/green candles. The shift of power gets confirmed at the earliest stage and is ONE exit strategy of several. There are available now two free parts of the TPA User Guide for our customers. The first "The Basics"
XQ Indicator MetaTrader 5
Marzena Maria Szmit
3 (2)
Step into the realm of Forex trading with confidence and precision using XQ, a cutting-edge Forex indicator designed to elevate your trading game to unprecedented heights. Whether you're a seasoned trader or just stepping into the world of currency exchange, XQ Forex Indicator empowers you with the insights and signals needed to make informed trading decisions. The signal conditions are a combination of three indicators, and XQ Forex Indicator only display  medium and long-term trends . The ind
PZ Swing Trading MT5
PZ TRADING SLU
5 (4)
Protect against whipsaws: revolutionize your swing trading approach Special Offer: Purchase now to receive free bonuses worth $135! (Read more for details) Swing Trading is the first indicator designed to detect swings in the direction of the trend and possible reversal swings. It uses the baseline swing trading approach, widely described in trading literature. The indicator studies several price and time vectors to track the aggregate trend direction and detects situations in which the market i
Trade smarter, not harder: Empower your trading with Harmonacci Patterns Special Offer: Purchase now to receive free bonuses worth $165! (Read more for details) This is arguably the most complete harmonic price formation auto-recognition indicator you can find for the MetaTrader Platform. It detects 19 different patterns, takes fibonacci projections as seriously as you do, displays the Potential Reversal Zone (PRZ) and finds suitable stop-loss and take-profit levels. [ Installation Guide | Up
FX Volume MT5
Daniel Stein
4.93 (14)
모닝 브리핑을 통해 세부 정보와 스크린샷으로 매일 시장 업데이트를 받으세요 여기 mql5 및 텔레그램에서 FX 거래량은 브로커의 관점에서 시장 심리에 대한 실제 통찰력을 제공하는 최초이자 유일한 거래량 지표입니다. 브로커와 같은 기관 시장 참여자가 외환 시장에서 어떤 포지션을 취하고 있는지에 대한 훌륭한 통찰력을 COT 보고서보다 훨씬 빠르게 제공합니다. 차트에서 이 정보를 직접 확인하는 것은 트레이딩의 진정한 판도를 바꾸고 획기적인 솔루션입니다. 다음과 같은 고유한 시장 데이터 인사이트의 이점 비율 는 통화의 매수/매도 포지션 비율을 백분율로 표시 비율 변화 는 선택한 기간 내 매수 비율과 비율 변화를 표시 총 거래량 는 해당 통화의 총 거래량(롱 및 숏)을 로트 단위로 보여줍니다 Volumes Long 는 해당 통화의 모든 롱 포지션의 거래량을 보여줍니다 Volumes Short 는 해당 통화의 모든 숏 포지션의 거래량을 보여줍니다 Net Long 는 순 롱 포지션의 거래량
Noize Absorption Index
Ekaterina Saltykova
Noize Absorption Index - is the manual trading system that measures the difference of pressure between bears forces and bulls forces. Green line - is a noize free index that showing curent situation. Zero value of index shows totally choppy/flat market.Values above zero level shows how powerfull bullish wave is and values below zero measures bearish forces.Up arrow appears on bearish market when it's ready to reverse, dn arrow appears on weak bullish market, as a result of reverse expectation.
PZ Support Resistance MT5
PZ TRADING SLU
4.17 (6)
Unlock key market insights with automated support and resistance lines Special Offer: Purchase now to receive free bonuses worth $75! (Read more for details) Tired of plotting support and resistance lines? This is a multi-timeframe indicator that detects and plots supports and resistance lines in the chart with the same precision as a human eye would. As price levels are tested over time and its importance increases, the lines become thicker and darker, making price leves easy to glance and ev
Gold Trend 5
Sergei Linskii
5 (1)
금 추세 - 좋은 주식 기술 지표입니다. 인디케이터 알고리즘은 자산의 가격 움직임을 분석하고 변동성과 잠재적 진입 구간을 반영합니다. 최고의 지표 신호: - 매도 = 빨간색 히스토그램 + 빨간색 숏 포인터 + 같은 방향의 노란색 신호 화살표. - 매수 = 파란색 히스토그램 + 파란색 롱 포인터 + 같은 방향의 아쿠아 신호 화살표. 인디케이터의 장점 1. 표시기는 높은 정확도로 신호를 생성합니다. 2. 확인된 화살표 신호는 추세가 바뀔 때만 다시 그릴 수 있습니다. 3. 모든 브로커의 메타트레이더 5 거래 플랫폼에서 거래할 수 있습니다. 4. 모든 자산(통화, 금속, 암호화폐, 주식, 지수 등)을 거래할 수 있습니다. 5. H1 차트주기(중기 트레이딩)에서 거래하는 것이 좋습니다. 6. 지표 설정에서 개별 매개 변수(TF, 색상 등)를 변경할 수 있으므로 각 트레이더가 지표를 쉽게 사용자 지정할 수 있습니다. 7. 이 보조지표는 독립적인 트레이딩 시스템뿐만 아니
이 대시보드는 선택한 기호에 대한 거래 전략에 따라 스캘핑 모드와 장기 모드 모두에서 차트의 공급 및 수요 영역을 검색하고 표시합니다. 또한 대시보드의 스캐너 모드를 통해 원하는 모든 기호를 한눈에 확인하고 적합한 위치를 놓치지 않도록 도와줍니다 / MT4 버전 . 무료 보조지표:   Basic Supply Demand 특징 여러 통화쌍에 대한 거래 기회를 볼 수 있으며, 공급 및 수요 영역에 대한 근접성에 따라 순위가 매겨진 모든 쌍을 명확하고 간결하게 볼 수 있습니다. 색상부터 감지 매개변수까지 특정 요구에 맞게 사용자 지정 설정 가능 주요 입력 Indicator mode :   표시기 모드 또는 새로운 기능이 포함된 패널 모드 중에서 선택 가능 Symbols :   "28개 주요 통화쌍" 또는 "선택한 심볼" 중에서 선택 Selected Symbols :   쉼표로 구분하여 모니터링하려는 원하는 심볼("EURUSD, GBPUSD, XAUUSD")을 선택합
Price Action Finder Multi MT5
Siarhei Vashchylka
5 (5)
The Price Action Finder Multi indicator is an indicator of entry points that searches for and displays Price Action system patterns on dozens of trading instruments and on all standard time frames: (m1, m5, m15, m30, H1, H4, D1, Wk, Mn). The indicator places the found patterns in a table at the bottom of the screen. By clicking on the pattern names in the table, you can move to the chart where this pattern is located. Manual (Be sure to read before purchasing) | Version for MT4 Advantages 1. Pa
Gold ATR MTF 5
Sergei Linskii
Gold ATR MTF - 이것은 훌륭한 주식 기술 지표입니다. ATR(Average True Range) 지표의 알고리즘은 자산 가격의 움직임을 분석하고 지정된 기간(D1) 시가의 지정된 백분율(%)로 해당 수준을 그려 변동성을 반영합니다. 기호 가격 이동 방향의 표시기(빨간색 및/또는 파란색 D1 H4)와 화살표 신호는 편안하고 수익성 있는 일중 거래 및/또는 스캘핑을 위한 추가적이고 필수적인 보조 도구입니다. 일일 이익은 외환 기호의 경우 20핍, 금 기호의 경우 50핍부터 가능합니다. 표시기 기능: 이것은 편안하고 수익성 있는 거래를 위한 매직, 추세 방향 탐지기 및 두 개의 추세 화살표 블록을 갖춘 슈퍼 지표입니다. 블록 전환을 위한 빨간색 버튼이 차트에 표시됩니다. 매직은 표시기 설정에서 설정되므로 서로 다른 블록을 표시하는 두 개의 차트에 표시기를 설치할 수 있습니다. Gold ATR MTF는 서로 다른 화살표 버퍼(FP 및 SA)를 사용하여 두 개의 차트에
Automated Trendlines MT5
Georgios Kalomoiropoulos
추세선은 외환 거래에서 기술적 분석의 가장 필수적인 도구입니다. 불행히도, 대부분의 거래자는 올바르게 그리지 않습니다. 자동 추세선 표시기는 시장의 추세 움직임을 시각화하는 데 도움이 되는 진지한 거래자를 위한 전문 도구입니다. 추세선 강세 추세선과 약세 추세선에는 두 가지 유형이 있습니다. 상승 추세에서 Forex 추세선은 가격 움직임의 가장 낮은 스윙 포인트를 통해 그려집니다. 최소 두 개의 "최저 저점"을 연결하면 추세선이 생성됩니다. 하락 추세에서 추세선은 가격 움직임의 가장 높은 스윙 포인트를 통해 그려집니다. 최소 두 개의 "최고 최고점"을 연결하면 추세선이 생성됩니다. 추세선이 깨질 때? 강세 추세선은 약세 양초가 강세 추세선 아래에서 닫히고 양초의 고점이 추세선 위에 있을 때 깨집니다. 약세 추세선은 강세 양초가 약세 추세선 위로 마감되고 양초 저점이 추세선 아래에 있을 때 깨집니다. 추세선이 삭제되면? 강세 추
Blahtech Market Profile MT5
Blahtech Limited
5 (9)
Was: $249  Now: $99   Market Profile defines a number of day types that can help the trader to determine market behaviour. A key feature is the Value Area, representing the range of price action where 70% of trading took place. Understanding the Value Area can give traders valuable insight into market direction and establish the higher odds trade. It is an excellent addition to any system you may be using. Inspired by Jim Dalton’s book “Mind Over Markets”, this indicator is designed to suit the
Order Block Hunter MT5
Noha Mohamed Fathy Younes Badr
5 (1)
Order block hunter indicator is the best indicator for  hunt the order blocks that area where there has been a large concentration of limit orders waiting to be executed Order blocks are identified on a chart by observing previous price action and looking for areas where the price experienced significant movement or sudden changes in direction .This indicator does that for you by using very complicated codes and helps you to take the best areas To buy and sell because it make marks at the best a
MetaForecast M5
Vahidreza Heidar Gholami
5 (2)
MetaForecast는 가격 데이터의 조화를 기반으로 모든 시장의 미래를 예측하고 시각화합니다. 시장이 항상 예측 가능한 것은 아니지만 가격에 패턴이 있다면 MetaForecast는 가능한 정확하게 미래를 예측할 수 있습니다. 다른 유사한 제품과 비교했을 때, MetaForecast는 시장 동향을 분석하여 더 정확한 결과를 생성할 수 있습니다. 입력 매개변수 Past size (과거 크기) MetaForecast가 미래 예측을 생성하기 위한 모델을 만드는 데 사용하는 막대의 수를 지정합니다. 모델은 선택한 막대 위에 그려진 노란색 선으로 표시됩니다. Future size (미래 크기) 예측해야 할 미래 막대의 수를 지정합니다. 예측된 미래는 핑크색 선으로 표시되며 그 위에 파란색 회귀선이 그려집니다. Degree (차수) 이 입력은 MetaForecast가 시장에서 수행할 분석 수준을 결정합니다. Degree 설명  0 차수 0의 경우, "Past size" 입력에 모든 봉우리
Golden Spikes Premium
Kwaku Bondzie Ghartey
Golden Spikes Detector Acknowledgement and Dedications:  The name of this indicator was Inspired by an Original; Mr Grant Koopman; a Knowledgeable and experienced Synthetics trader. I dedicate this indicator to Mr Grant.  Overview: The Golden Spikes Premium is a groundbreaking trading indicator meticulously crafted for the Boom and Crash indices on the Deriv market. Tailored to meet the needs of discerning traders, this powerful tool operates exclusively on the one-minute timeframe, providin
Market Overview MT5
Mehran Sepah Mansoor
시장 강세 및 심리지표로 매매 결정을 최적화하고 더 이상 추세에 역행하는 트레이딩을 하지 마세요! 정확하고 시기 적절한 정보를 중요시하는 진지한 트레이더를 위해 세심하게 설계된 이 지표는 28개 주요 통화쌍을 매우 간단한 방법으로 한눈에 볼 수 있습니다. 이 도구는 인기도, 강세 또는 약세 추세 강도, 매수자 및 매도자 비율 /   MT5   버전을 기준으로 통화쌍의 순위를 매길 수 있습니다.  특징 실시간 추세 강도: 각 통화쌍의 추세 강도를 정확하게 평가하여 거래 기회를 파악할 수 있는 확실한 가이드를 제공합니다. 매수자 및 매도자 분석: 각 통화쌍에 대한 매수 및 매도자 강세 순위를 통해 시장 역학에 대한 즉각적인 통찰력을 얻고 중요한 움직임을 예측할 수 있습니다. 트레이더 관심도: 각 통화쌍에 대한 트레이더 관심도 및 활동 데이터에 액세스하여 새로운 추세와 잠재적 전환점을 더 잘 이해할 수 있습니다. 직관적이고 사용자 지정 가능한 대시보드: 사용하기 쉬운 대시
제작자의 제품 더 보기
Trades Assistant MT5
Martin Muriu Maina
Trade Assistant MetaTrader System  — a multi-timeframe system that is based on three standard indicators:   Stochastic oscillator ,   RSI   (Relative Strength Index), and   CCI   (Commodity Channel Index). It displays current trend directions for M1, M5, M15, M30, H1, H4, D1, W1, and MN1 timeframes. When you follow such an indicator you have a clear picture of the trends across all important timeframes. It doesn't matter which timeframe you attach this indicator to. Input parameters CheckCandl
What is Trading Session Time indicator for MetaTrader? Trading Session Time indicator for MetaTrader is a tool designed to save your time and efforts. At the same time, it is also helpful to spot possible trading opportunities. The human brain is very efficient in finding visual patterns. Trading Session Time indicator helps highlight areas on the chart to find these patterns. Once you specify a time or an interval, the indicator will scan the chart and draw the areas of interest for you. The in
Forex Trade copier MT4/MT5.  It copies forex trades, positions, orders from any accounts to any other account, Be it MT4 or MT5 even multiple accounts. The unique copying algorithm exactly copies all trades from the master account to your client account. It is also noted for its high operation speed and Tough error handling. It also can copy from demo account to live account too. It is one of the best free trade copiers that can do , MT4 to another MT4 or MT5 or to multiple accounts ( МТ4 => МТ4
Market Profile MetaTrader System  — is a classic Market Profile implementation that can show the price density over time, outlining the most important price levels, value area, and control value of a given trading session. This indicator can be attached to timeframes between M1 and D1 and will show the Market Profile for daily, weekly, monthly, or even intraday sessions. Lower timeframes offer higher precision. Higher timeframes are recommended for better visibility. It is also possible to use a
Float
Martin Muriu Maina
Float MetaTrader indicator  — a sophisticated indicator that analyzes the previous chart history for the given currency pair and then tries to analyze the trends in the current situation. It shows where trends start and end in a separate chart window and   Fibonacci retracement   levels combined with DiNapoli levels on the main chart. It also displays how long ago the local high and low were detected. This indicator is available for MT4 and MT5. The indicator   repaints   its levels based on all
Point and figure
Martin Muriu Maina
Point-and-Figure MetaTrader 5 indicator   is an indicator that can plot a point-and-figure chart directly in the main window of your normal MT5 chart. You can set up all the point-and-figure method parameters, such as the box size and the reversal distance, according to your preference. In addition, you can control all the display parameters of the PnF chart. This point-and-figure indicator supports all sorts of alerts. It is based on real ticks data, and thus is available only for MT5. Point-an
Moving Average Candlesticks MetaTrader indicator  — is a chart visualization of a standard   moving average   using the candlestick bars. It draws the candlesticks based on the moving average values calculated for Close, Open, Low, and High. It allows seeing a compact snapshot of the more detailed market information compared with the classic MA indicator. It works with any currency pair, timeframe, and MA mode. The indicator is available for MT4 and MT5. Input parameters MAPeriod   (default = 10
Break even indicator
Martin Muriu Maina
Breakeven Line Indicator   is a MetaTrader indicator that calculates breakeven level based on all open positions and displays it on your chart as a horizontal line. Additionally, it will calculate the total number trades, the total number of lots, and the distance to the breakeven line in points and profit/loss. The indicator is available for both MT4 and MT5. You can press the   Shift + B   keyboard shortcut to hide or show the breakeven line. The indicator supports multiple input parameters to
필터:
리뷰 없음
리뷰 답변