Follow the trends
- 지표
- Shengzu Zhong
- 버전: 1.1
- 활성화: 10
5부씩 판매될 때마다 가격이 30달러씩 오를 것입니다.
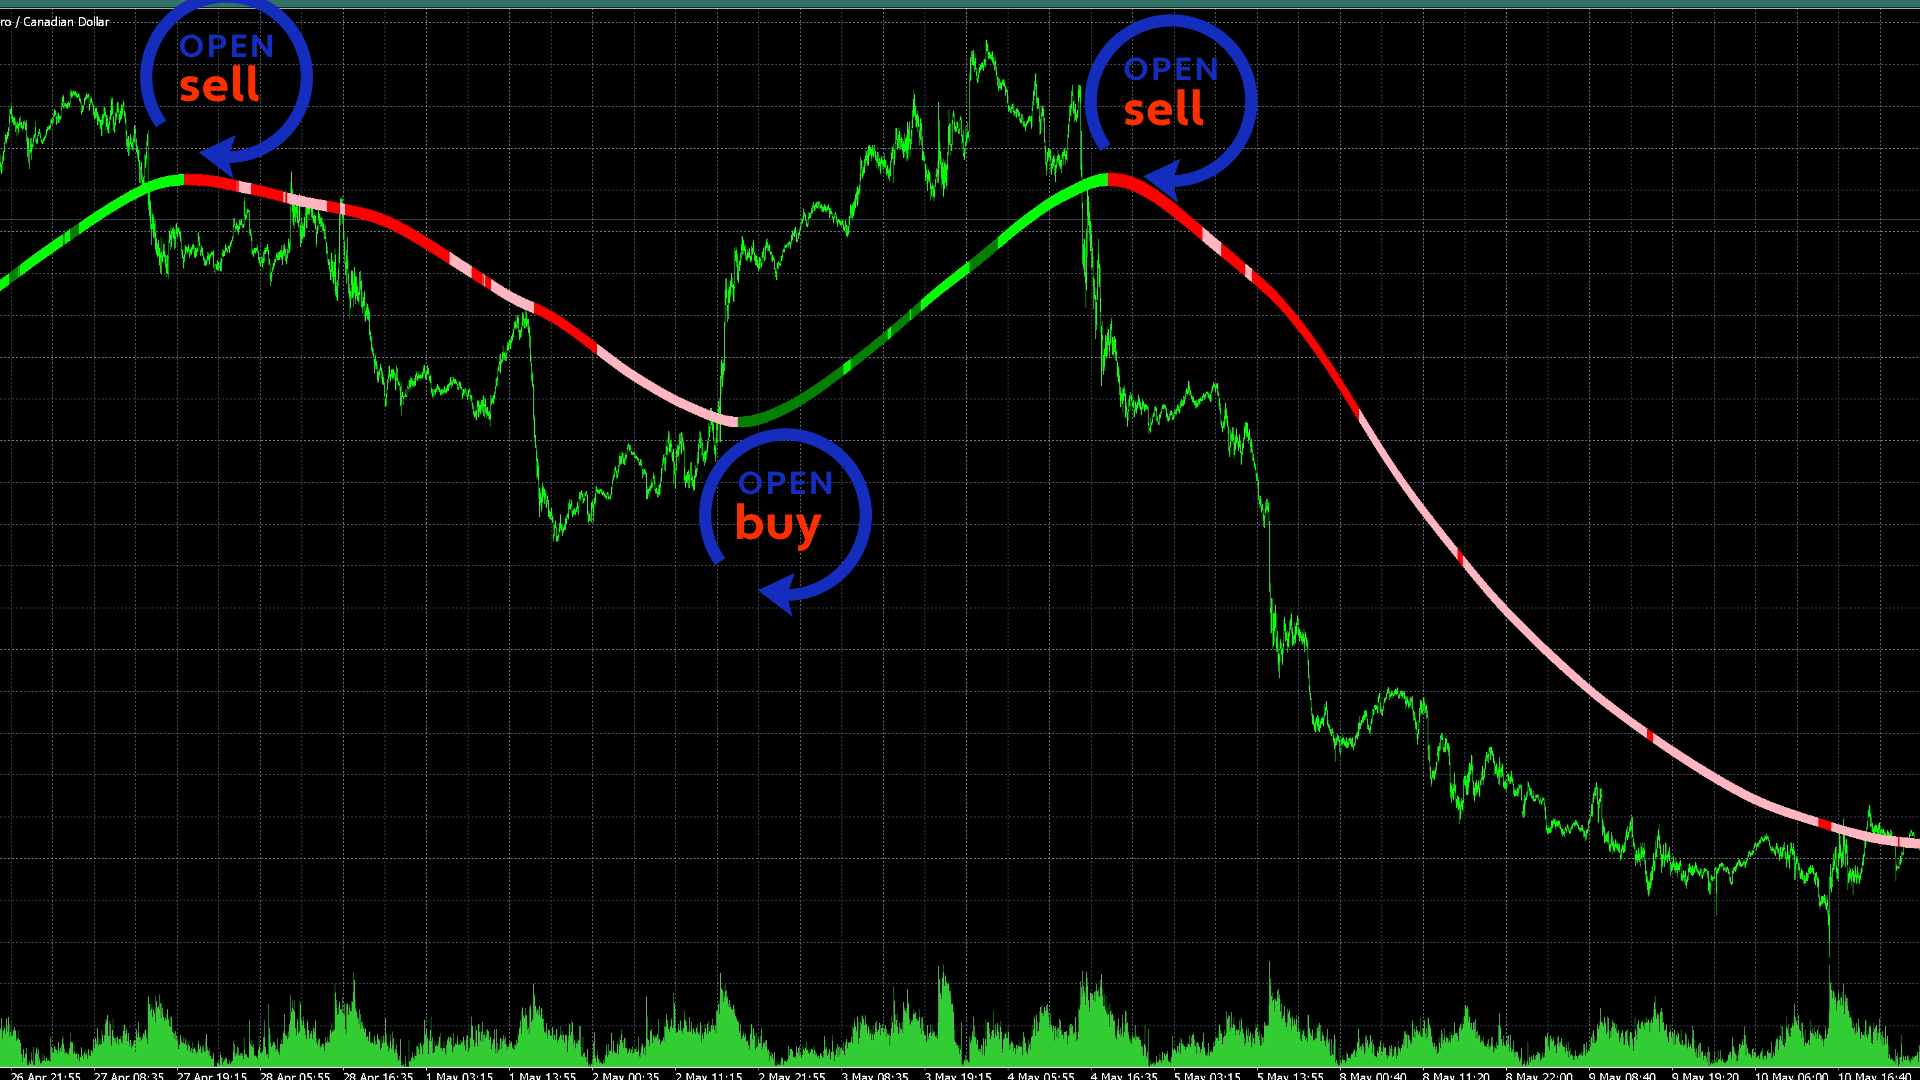
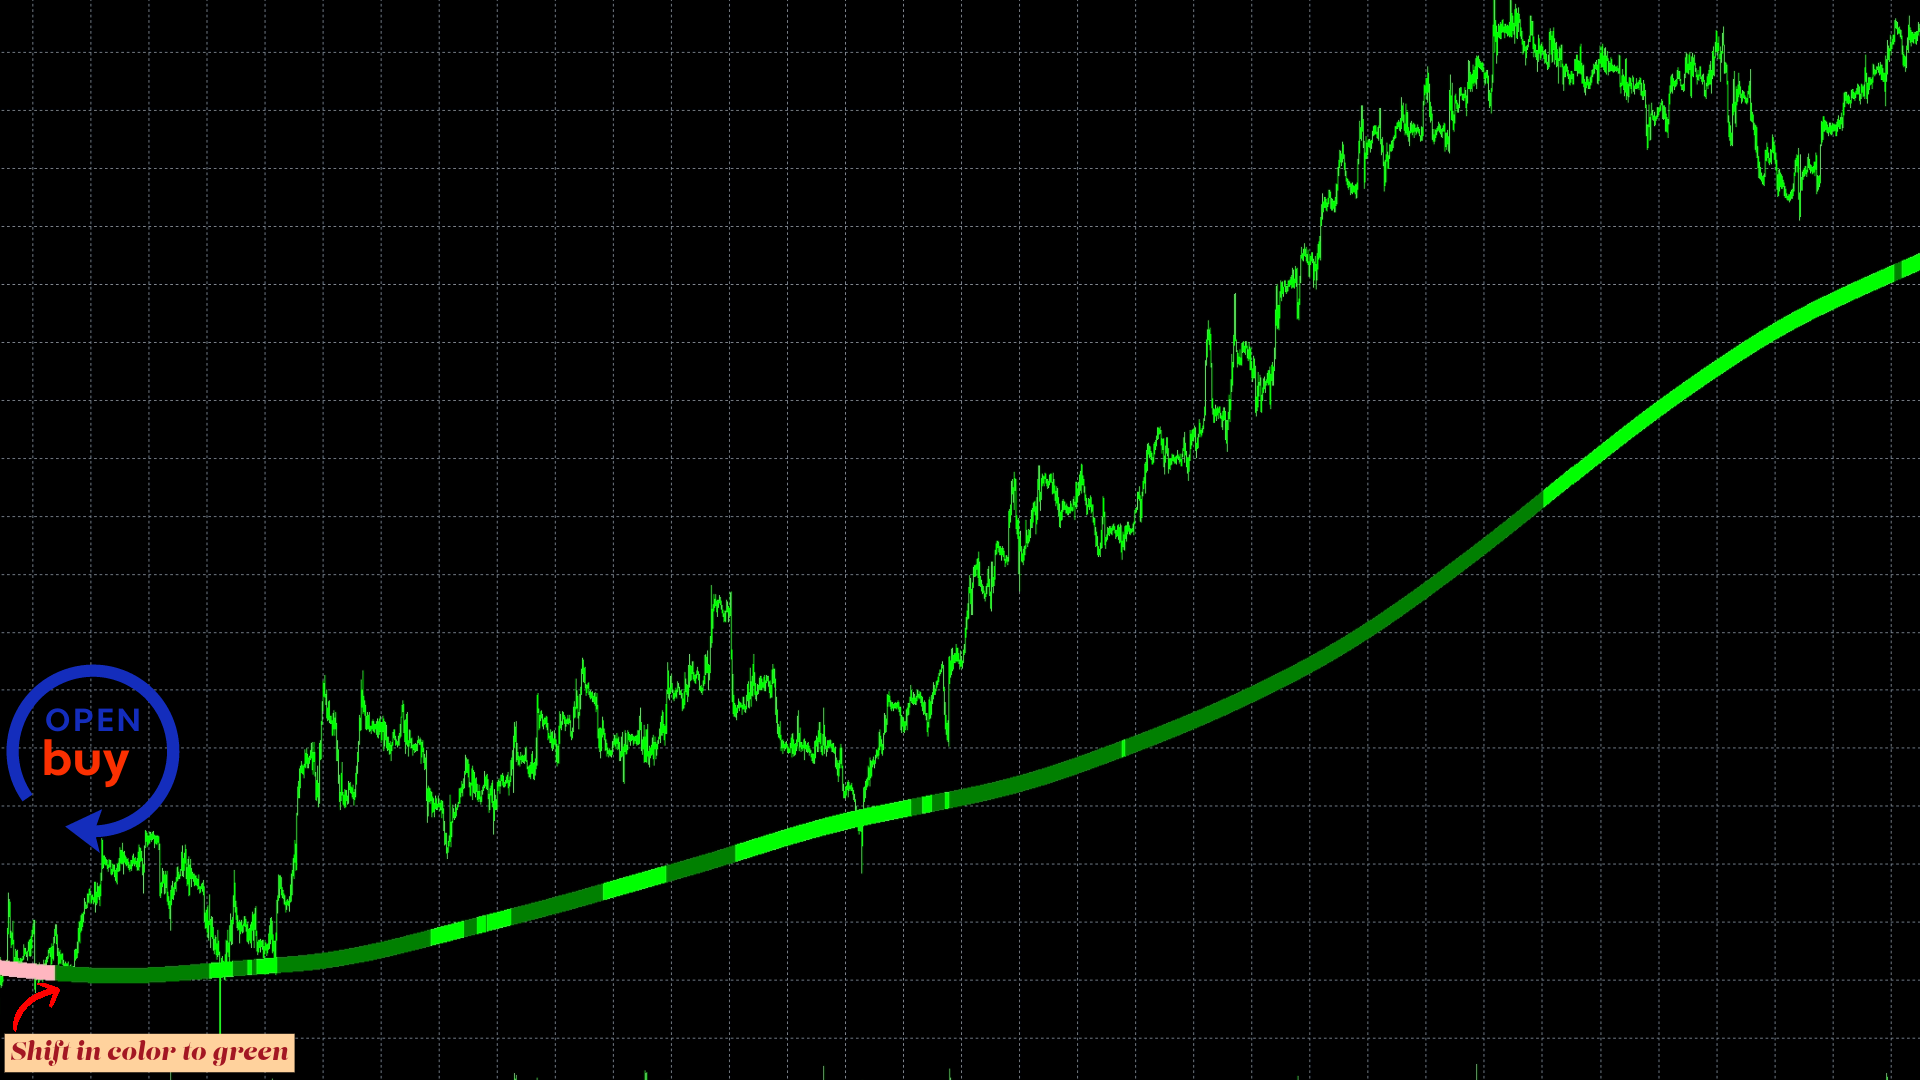
주요 지표는 전체 시장 트렌드를 파악하는 것을 목표로 합니다. 밝은 색과 어두운 색의 컬러 시스템은 강한 시장 조건과 약한 시장 조건을 식별하려는 노력입니다.
내 의견으로는, 이 지표는 비할 데 없이 탁월하게 작동합니다. 시장이 움직이기 시작할 때 특히 효과적입니다.
더 나은 결과를 얻기 위해 1시간, 4시간 또는 일일과 같은 더 긴 시간대에 해당 지표를 사용하고 싶다면, 그렇게 하십시오.
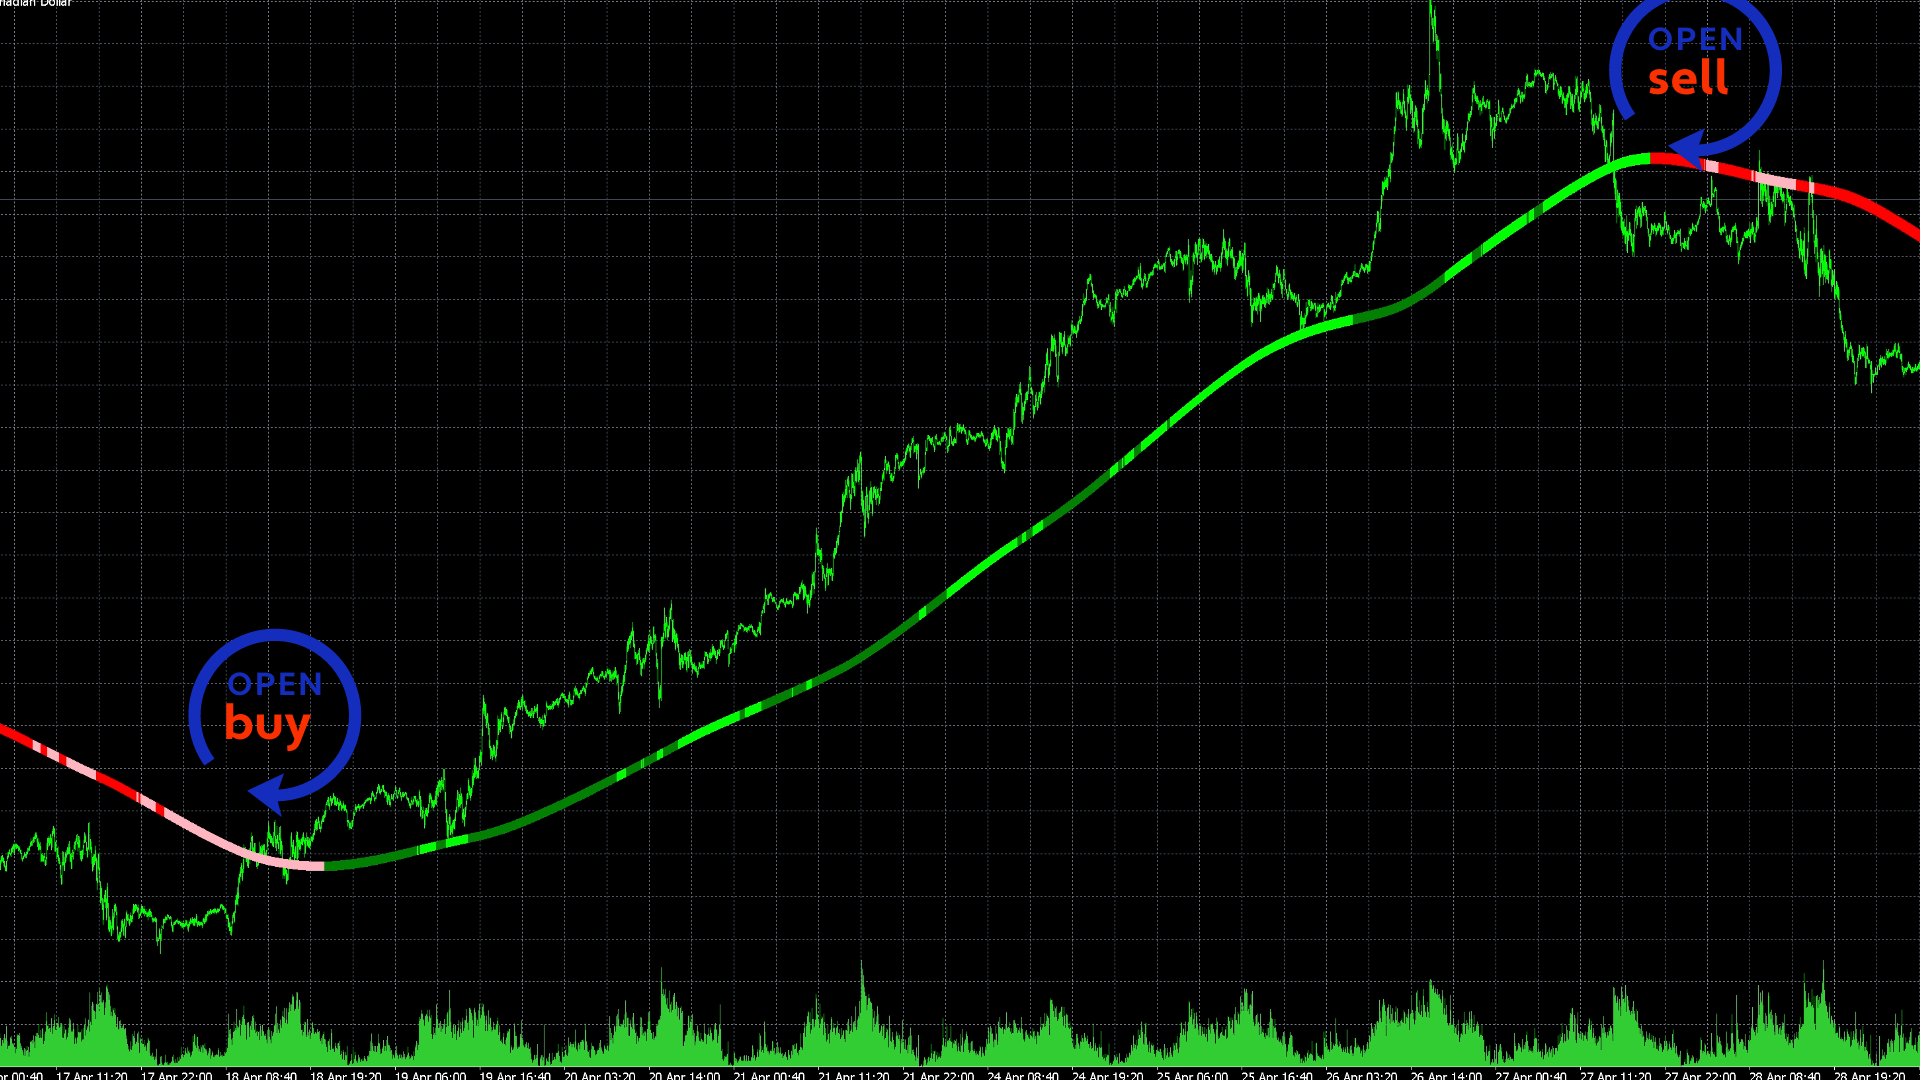
색상이 녹색으로 변경되면 매수 기회를 나타내며, 빨간색으로 변경되면 공매도 포지션을 열 것을 나타냅니다.
최적의 결과를 얻기 위해 트렌드가 있는 통화 쌍과 거래를 고려하십시오.
이것이 도움이 되길 바랍니다. 이를 활용할 방법을 찾게 되면, 친구와 공유해 주시기 바랍니다. 감사합니다.