MetaTrader 5용 트레이딩 유틸리티 - 17

This tool is designed to measure the distance between two points on a chart and much more.
List of measured values:
Distance in points Profit (with and without spread) Time difference Percentage price change Slope angle Number of bars (various variations) Ratio of distance in points to the reference value Features:
Snap to OHLC prices Automatic color profile setting based on chart background color Various types of pointers to choose from Display of values of selected points o

My Money Manager like a risk controller, which places your trades with the exact volume that meets your desired stop loss risk percentage. It can also help you to preview your EP/SL/TP levels before placing an order by dragging these levels directly on a chart, and keep reporting about them during the position opening. With this tool, you will feel more comfortable when deciding to open orders, as well as forecasting your profit/loss with your orders. Placing orders is a very precise and profess

News Loader Pro is a tool that automatically updates every economic news in real time with detailed information from several online data sources. It uses the unique technology to load data with full details from popular Forex websites. An alert will be sent to your mobile/email before an upcoming news release. Moreover, it also marks the news release points on the chart for further review and research. In Forex trading, news is one of the important factors that move the market. Sticking with ne

This is a ready-made professional position tracking system. It works on all currency pairs and timeframes. The product processes the errors correctly and works on the market efficiently. The trading robot applies basic concepts - breakeven and trailing. The trailing is based not on indicators but on the last bar of the specified time interval ( TrailingStep Period ) or points ( Trailing Stop =0). Parameters: Deviation – requotes. Sleeps – waiting for position modification. Trailing Period – the

This is a utility created to ease charts watching on tablet PCs. The indicator allows you automatically alternately display "slide show" of all currency charts from "MarketWatch". The user can set the display time interval (in seconds) between charts in indicator settings. In addition, there is an option of selecting the angle of Start/Stop button which starts and stops the display of charts. This function is very useful if a trader noticed a trading signal and would like to study it in more det

The idea of enhancing the free Slider utility appeared after the release of a lite version of the EA trade panel Trading Chaos Expert Lite , which operates in the Current Chart mode without the possibility to maintain trades of several symbols in a single window. The purpose of Slider profy Ease search for trading signals by automatic display of charts of currency pairs from the "Market Watch" one by one at a specified interval of time in seconds. Automation of one-click placing of pending ord

The script allows to close all opened positions if Sum of Profit from all opened positions is greater than value of the input parameter: SumProfit .
Input parameters SumProfit = 100 You can change SumProfit to any positive value ( in dollars , not in the points!). This script will close all positions for a given currency pair only. Keep in mind that you have to " Allow automated trading " on the "Expert Advisors" tab (Tools->Options).

BuyStop_SellStop_Grid script opens BuyStop and SellStop pending orders and deletes all existing pending orders. You just need to drop this script on the chart with a desired currency pair. Before placing all pending orders, the input window is opened allowing you to modify all input parameters: DeleteAllPending - if TRUE, then all pending orders are deleted; BuyStop - if TRUE, BuyStop order is opened; SellDtop - if TRUE, SellStop order is opened; InitLot - initial lot; LotCoeff - if 1, all pen

BuyLimit_SellLimit_Grid script opens Buy Limit and Sell Limit pending orders. You just need to drop this script on the chart with a desired currency pair. Before placing all pending orders, the input window is opened allowing you to modify all input parameters: DeleteAllPending – if 'true', all pending orders are deleted. BuyLimit – if 'true', Buy Limit order is opened. SellLimit – if 'true', Sell Limit order is opened. InitLot – initial lot. LotCoeff – if 1, all pending orders have the same lot

Complete Pending Orders Grid System opens any combinations of Buy Stop, Sell Stop, Buy Limit and Sell Limit pending orders and closes all existing pending orders. You just need to drop this script on the chart of a desired currency pair. Before placing all pending orders, the input window is opened allowing you to modify all input parameters: DeleteAllPendings – if 'true', then all pending orders (for current currency) are deleted. BuyStop – if 'true', Buy Stop order is opened. SellStop – if 'tr

The Candle Length Indicator Alarm generates a sound alert, sends a push notification and an email when the size of the current candlestick changes. The size of the current candlestick can be measured in two ways: The first method: the size of the candlestick is measured from the beginning of the candlestick (from the OPEN price). The second method: the size of the candlestick is measured from current price. The indicator has the following settings: sound — a sound file from the folder: "...\Meta

KL Visual Risk Manager Pro – the tool for traders for whom capital preservation is a top priority. Let me present my new revolutionary method of sending orders according to what you see on a chart, which is in full accordance with Risk Management. Sending orders without human errors, using an appropriate currency pair, without gambling a lot size and with SL and TP set on chart according your technical analysis and methodology - all these are made in four mouse clicks and in a matter of seconds.

Ermou Street rather than an expert or an indicator is a all-in-one trading assistant easing your trading sessions by providing signals and notifications. It's an assistant rather than a robot - "an assisted steering rather than an autopilot", and now, it autoadjusts itself to any instrument, any timeframe & any circumstance.
How to First, you should watch the video. Then here's some explanation: By default, attaching Ermou Street to a chart, you’ll get: A panel Signals: buy (default blue arrow
Pending Orders Grid Complete System opens any combination of Buy Stop, Sell Stop, Buy Limit and Sell Limit pending orders and closes all existing pending orders. You will be able to Drag-and-Drop the Script on the chart and it will pick up the start price for the first position in the grid from the "Drop" point. Usually it should be in the area of Support/Resistance lines.
Input Parameters Before placing all pending orders, the input window is opened allowing you to modify all input parameters

All Pending Orders with StopLoss opens any combination of Buy Stop, Sell Stop, Buy Limit and Sell Limit pending orders and closes all existing pending orders. If boolSL = true then this Script will calculate one common StopLoss value as the StopLoss for a first/last orders and put this value in all pending orders.
Input Parameters Before placing all pending orders, the input window is opened allowing you to modify all input parameters: DeleteAllPendings : if true , then all pending orders (for
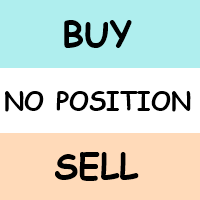
The Buy Sell Color Background indicator changes the background color depending on position direction. It has three settings: Background color for BUY - background color for a Buy position Background color for SELL - background color for a Sell position Default background color - background color with no open position After you detach the indicator from a chart, its background color changes to Default background color .
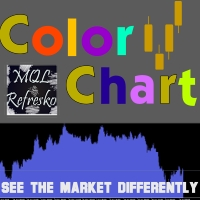
Visualize your charts differently in MetaTrader 5. The product is good for comparing the prices, since the indicator draws High, Close, HLC, etc. It is useful when applied with other indicators (like MACD). This simple indicator colors the entire space below the chart allowing you to see the market with greater clarity. You will see the actual price, trends, and the market behavior.
Indicator parameters Applied_Price : From this option you can select the type of price you want to draw with the
BuyLimit and SellLimit Buttons opens any combination of Buy Limit and Sell Limit pending orders and closes all existing pending orders.
Inputs Before placing all pending orders, the input window is opened allowing you to modify all input parameters: DeleteAllPendings ; if true , all pending orders (for the current currency) can be deleted. BuyLimit ; if true , Buy Stop orders can be opened. SellLimit ; if true , Sell Stop orders can be opened. InitLot ; initial lot size. LotCoeff ; next lot si

HWAFM (the harmonic wave analysis of the financial markets) Harmonic trading involves searching for certain price patterns (specimens) and Fibo numbers in order to define highly probable price reversal points. The method is based on the assumption that trade patterns or cycles repeat themselves just like in real life. The main objective is to identify these patterns, as well as position entries/exits. The analyzer is based on a high degree of probability, which is confirmed by the price movement
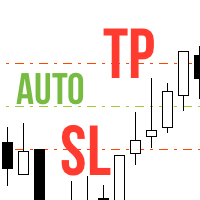
Never forget to set Stop Loss or Take Profit! This little EA automatically sets predefined Stop Loss and Take Profit levels on every new pending or market order. You can specify Stop Loss and Take Profit distances in pips in the EA settings dialogue. Please note that there is only one EA necessary for all charts of the same symbol. The EA works with all symbols within Metatrader 5.

Draw Agent는 모든 차트 분석, 낙서, 메모 등을 만들고 관리할 수 있는 아름답고 혁신적인 방법으로 설계되었습니다. 이 도구는 차트 공간을 칠판으로 취급하고 손으로 그리는 자유 그리기 방법을 제공합니다. 이 자유형 그리기 도구를 사용하면 차트에서 이벤트를 표시하거나 강조 표시하기 위해 MT4/MT5 차트에 그릴 수 있습니다. Elliott 파동을 손으로 작성하거나, 차트에 선을 긋거나, 차트에 아이디어를 설명하려는 경우 유용한 도구입니다. 클라이언트를 위한 라이브 웨비나를 실행하거나 사람들에게 스크린샷 또는 차트 파일을 배포하는 경우 특히 유용합니다. 또한. Draw Agent 설치 및 입력 가이드 EA 추가 URL( http://autofxhub.com ) MT4/MT5 터미널(스크린샷 참조) 에 대한 알림을 받으려면 . MT4 버전 https://www.mql5.com/en/market/product/14929 MT5 버전 https://www.

원 클릭 분석 도구는 키보드 단축키 기반 객체 생성 MetaTrader용 복사 도구입니다. 클릭 한 번으로 MetaTrader의 분석 도구를 쉽게 사용할 수 있습니다. 당사의 도구를 사용하면 지지 및 저항 수준, 피보나치 수준, 도형, 채널, 추세선 및 기타 모든 개체를 차트에 빠르게 그릴 수 있습니다. 버튼을 클릭하고 마우스를 움직이면 One Click Analysis Tool이 나머지 작업을 수행합니다. 이를 통해 시간을 절약하고 차트 분석을 보다 효율적으로 수행할 수 있으므로 분석을 기반으로 정보에 입각한 거래 결정을 내리는 데 집중할 수 있습니다. 개체 생성 외에도 One Click Analysis Tool에는 다음이 포함됩니다. 개체 복사기( 차트 동기화)를 사용하면 한 차트에서 다른 차트로 개체를 쉽게 복사할 수 있습니다. 이는 여러 차트가 열려 있고 차트 간에 개체를 복제해야 하는 경우에 특히 유용할 수 있습니다. 원 클릭 분석

Elliott Wave Counter는 Elliott 파동의 빠르고 사용자 친화적인 수동 마크업을 위한 패널입니다. 색상과 마크 수준을 선택할 수 있습니다. 도구에서 만든 마지막 마크업과 전체 마크업을 제거하는 기능도 있습니다. 한 번의 클릭으로 마크업이 이루어집니다. 5번 클릭 - 5개의 웨이브가 있습니다! Elliott Wave Counter는 Elliott 파동의 초보자와 전문 분석가 모두에게 훌륭한 도구가 될 것입니다. Elliott Wave Counter 설치 및 입력 가이드 당신이 얻고 싶다면 EA 추가 URL( http://autofxhub.com ) MT5 터미널에 대한 알림 (스크린샷 참조). MT4 버전 https://www.mql5.com/en/market/product/14016 MT5 버전 https://www.mql5.com/en/market/product/15081 일반 입력: 웨이브 유형 버튼: 이 버튼을 사용하면 차트

트레이더가 선택한 모든 상품의 차트를 별도의 창에 표시하는 패널 형태의 다중 통화 모니터링 도구입니다. 거래자는 여러 다른 상품과 다른 기간에 대한 가격 움직임을 시각적으로 분석하여 선택한 상품을 빠르게 전환할 수 있습니다. TradePad 제품 설명 페이지에서 데모 버전을 사용할 수 있습니다. https://www.mql5.com/en/blogs/post/751207 다른 빠른 거래 유틸리티 - TradePad 에 포함됨 옵션 Indicator UID - 고유 식별자. 실행 중인 각 사본에는 고유한 ID가 있어야 합니다. to open a chart in the... - 매개변수는 기기 차트를 여는 규칙을 설정합니다. current window - 현재 차트 창 new window - 새 차트 창 Broker company label - 푸시 알림에 사용할 회사 이름, 예: (MQ MT5) - ' EURUSD,Daily: Possible change tre

If you wish to draw Support and Resistance lines, view: daily market opening, classical pivot levels, Fibonacci pivot levels, trend lines, Fibonacci levels, the remaining time to candle closing, and current spread. If you seek to place your orders with the exact lot that meets your desired stop loss risk. If you wish to do all this and more with just one click, then this is the perfect tool to use. This tool will allow you to feel more relaxed when deciding to open orders, as well as predicting

The calculator of signals operates directly from the MetaTrader 5 terminal, which is a serious advantage, since the terminal provides a preliminary selection and sorts out signals. This way, users can see in the terminal only the signals that ensure a maximum compatibility with their trading accounts. The calculator of signals gives the answer to the one of the questions most frequently asked by users of the Signals service: "Will I be able to subscribe to the signal NNN, and what volume of the

The Expert Advisor modifies the Stop Loss orders of positions opened for the instrument of the current chart based on the custom indicator values. It is possible to use both the default settings or your own. Integrates NRTR (Nick Rypock Trailing Reverse) , Moving Average indicators and linear regression channel. Attention! To use the adviser, you must have minimal knowledge! Namely, to be able to look into the indicator code. You need to know the indicator buffer number in which support values a

This utility allows you to quickly switch the charts between symbols of Market Watch window. To switch between the symbols, use the [Up] and [Down] and automatically the next symbol in Market Watch will be showed on the current chart and also current template. If you want to separate a symbol for later analysis, hit Enter and the chart will open in a new tab and you can continue switching the symbols. Set the max bars in chart to 1000 to a great experience.

The product combines a manual trade panel with the ability to perform actions automatically in a highly configurable way. Actions include capturing indicator values and then based on those values raising alerts, open/close or partially close trades, scale-in, setting up pending orders, adjusting stop loss, take profit and more. On-chart controls can be configured, such as tick boxes and buttons, so can be fully interactive. The EA also handles money management, news events, hidden stop loss, tak
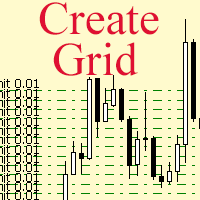
The script allows to use the mouse for placing a grid of orders with fixed or variable step quickly and with as few mistakes as possible. Drag the script to the chart using the left mouse button and release. The grid will be plotted starting from that point. If the current price is lower than the grid start point, the grid will be placed "to the north" towards the buys, and if higher - towards the sells, "to the south". Setting take profit and stop loss is left to trader's discretion.
Input Pa
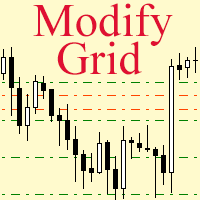
Modify the take profit and stop loss of orders grid using the mouse. Drag the script to the chart using the left mouse button and release. The script sets a single stop loss and take profit to all positions and pending orders separately, using the price value at the final point of dragging.
Input Parameters Buy or sell - the type to be modified. There are two options: All BUY - all buy orders and positions (this parameter is set to All BUY by default.)
All SELL - all sell orders and positions

This utility provides the ability to use hot keys in manual trading instantly responding to the current market situation. You can assign hot keys to open/close positions by their type, open/close all positions on the current chart and remove all orders on the current chart. You can also assign hot keys for five predefined trade volumes and switch between them if necessary with no need to change the volume manually from time to time. It is also possible to set the auto calculation of a trade volu
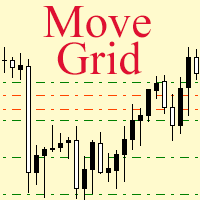
If a complex grid with specified stop loss and take profit levels has been created in the wrong place by mistake, it is not necessary to remove it and start over again. The grid can be moved to a new place using the mouse. Drag the script to the chart and drop it where the grid should be moved. The grid will be moved, keeping the distance between orders, distances to stop loss and take profit. The script works exclusively with pending orders , market orders will be left unchanged.
Input Parame
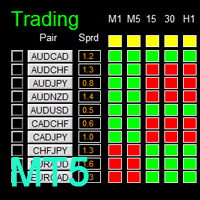
如果产品有任何问题或者您需要在此产品上添加功能,请联系我 Contact/message me if you encounter any issue using the product or need extra feature to add on the base version.
There is Demo version of this panel Dashboard Super Candle DEMO in my product list, please try it out to get familiar with all functionalities for free, LINK . Dashboard Super Candle gives you a quick visual guide to which pair’s short-term, medium-term, and long-term direction/trend are aligned. With the combination of these trend, you are able to moni
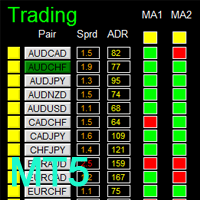
如果产品有任何问题或者您需要在此产品上添加功能,请联系我 Contact/message me if you encounter any issue using the product or need extra feature to add on the base version.
There is Demo version of this panel Dashboard Super MA RSI CCI Demo in my product list, please try it out to get familiar with all functionalities for free, LINK . Dashboard Super MA RSI CCI is an intuitive and handy graphic tool to help you to: Have 28 pairs under control with one dashboard Monitor price movement, identify possible trend based on MA, R
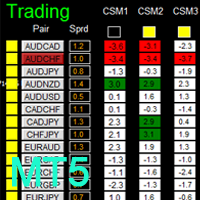
如果产品有任何问题或者您需要在此产品上添加功能,请联系我 Contact/message me if you encounter any issue using the product or need extra feature to add on the base version.
There is Demo version of this panel Dashboard Timeframe 15 Demo in my product list, please try it out to get familiar with all functionalities free, LINK . This system basically utilizes TDI as the core indicator to generate trading signal mainly on time-frame M15. The signal will be further filtered and trimmed by 1) 200 EMA and Price; 2) 10 EMA and
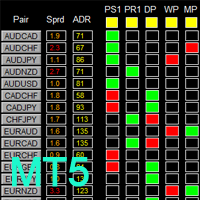
如果产品有任何问题或者您需要在此产品上添加功能,请联系我 Contact/message me if you encounter any issue using the product or need extra feature to add on the base version.
To access the free demo version, please re-direct to this LINK . To access the single pair version, please re-direct to this LINK . There are two critical components in a profitable trading system, one is entry (place an order), and another one is exit (close an order). You can exit by time: closing order after London Close for example. You can also exi
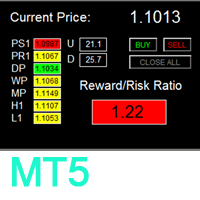
如果产品有任何问题或者您需要在此产品上添加功能,请联系我 Contact/message me if you encounter any issue using the product or need extra feature to add on the base version.
To access the free demo version, please re-direct to this LINK . To access the dashboard version, please re-direct to this LINK . There are two critical components in a profitable trading system. One is entry (placing an order) and another one is exit (closing an order). You can exit by time: closing order after London Close, for example. You can also e
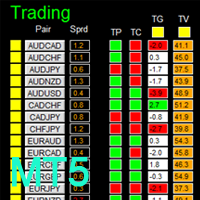
如果产品有任何问题或者您需要在此产品上添加功能,请联系我 Contact/message me if you encounter any issue using the product or need extra feature to add on the base version.
There is a demo version of this panel Dashboard Trading Made Simple Demo in my product list, please try it out to get familiar with all functionalities free, LINK . This system basically utilizes TDI as the main indicator to generate trading signal mainly on H1 and H4 time-frame. The signal will be further filtered and trimmed.
Stochastic; Heiken Ashi
如果产品有任何问题或者您需要在此产品上添加功能,请联系我 Contact/message me if you encounter any issue using the product or need extra feature to add on the base version.
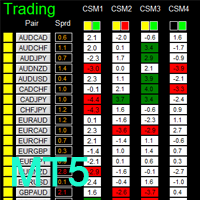
There is a Demo version of this panel Dashboard Currency Strength Advanced MT5 Demo in my product list, please try it out to get familiar with all functionalities for free, Free version: LINK . MT4 version: LINK
The Dashboard Currency Strength Meter Advanced gives you a quick visual guide to which currencies are strong, and which ones are weak over th
如果产品有任何问题或者您需要在此产品上添加功能,请联系我 Contact/message me if you encounter any issue using the product or need extra feature to add on the base version.
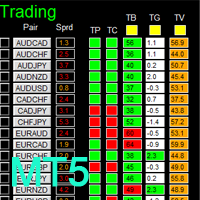
There is Demo version of this panel Dashboard Timeframe 15 MT5 Demo in my product list, please try it out to get familiar with all functionalities free. Free version: LINK MT4 version: LINK This system basically utilizes TDI as the core indicator to generate trading signal mainly on time-frame M15. The signal will be further filtered and trimmed by 1) 2
如果产品有任何问题或者您需要在此产品上添加功能,请联系我 Contact/message me if you encounter any issue using the product or need extra feature to add on the base version.
There is Demo version of this panel Dashboard Super Three MA MT5 Demo in my product list, please try it out to get familiar with all functionalities for free Free version: LINK MT4 version: LINK This system basically utilizes PA and three adjustable Moving Average as the main indicator set to generate trading signal. With the feature that all MA_timefra
如果产品有任何问题或者您需要在此产品上添加功能,请联系我 Contact/message me if you encounter any issue using the product or need extra feature to add on the base version.
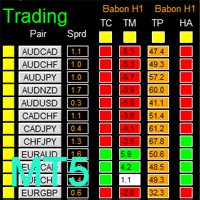
There is Demo version of this panel Dashboard Babon Scalping System MT5 Demo in my product list, please try it out to get familiar with all functionalities for free. Free version: LINK MT4 version: LINK This system basically utilizes TDI, Heiken Ashi Trend, Price Trend on H1 time-frame and TMA on H1&H4 time-frame to generate the trend (big picture). The
如果产品有任何问题或者您需要在此产品上添加功能,请联系我 Contact/message me if you encounter any issue using the product or need extra feature to add on the base version.
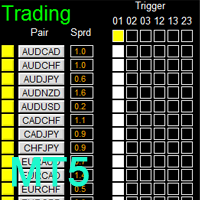
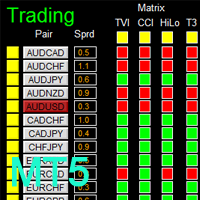
There is Demo version of this panel Dashboard Genesis Matrix Trading MT5 Demo in my product list, please try it out to get familiar with all functionalities for free. Free version: LINK MT4 version: LINK This system basically utilizes Genesis Indi Set (TVI, CCI, GannHilo, and T3) as the core indicators to generate trading signal mainly on time-frame M15
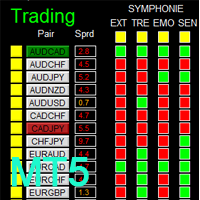
There is Demo version of this panel Dashboard Symphonie Trader System MT5 Demo in my product list, please try it out to get familiar with all functionalities for free. Free version: LINK MT4 version: LINK This system basically utilizes Symphonie Indicator Set (Extreme, Emotion, Trend, and Sentiment) as the core indicators to generate trading signal mainly on time-frame M15. The signal will be further filtered and trimmed by 1) M5 and M15 Stochastic; 2) EMA5 and PA To facilitate you to understan
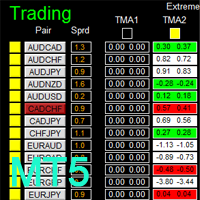
There is Demo version of this panel Dashboard Extreme TMA System MT5 Demo in my product list, please try it out to get familiar with all functionalities for free. Free version: LINK MT4 version: LINK This system basically utilizes 4 TMA (Triangular Moving Average) slope indicators on 4 time-frame and TMA Band as the core indicators to generate trading signal mainly on time-frame M15. The signal will be further filtered and trimmed by M15 Stochastic To facilitate you to understand and trade this
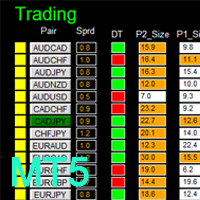
MT4 version: LINK DIBS = Daily Inside Bar Setup This system basically utilizes the popular candle pattern Inside Bar to generate trading signal mainly on time-frame H1. To facilitate you to understand and trade this system quickly and effectively, the collection of PDF manuals and tips are provided in my first comment of this product. For who cannot access Google Drive, please find these resources in the thread or PM me. Dashboard The DIBS Method MT5 is an intuitive and handy graphic tool to hel
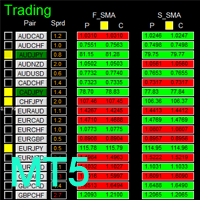
MT4 version: LINK This system basically utilizes two simple moving averages (10 SMA and 197 SMA) over 2 hours before Tokyo Open to generate trading signal mainly on timeframe H1. The signal will be further filtered by 1) M15 and M5 Fractals; 2) Stochastic To facilitate you to understand and trade this system quickly and effectively, the collection of PDF manuals and tips are provided in my first comment of this product. For who cannot access Google Drive, please find these resources in the threa
The new version of MirrorSoftware 2021 has been completely rewriten and optimized.
This version requires to be loaded only on a single chart because it can detect all actions on every symbol and not only the actions of symbol where it is loaded.
Even the graphics and the configuration mode have been completely redesigned. The MirrorSoftware is composed of two components (all components are required to work): MirrorController (free indicator): This component must be loaded into the MAST

"Just copier" is designed to copy trading without any complicated settings. The copy can be done in one PC. One EA can be set as master (provider) or slave (receiver). The receiver lot can be set to multiple providers lots. Please also check this product at fxina.hostingerapp.com. Any type of copy is available. MT4 -> MT5 MT4 -> MT4 MT5 -> MT5 MT5 -> MT4 If you want to copy MT4 -> MT5 or MT5 -> MT4, please purchase "Just copier" for MT4 and "Just copier" for MT5 separately. Just Copier can copy

This simple visual expert advisor allows you to trade easily from the chart. It handles risk management for you and can perform several useful tasks with your existing trades, saving time and making risk-management for each individual trade easier. [ Installation Guide | Update Guide | Troubleshooting | FAQ | All Products ] Trade easily from the chart Trade with precise risk management, hassle free Trade pending order with drag and drop price selection Set SL and TP levels with drag and drop pr
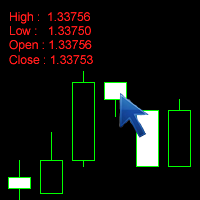
The Click Info is a simple utility for the MetaTrader 5 terminal that allows the trader to quickly receive information about the High, Low, Open, Close, Time values of the current chart. In order to receive information about a bar, it is necessary to left-click the selected candle. Depending on the settings, either a pop-up Alert or a Comment with the information appears. Information on the bar values (High, Low, Open, Close, Time) can be extremely useful in practice of trading using graphical a

The Basket expert advisor can open up to 10 trades at once. It was developed for basket traders who need to open a lot of trades on many different pairs. Expert advisor allows to set a take profit and stop loss as a value in money for each basket trade. This EA is also equipped with hedge functions and allows traders to use the Classic hedge strategy or Sure-Fire strategy, also known as "Always in profit".
Main features Opening multiple trades simultaneously EA Works on any market (forex,

Introduction to Order Risk Panel Pro EA Order Risk Panel Pro EA is the professional version of the simple Order Risk Management EA. Order Risk Panel Pro EA incorporate three powerful features in one. The three powerful features include the visual trading & Risk Management, the Harmonic Volatility Line indicator and Trade Statistics Panel. For all these three features, you get the price of one. Firstly, Order Risk Panel Pro provides the highly efficient visual trading feature. You do not have to
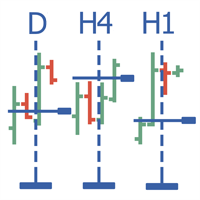
Multitimeframe navigation and research tool (XY expert advisor) is a convenient tool that allows analyzing the trading instruments on different time frames and fast switching between them. Easy to use. It has no adjustable parameters. Charts with an XY Expert Advisor can be either the same symbol (instrument) or different (from version 2.0). When a symbol is changed on one of the charts with the XY expert advisor , cascade change of symbols occurs on other charts with the XY attached. The X

The EA performs trade operations of closing position groups. Positions are grouped by type. It is possible to select orders by the profit (loss) value. It is possible to form the closure groups manually. You can set a value for automatic closure of a positions group after reaching a certain profit/loss level or price level. The additional functions of the EA are called using the hot keys: SHIFT+A - show/hide Auto exit options. SHIFT+S - show/hide Settings panel. SHIFT+V - sound ON/OFF. SHIFT+I -

The utility allows you to build different types of graphs: Seconds chart from 1 second to 86400 seconds Tick chart from 1 tick and above The volume chart Delta chart Renko chart Range chart Demo version of the utility https://www.mql5.com/ru/channels/clustersecond Built-in indicators for volumetric analysis: daily market profile and market profile of the selected timeframe, Cluster Search Imbalance VWAP Dynamic POC, VAH, VAL the profile depth of the market vertical volume with various display op

You can change all assets to your Market or Forex. Just replace the assets in the groups above! No asset limits! TradeLeader B3/Bovespa Scanner is an indicator that allows you to observe the entire market heat map in a single chart. More images in high definition in https://www.mql5.com/pt/users/ougaske/blog Track all the assets of the stock market separated by liquidity groups. Customize the alert level for opportunities. Display in real time the Ibovespa, minicontracts of Index and Dollar or
Use this script to export the price history to MATLAB mat files from any chart. Optionally, a CSV file can be created. This script allows easily creating and verifying your trading strategy in MATLAB, for example, statistical arbitrage or pairs trading strategies.
Input parameters startDT: start export from this date and time. Can be '1970.01.01 00:00:00' to start from the first available date and time. endDT: the last date and time in the file. Can be '1970.01.01 00:00:00' to export until the
Object Synchronizer MT5 : Better focus/analysis of the price chart in many timeframes. Are you bored to save and load template many times for the same symbol for many chart timeframes? Here is the alternative. With this indicator, you enjoy creating objects across many charts, you can modify the same object in any chart, you can delete the same object in any chart. All objects you created/modified are always synchronized across all chart windows (with the same symbol). Save your time, you can fo
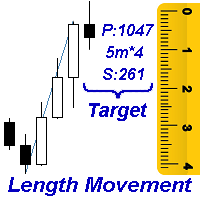
Measures the length of the selected movement in points, shows the duration of the movement, as well as the speed of movement. Outputs the average value of each dimension.
It is designed to calculate the expected target based on typical market movements.
The intended goal will provide information about the ratio of the stop size to the possible profit and will allow you not to open positions with a small expected profit.
It will also help you determine the point at which it is more logical t

지표의 형태로 만들어진 VR 경고 유틸리티는 특정 수준에 도달하는 가격이나 지표에 대해 상인에게 알리기 위해 가격 또는 기타 지표를 모니터링하도록 설계되었습니다. 신호 레벨은 수평뿐만 아니라 비스듬하게 설정할 수 있다. 따라서 거래자는 금융 분야에서 최신 도구를 얻을 수 있는 새로운 기회와 기회를 얻는다. 가상현실 알림 유틸리티 덕분에 더 이상 모니터 근처에 오래 앉아 있을 필요가 없다. 당신은 안전하게 당신의 가정 집안일에 대해 갈 수 있습니다, 작업 의무를 수행, 가족과 함께 시간을 보내고. 당신의 임무는 단순히 레벨을 설정하고 정보의 네 가지 방법 중 하나를 선택하는 것이다. 유틸리티는 스마트폰, 이메일로 알림을 보내고 표준 알림 창과 소리를 표시하며 그래프를 빨간색으로 칠할 수 있다. 유틸리티의 모든 제어는 차트의 마우스로 수행된다. 출시 당시 유틸리티는 차트에서 다른 지표에 대해 검사합니다. VR 경고의 감독하에 차트에 표시되는 부분이 있는 지표입니다.
추적할 수 있는 모
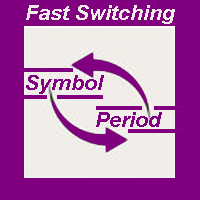
The indicator allows you to quickly switch from one instrument to another, from one time period to another using the keyboard or buttons on the monitor. Each command can be assigned a hot key from 0-9, a-Z (case-insensitive) and VK_OEM_COMMA ("<" on the keyboard) and VK_OEM_PERIOD (">" on the keyboard). This can help you to operate the maximum number of instruments that are available at your broker, analyze more instruments/periods in less time. This product cannot be tested in the tester , beca

This indicator allows you to measure the profitability of each specific transaction (the ratio of Stop and Profit). The indicator allows you to adjust the ratio by step size and number of steps. You can build an unlimited number of ratios to compare the risks from different movements.
Note: the MT5 tester is not designed for full-fledged work with graphic objects, so drawing in the tester is slower than in the real situation. The ratio selection is performed with 1 mouse click.
Building a li

The script displays info about the share's corporate reports and dividends. The data is downloaded from investing.com : Report date Profit per share (EPS) Revenue Market capitalization Amount of dividends Date of payment of dividends Dividend income The product cannot be tested in the tester (since it is not possible to receive data from the Internet).
Before launching: Add 2 URL https://ru.investing.com/earnings-calendar/Service/getCalendarFilteredData and https://ru.investing.com/

This is a risk management tool for your account. It shows the drawdown information on the chart. You can change the size and color of the text on the chart. You can install it on many charts at the same time. Please contact me if you have any problems with it and you can request some other essential features. Version for МТ4: https://www.mql5.com/en/market/product/23255
Parameters Size - Size font. Color - Color char.
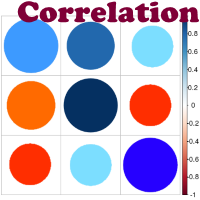
Advantage The analyzer provides an opportunity to examine correlation in history, for example, for the previous month excluding the current one, thus allowing you to evaluate symbol movement in history. It can be conveniently used in conjunction with the LineSyncMirrorCharts analyzer. Charts are synchronized by a market type: Forex, CFD, Futures, and Indices. The analyzer calculates the distance covered by the price on a specified period in points. The tool fits pairs and portfolio traders.
De

Telegram Publisher Agent는 거래자가 Telegram 채널 및 그룹에 실시간으로 신호를 보낼 수 있는 추가 기능입니다. 사용자 정의 가능한 메시지, 차트 스크린샷 및 기타 기능을 통해 이 도구는 트레이더가 트레이딩 통찰력과 전략을 팔로워와 공유할 수 있도록 도와줍니다. 이 도구는 또한 밝고 어두운 테마 스위치가 있는 아름다운 디자인을 특징으로 하여 사용자에게 미적 및 기능적인 거래 경험을 제공합니다. Telegram 게시자 에이전트는 모든 거래를 채널 및 그룹의 신호로 게시하도록 설계되었습니다. 거래를 제공하기만 하면 Telegram 게시자 에이전트가 버튼 클릭 한 번으로 거래 채널이나 그룹에 거래 신호를 보내는 모든 어려운 작업을 수행합니다. 텔레그램 게시자 에이전트 설치 및 입력 가이드 EA 추가 URL( http://autofxhub.com ) MT4/MT5 터미널(스크린샷 참조) 에 대한 알림을 받으려면 . MT4 버전 htt
감시. 이 조언은 계좌 헤징에만 사용됩니다. 메타트레이더 4 버전 Quick Panel Pro
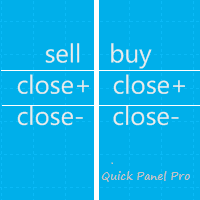
형질 일괄 계산은 빠르고 쉽습니다. 정지선을 이동하면 즉시 계산이 이루어집니다. 대부분의 비즈니스 거래는 이 패널을 클릭하는 것만으로 빠르게 완료할 수 있습니다. 녹색 버튼을 클릭하기만 하면 패널 간을 빠르게 전환할 수 있습니다. 마우스 클릭만으로 손절매 변경 및 이익 실현(백테스팅 불가) 노란색 배경의 상자에 평균 가격을 표시하고 평균 가격에 대한 선을 그립니다. 여기를 클릭하세요 제어판 대시보드는 두 개의 열로 구성됩니다. 왼쪽 칸은 매도용, 오른쪽 칸은 매수용입니다. 판매: 판매 주문을 엽니다. 첫째: 첫 번째 매도 주문을 마감합니다. 첫 번째는 영업시간에 관한 것입니다. 마지막으로: 마지막 판매 주문을 마감합니다. 마지막으로 고려해야 할 것은 영업시간이다. all+: 이익이 있는 포지션을 청산하기 위한 매도 주문입니다. all-: 손실이 발생한 매도 주문을
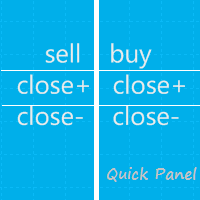
참고: 이 EA는 위험 회피 계좌에서만 작동합니다. 메타 트레이더 4 버전 퀵 패널 이 패널은 여섯 그룹의 거래 패널을 제공하는 전문가 고문입니다.
특징 대부분의 거래 작업은 이러한 패널의 버튼을 클릭하여 신속하게 수행할 수 있습니다. 패널 간의 전환은 녹색 버튼을 클릭하는 것만으로 쉽게 할 수 있습니다. EA는 전략 테스터의 시각적 차트에서 실행할 수 있으며 기록 데이터를 사용하여 거래를 연습하는 간단한 방법을 제공합니다. 마우스를 클릭하여 정지 손실 및 테이크 프로핏을 빠르게 변경합니다(백 테스트에는 사용할 수 없음) 배경은 노란색 패널에 평균 가격을 표시하고 평균 가격 선을 그립니다. 여기를 클릭
패널 대시보드에는 두 개의 열이 포함되어 있습니다. 왼쪽 열은 판매에 관한 것이고 오른쪽 열은 구매에 관한 것입니다. sell: 판매 주문을 엽니다. first: 첫 번째 판매 주문을 닫습니다. 첫 번째는 영업 시간에 관한 것입니다.
MetaTrader 마켓은 개발자들이 거래 애플리케이션을 판매할 수 있는 간단하고 편리한 사이트이다.
제품을 게시하고 마켓용 제품 설명을 어떻게 준비하는가를 설명하는 데 도움이 됩니다. 마켓의 모든 애플리케이션은 암호화로 보호되며 구매자의 컴퓨터에서만 실행할 수 있습니다. 불법 복제는 불가능합니다.
트레이딩 기회를 놓치고 있어요:
- 무료 트레이딩 앱
- 복사용 8,000 이상의 시그널
- 금융 시장 개척을 위한 경제 뉴스
등록
로그인
계정이 없으시면, 가입하십시오
MQL5.com 웹사이트에 로그인을 하기 위해 쿠키를 허용하십시오.
브라우저에서 필요한 설정을 활성화하시지 않으면, 로그인할 수 없습니다.