작업 종료됨
명시
Hello,
I need you to create an EA from stochastic indicator and Bollinger Bands. Two trade scenarios:
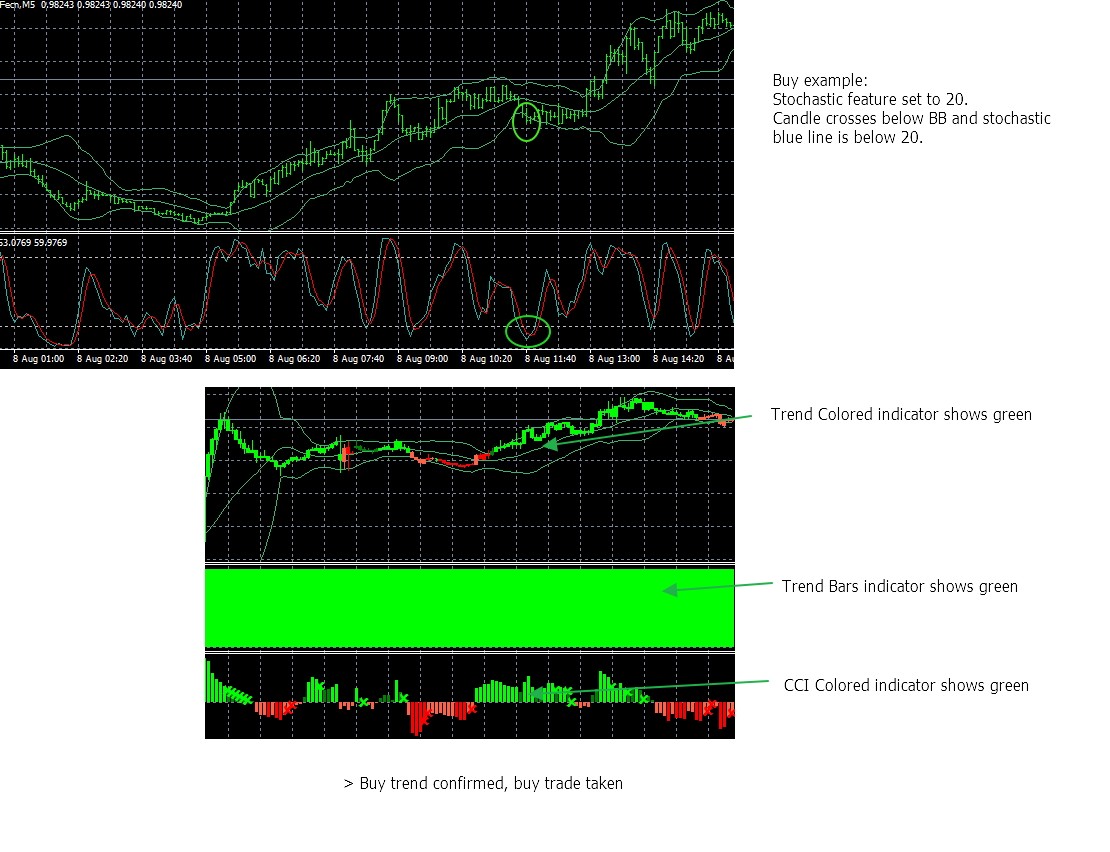
1) Buy trades, when candle touches or crosses below the lower line of Bollinger Band and at the same time stochastic blue line is below value X, time frame current or choose timeframe.
Sell trades, when candle touches or crosses above the upper line of Bollinger Band and at the same time stochastic blue line is above value Y, time frame current or choose timeframe.
See screenshot example for a buy trade, sell trades are the opposite.
Scenario 2:
2) Buy trades: Candle is below the middle line of Bollinger Band, stochastic blue line moves below value X.
Sell trades: Candle is above the middle line of Bollinger Band, stochastic blue line moves above value Y.
Also the trades in both cases must be confirmed by the trend indicators Trend Bars and/or CCI Colored Copy 03 and/or Trend Colored Copy 02 in a higher timeframe(see attachments).
Buy trades only if they are green, sell trades only if they show red. (There are three green colors and three red colors for CCI and several red and several green for Trend Colored indicator. All those apply for the trend verification)
For each of them I need timeframe feature and true/false, so they can confirm the trades from the higher timeframes and I can switch this feature on and off for either each of them seperatedly.
Lastly I need lot size, trade times, stop loss, take profit, trailing stop, number of trades per candle and number of max trades at the same time.
Thank you for applying.