명시
Good day all coders
I'm reaching out to anyone kindly willing to help me on this project. I just need the code modified of any of the attached indicators to the following specs. I feel it could be a very powerful trading tool for binary options
The attached indicators work by printing a signal upon crossing of adx lines. Basically the main goal is adding an option such as print a signal(up or down arrow) on the chart with other option of varying sensitivities along with the period input.
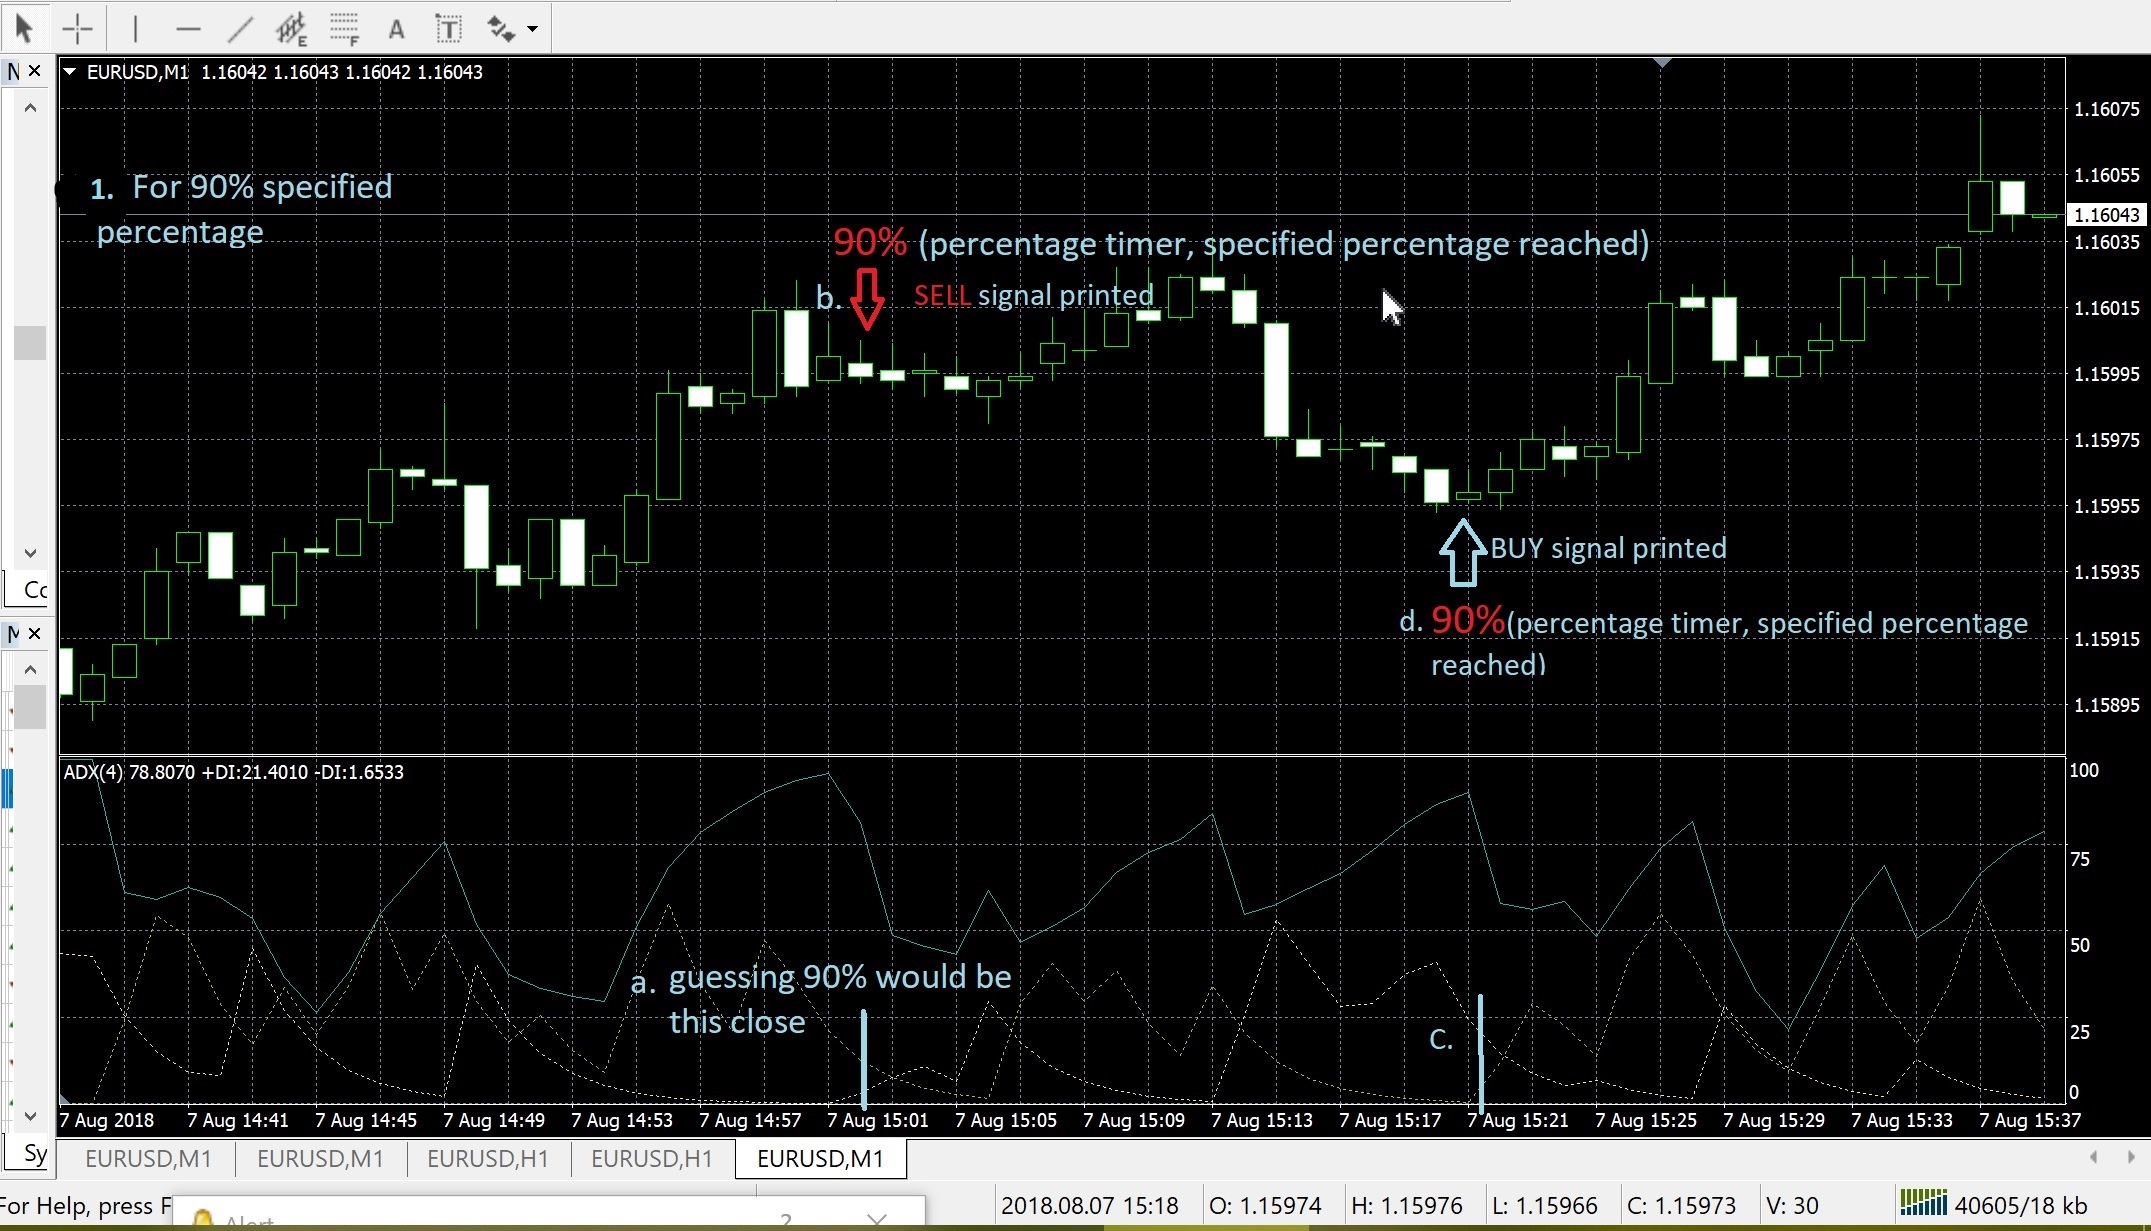
1) Once the indicator is attached on the chart, it just seems like the signal appears on the break of the high or low of the previous candle. So here just add an option at a specified period input percentage to print an arrow. Like at either 90%/ 80%/ 88% /93% at whatever specified period input before the lines almost cross. Just whatever percentage specified in a parameter of the period input.
This can be achieved by simply getting the signal when the 2 adx lines come close to each other by less than value of X.
So essentially we use certain values of X, X being the point of a touch/cross, at variances of the value of X.XXX(up to 3 decimal points) to determine the probability of a cross/touch if the specified percentage is less than 100% of the specified period input
<shown on 1st attached chart>
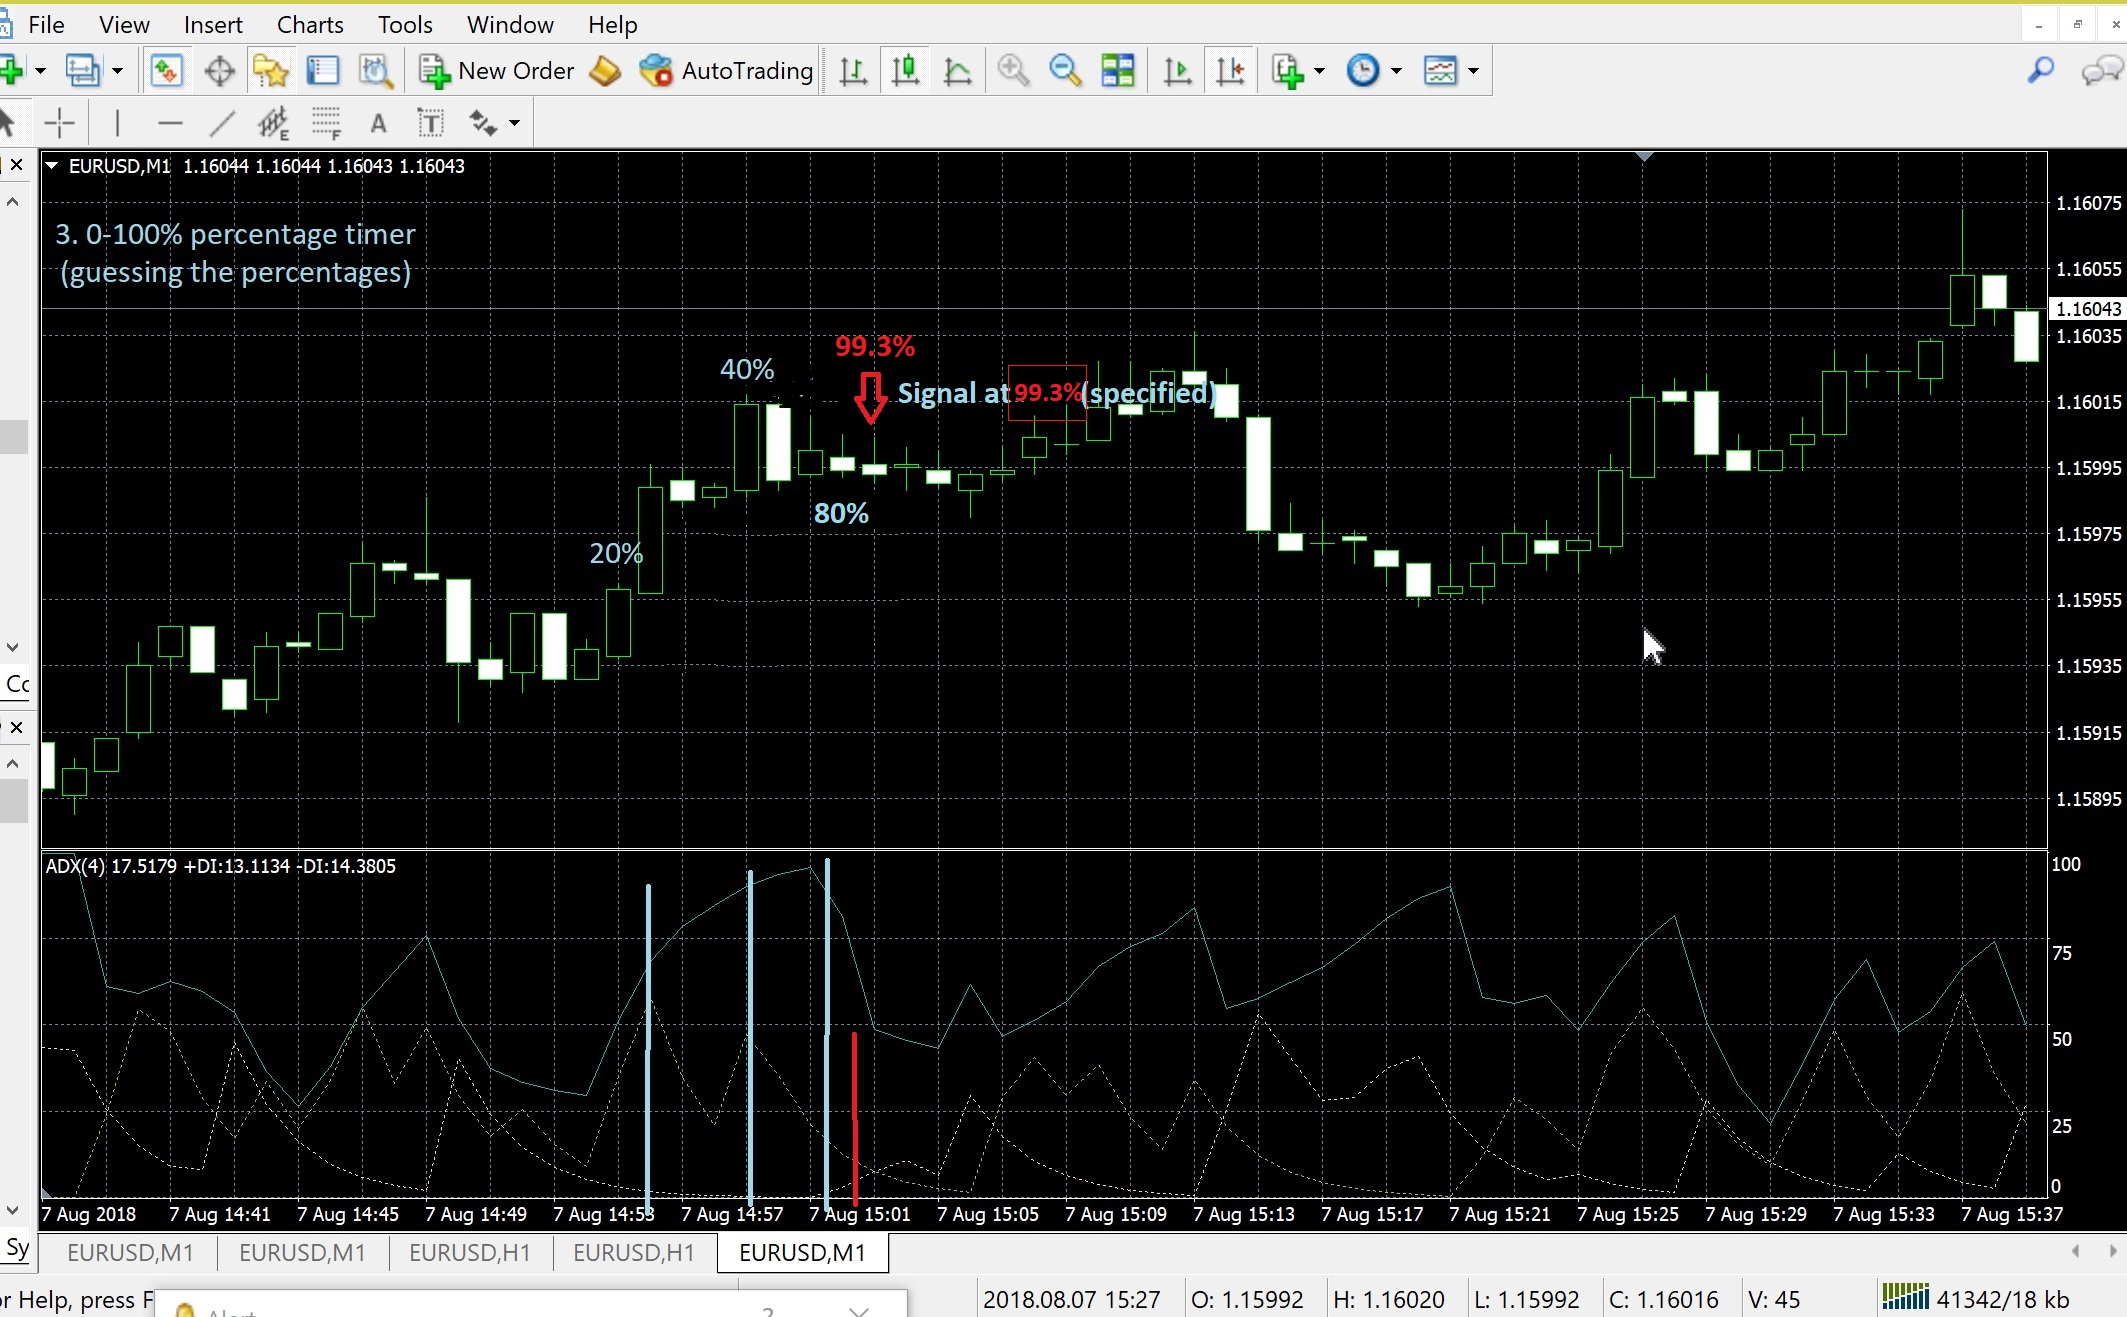
2) And a timer for specified percentages stating how close the specified percentage is to being complete and alerting the user to when thy can expect the signal. The timer can oscillate back forth, increasing or decreasing in value as the lines come closer to crossing or moving away. it just remains on the chart. And it can match the value of specified x.xxx. Example at period input of 14, specified value of x=99.3% so when the lines come 99.3% (of period input 14) close to cross/touch timer turns red and prints a signal, or it can just back away and not print a signal and timer percentage value decreases as the lines spread out because specified value of 99.3% was not reached
<shown on 2nd attached chart>
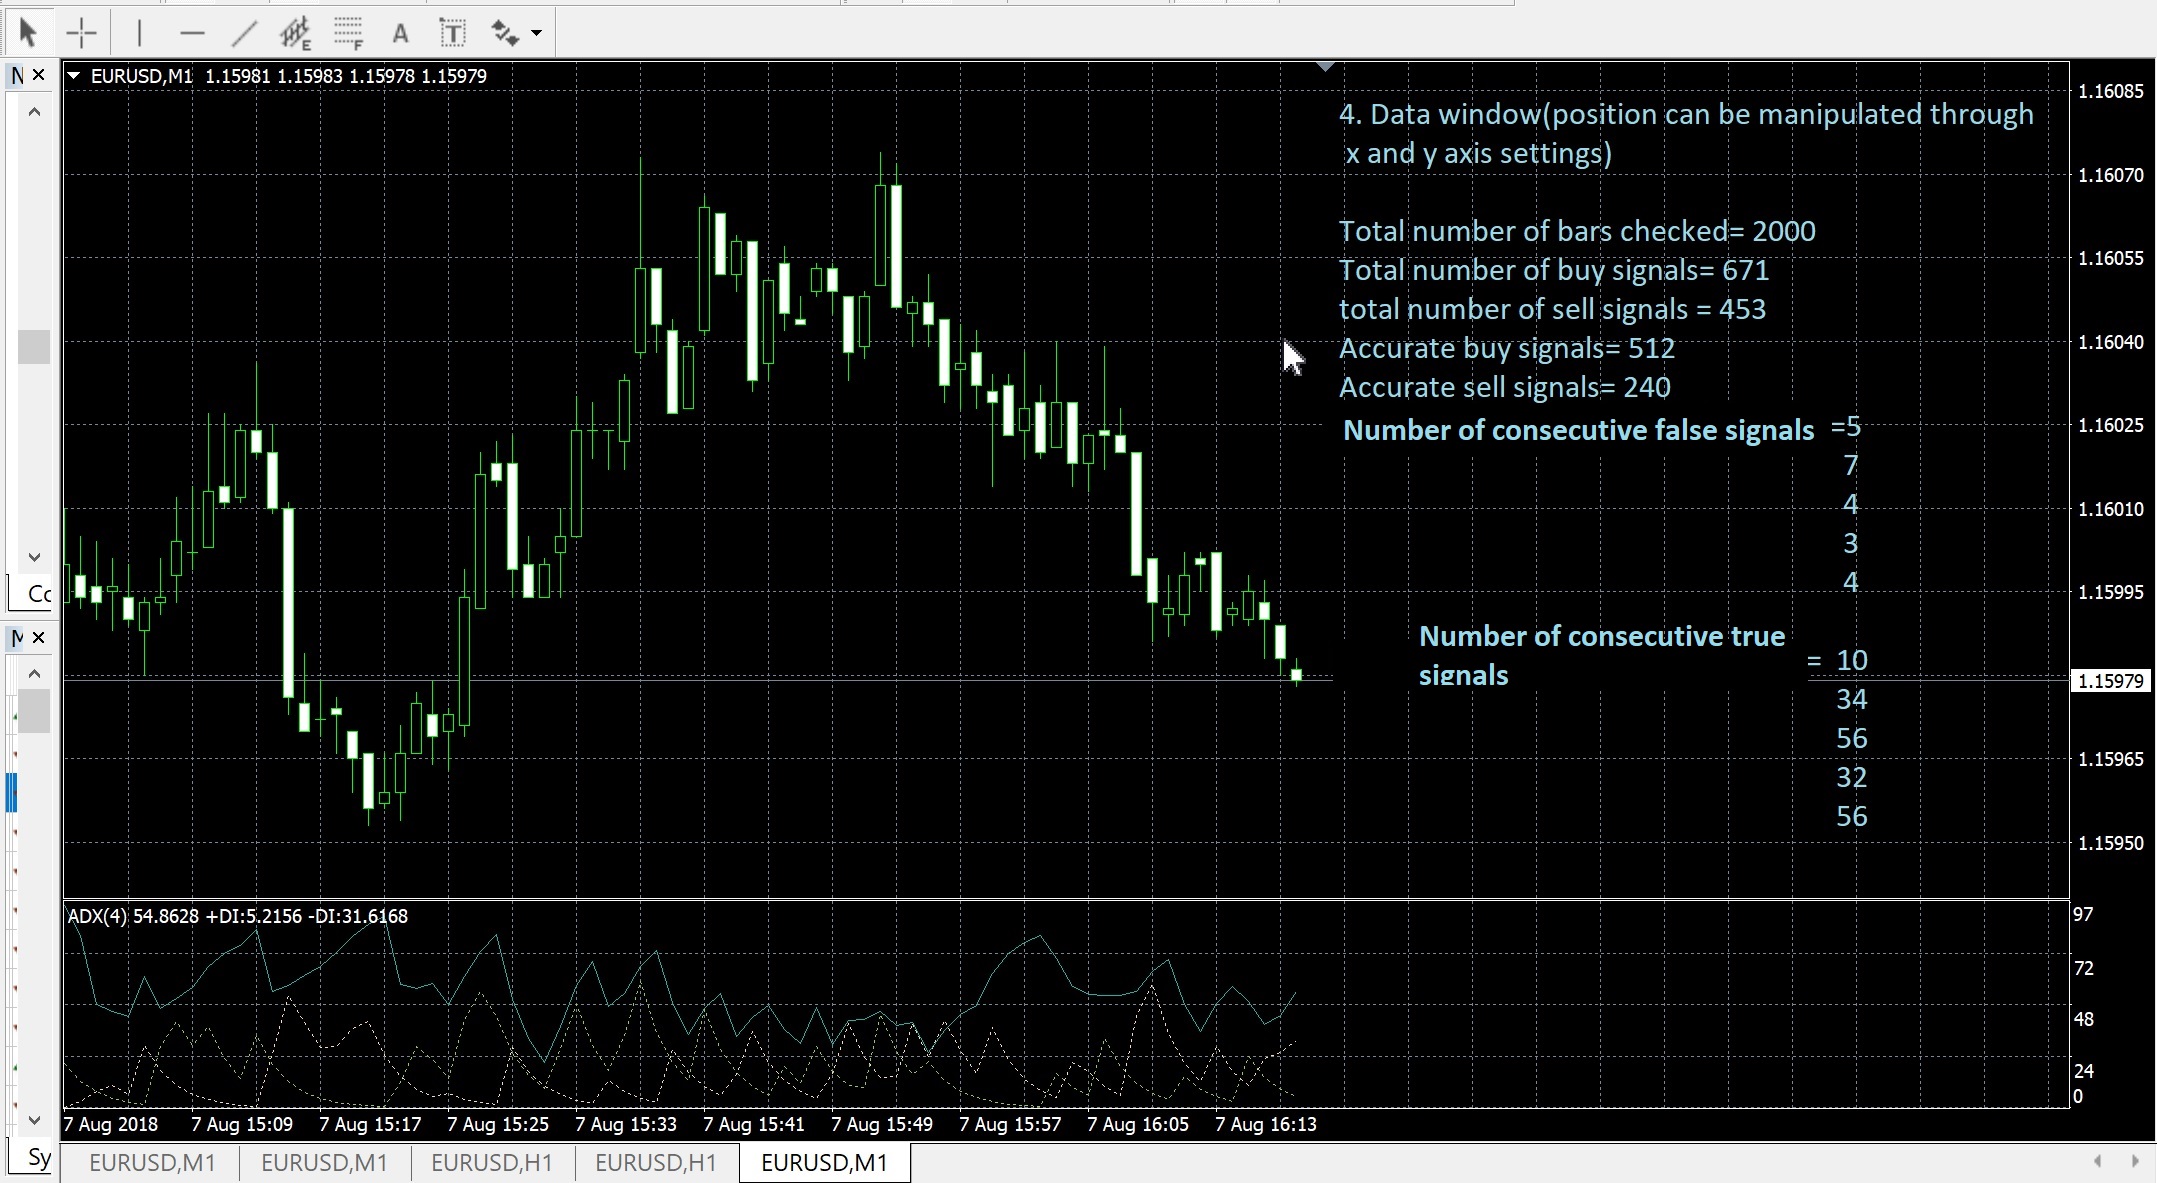
3) A collaborated data window also will be a huge help in saving hundreds of hours of manual back testing.
For the data window, to determine all the specified values(as show in the chart), the indicator can check the high/low of the bar the signal was printed on<preferably the same bar :)> in relation to the bar before it to determine whether it was on a bull bar or bear bar and if it was correspondingly a bad or good signal.
<shown in 3rd attached chart>
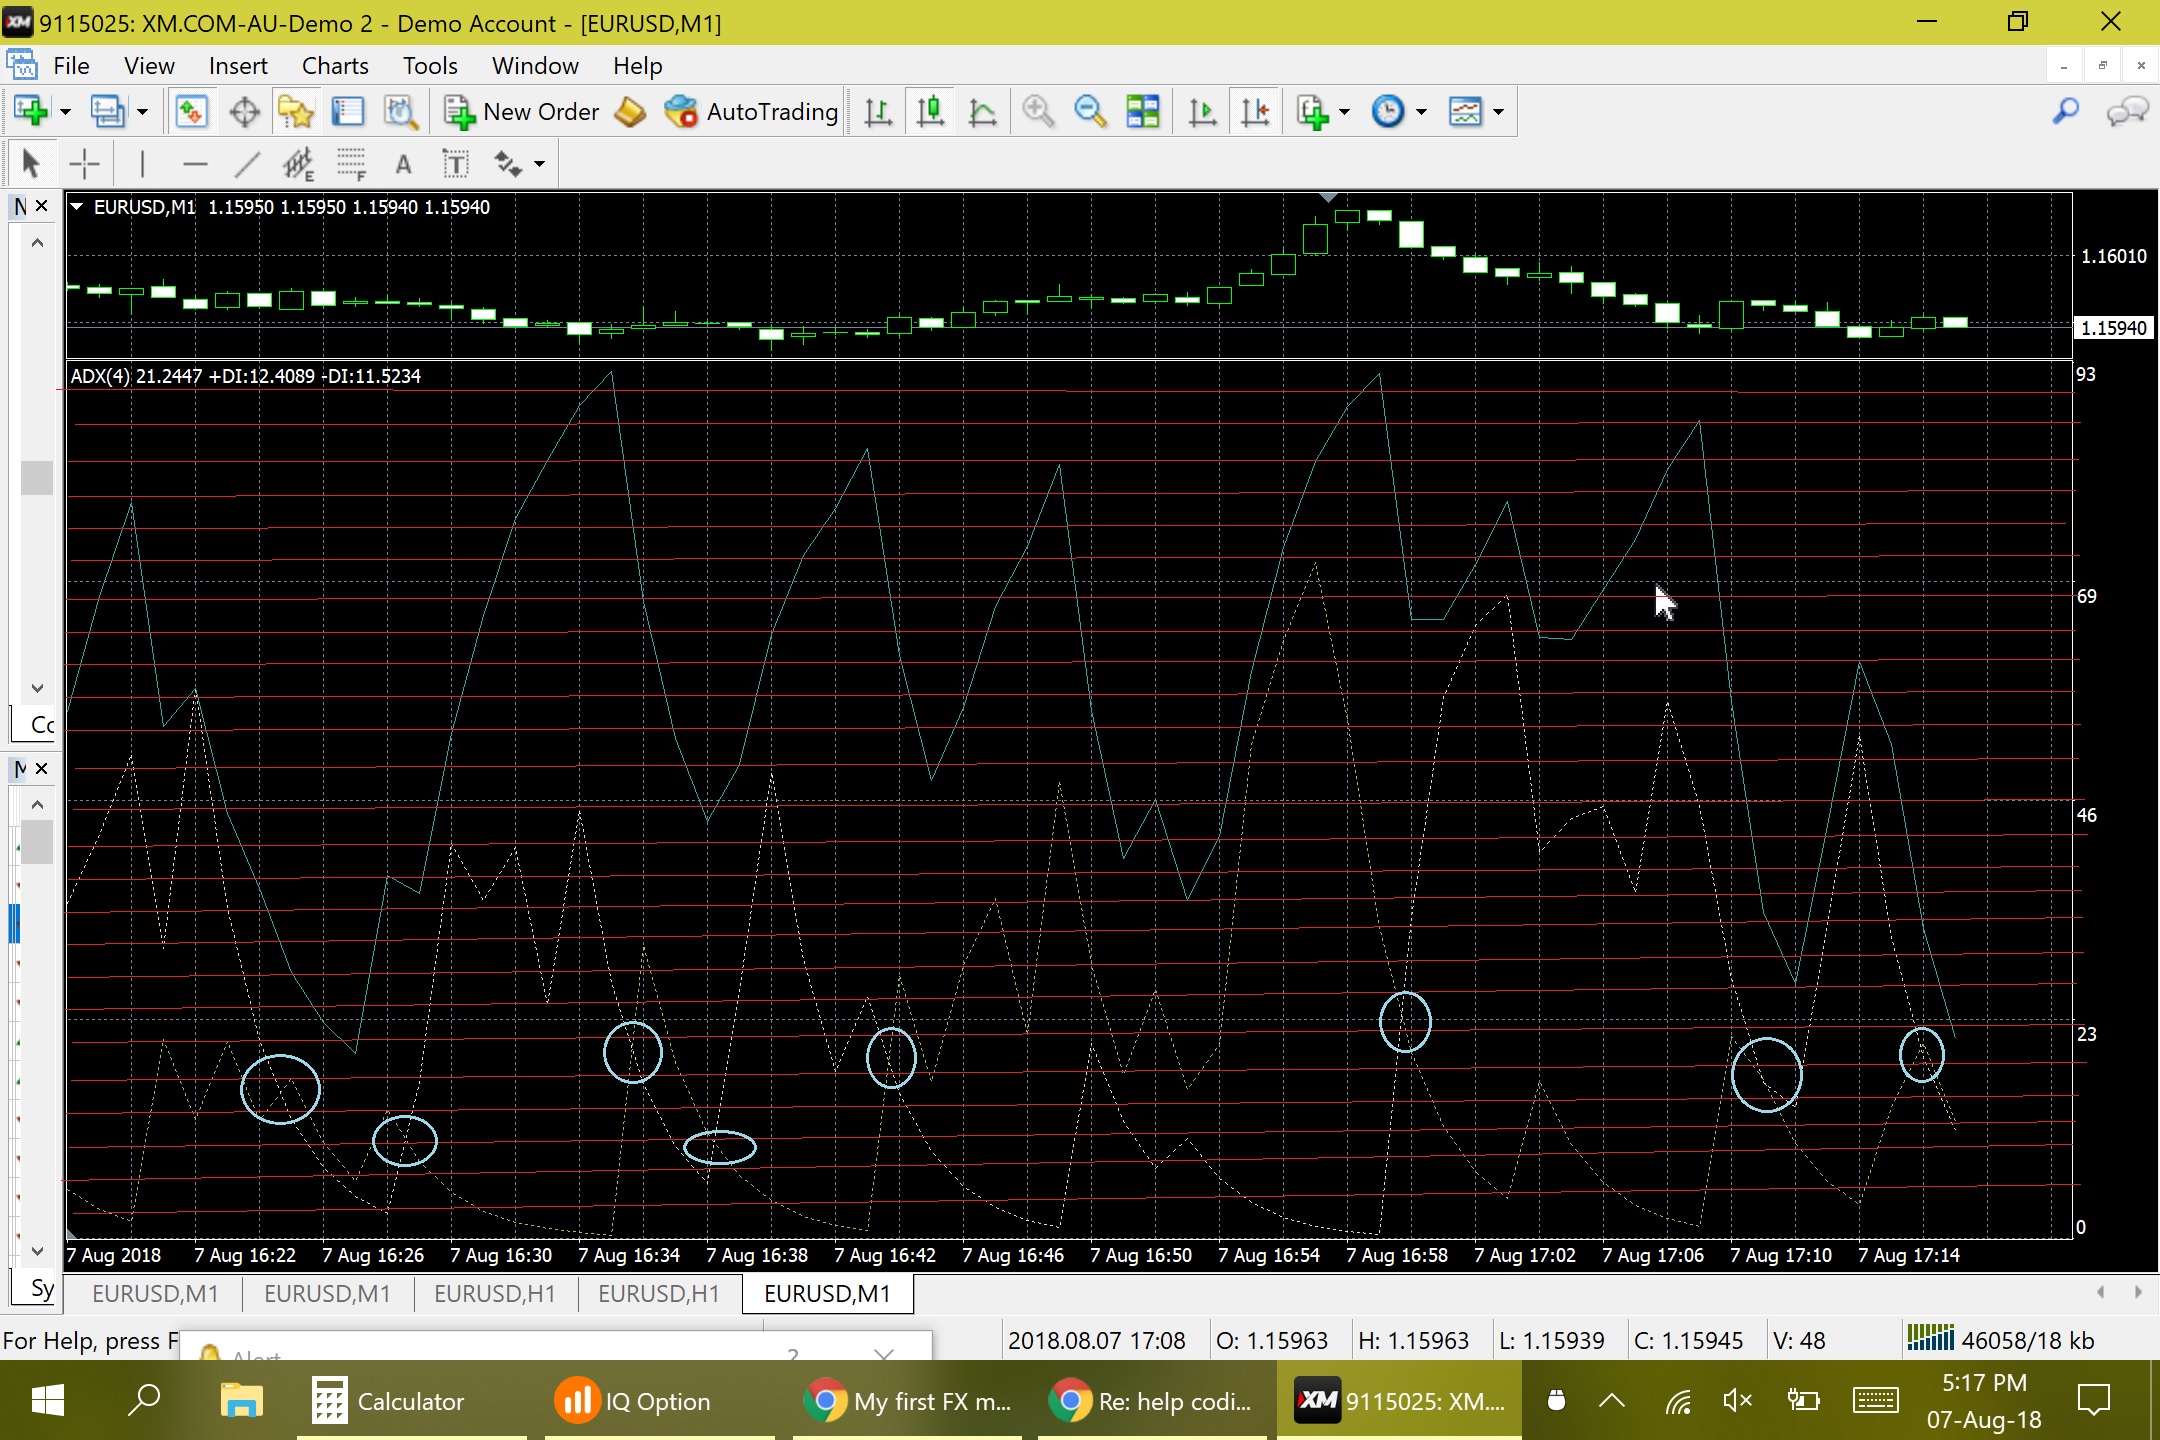
4) And what are the chances of the indicator being able to determine the probability of a true signal based on either how fast or slow the distance between the lines reached to a point of cross, and the position of them relative to each other? To increase those chances, Something like micro levels, up to 3 decimal points as well, and the probability of a true signal determined on where the lines are based on each micro-level. So the probability of the lines crossing when they enter between two levels is quite high. The micro-levels can come into play as a filter(option to turn filter on/off) to determine the position of the lines if too narrow, parallel, upward sloping, downward sloping and all that. For the filter am thinking may be the position of the lines themselves in correlation to each other too. If they're are too deviated before a touch= high chances of a bad signal, or if they were 50-60% between 2 micro-levels more than the previous levels at the specified percentage value of X= higher chances of a true signal
If the filter cannot function that way then it can be scrapped
<shown in 4th attached chart>
5) Add a message and sound notification if the chosen indicator doesn't have that function already
And to make sure in any case the indicator DOES NOT REPAINT, RETRACE OR THE SIGNAL DISAPPEAR if the platform is restarted. That is an integral part of this project. If the indicator fails to do either of these functions like it retraces or repaints then the data window is absolutely useless. It should function the same when it is loaded on to a chart on any time frame so manual back testing will be easier and accurate and I dont have to wait to let it run for hours after loading it onto a chart to collect the data
And i will need support for no more than a month. It should be sufficient enough time to work out any bugs or have any changes made if required. If extra payment is required that can be worked out as well
I would greatly appreciate anyone's help on this. Thank you