명시
I need someone who can code this wave and co. for me. I can try to answer any questions you might have but don't expect a much detailed answer as i don't properly understand it yet, but you'll find the description below.
description:
Natural Law dictates that energy dissipates according to fairly regular intervals. We breath in we breathe out . . . we can only hold our breath for so long. Everything vibrates and all vibration is characterized by the rise and fall of a wave form.
Any object vibrating will produce a wave as a function of time. That is to say, all vibration produces a wave form . . . momentum up . . . momentum down. Price vibration in the market produces a consistent wave with a wavelength (period) of 26
While it could be argued by some that the wavelength of market vibration is 27, this is actually a moot point since in real-world application the wave ranges on average from slightly less than 26 to slightly more than 26. The pertinent point is that no matter how you formulate the underlying wave generated by price vibration . . . the wavelength comes out to be 26. Consequently, this simple fact will serve to reveal the Phi structure so ubiquitous in vibration. In practice one will observe that while the wave form of price vibration is pretty consistent in its length of 26, what is of interest is that wave divergences from 26 will predominantly fall in the 270* to 360* quadrant of the “Square of 9“. Specifically in the 180* (or 2nd) wrap as shown below.
So price vibration over time yields a price/time ‘momentum’ wave. The discriminating factors are:
(1) Price Square Range
(2) Price Square Factor
-----------------------------
‘Price Square Range‘_Range of price bar (in ticks) squared. Example: range of price bar = 10 ticks, square = 100 ‘Price Square Factor‘_Range in degrees above/below the price square range of the chart. Example: Range of hart = 10, 270* above is 13. (Note: 270* = a square root factor of 3 and is a key component in vibrational analysis)
-----------------------------
Using a ‘Square of 9′ formulation and applying ‘price square factors’ of +/- 90 to 360* produces consistent cycle duration (wavelength) of 26 bars. Certainly it is non-linear, which is beautiful, but on average . . . 26 bars.
------------------------------
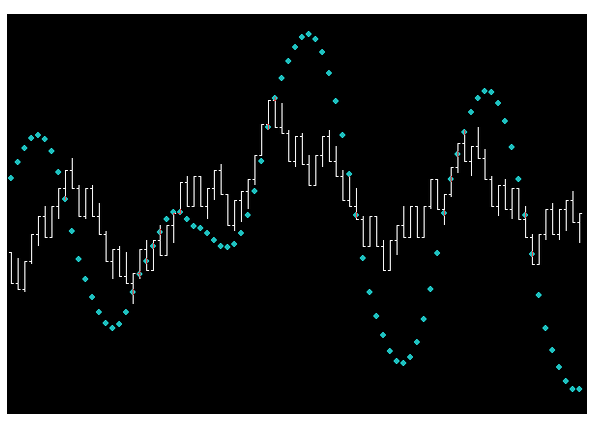
Every component of vibration has it’s opposite . . . the above and the below. Wave forms produce opposing forces. The duality of positive and negative forces manifest in the damping waves which trail the primary vibrational momentum wave up and down.
While any damping factor can be applied, The friction zone pictured above and below is the .9, .707, .666, .618, .583, and .5 friction points of the .5 damping wave.
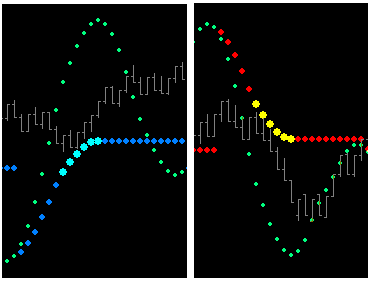
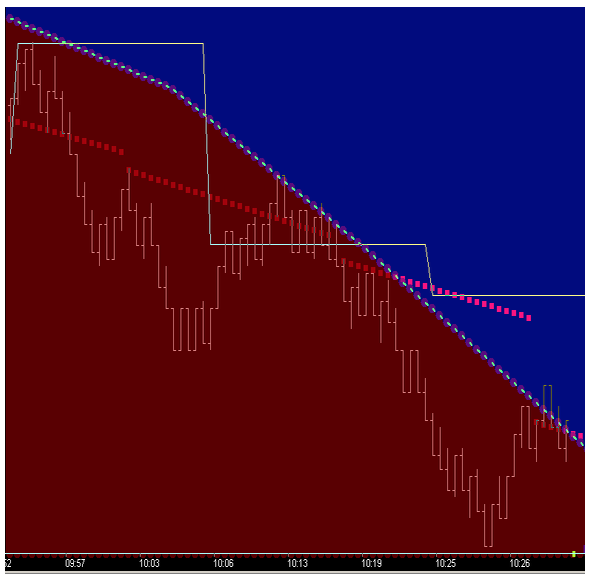
Momentum up or down is slowed by price penetrating the wave leg. When this occurs a ‘Friction’ is generated whose run-rate (Price/Time) is a derivative of momentum going into this friction point. Momentum slowing enough to turn the wave is the next significant event. which is momentum turning. When this happens the ‘Friction Vector’ generated when momentum slowed is revealed. Below you can see 2 friction vectors where price found support.
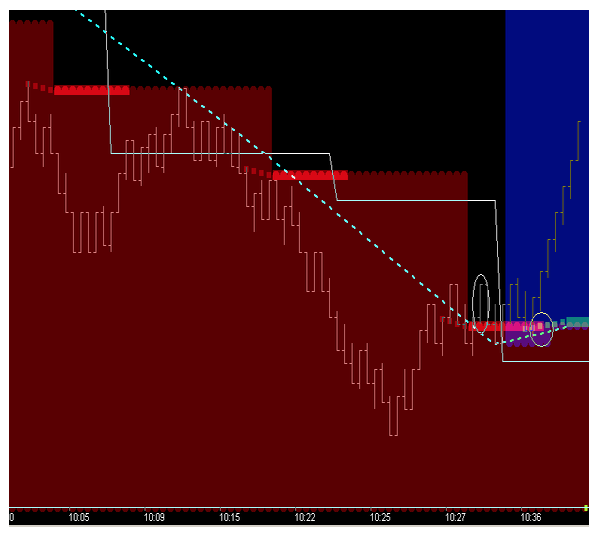
The following pic includes the cycle from the pic above and the tool being used here has been adjusted to show the Fence Vector ending at the mid-cycle 13 count (ie 26/2), the .5 timing point of the wave, trough to crest.
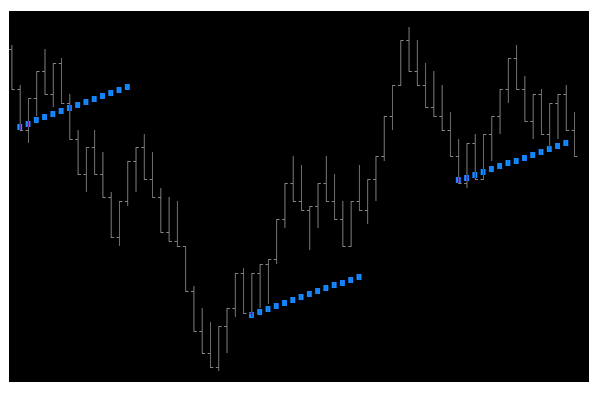
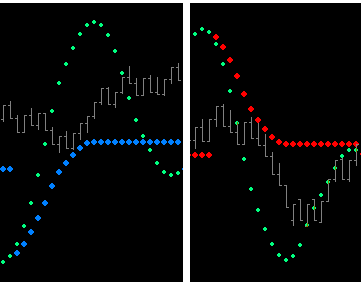
Shown above directional Bias is negative because price is below the Time Fence 13 Vector (cyan) and consequently (because of filtering) only the crest friction Vectors show. With directional Bias [-], any movement above friction Vector is a retracement to the fence.
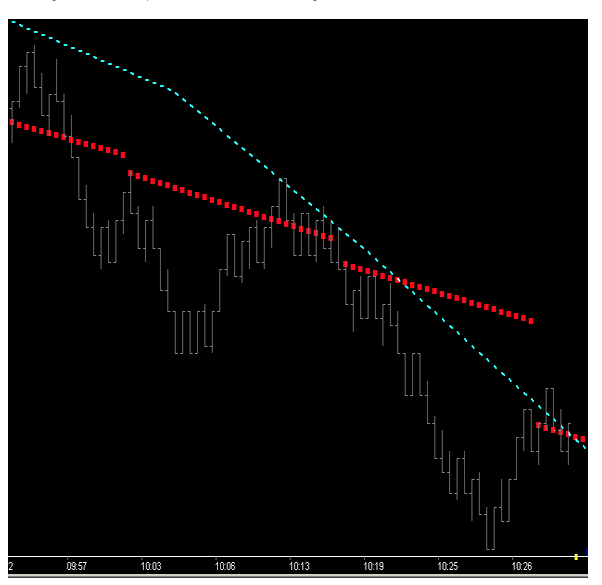
The horizontal line pictured below (from the same cycle as in the pic above) is the .5 friction level of the damping wave.
Now generally the zone coloring isnt set to specifically follow the fence like in the examples above. Usually its ‘squarelike as in the chart shown below.
Below you will see the directional Bias filtering (red color) horizontal out from the Time fence 3 level of the crest friction vector. Also added there is a 2nd colored horizontal that runs out 10 bars from Time Fence3 (i.e. runs to Time Fence13, wave midpoint). Most often a retracement into this time is common. Notice this crest Time Fence 13 action point at ~10:36