작업 종료됨
명시
Hello MQL freelancers, good day.
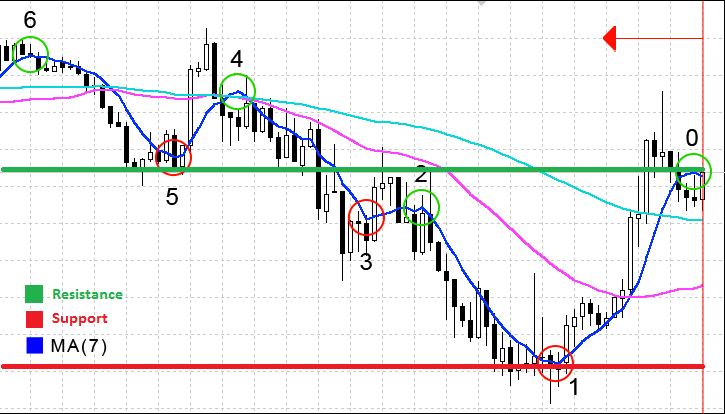
I need an indicator that gets the values of the support/resistance levels from the MA(7) and draws a line at each level (one for the support and another for the resistance) so there is a visual reference of the range. These are the rules for the indicator:
Support:
Get the lowest point of the two previous oscillations/waves of the MA(7) and draw a horizontal line on the lowest level.
Resistance:
Get the highest point of the two previous oscillations/waves of the MA(7) and draw a horizontal line on the highest level.
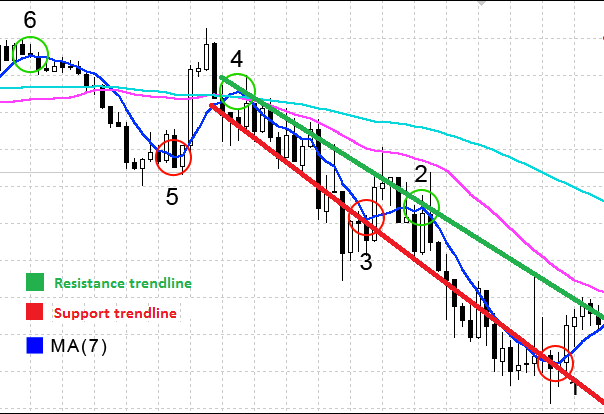
Trend lines:
Determine the trend lines by connecting the highest/lowest points of the previous oscillations/waves of the MA(7) and draw a diagonal line for the support/resistance levels of the trend line.
By oscillation of the MA(7) I mean every time there is a wave of the Moving Average, in other words, every time there is a peak (the highest point in the middle of the wave) or every time there is a valley (the lowest point in the middle of the wave). Taking this into account, the support would be the lowest level of the two previous downward oscillations/waves and the resistance would be the highest level of the two previous upward oscillations/waves. For the trend line range, it is one diagonal line connecting two previous supports and another diagonal line connecting two previous resistances.
For the EA I need to open a Market Order when the price breaks below/above the MA(7) support/resistance levels, close orders/place Stop Loss where Close[1] </> MA(50) and Take Profit when price closes below/above support/resistance trend lines. I'll give the rules for Buying and Selling Orders separately afterwards, but basically this is it.
Best regards and thank you in advance,
Gerardo