명시
Create EA. using my trading strategy.
Name of it is BLUEZXP
First I use the one minute chart
FOR BUY SCENARIO
Identify the last GREEN candle before the downward movement
Then use the Fibonacci tool and measure (from bottom to top including the wick) the last green candle before the downward move.
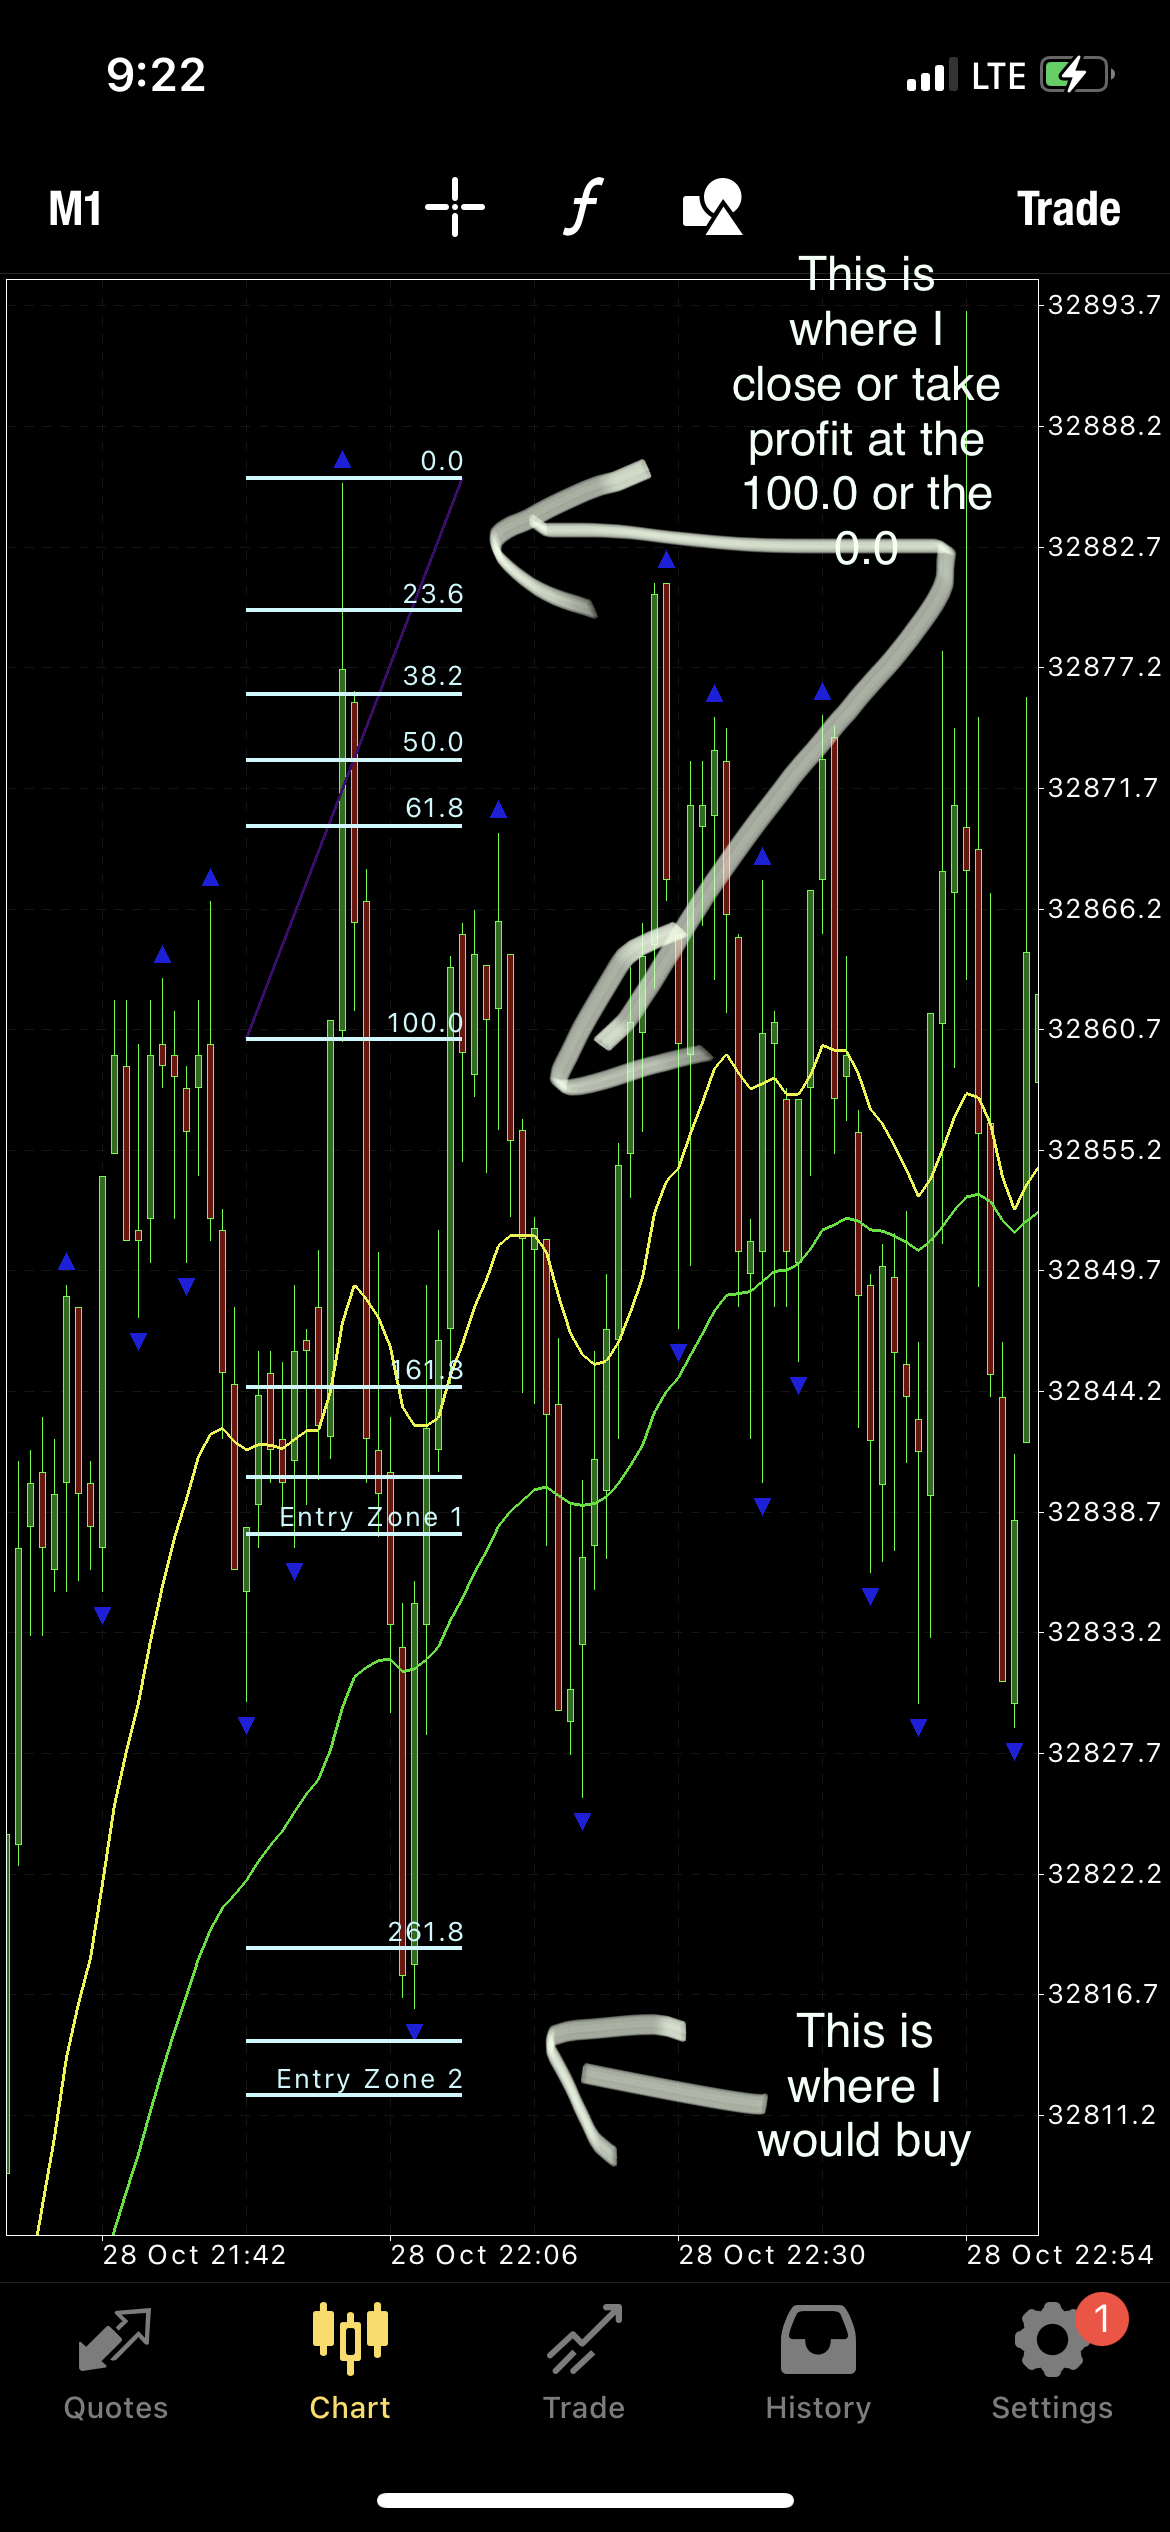
Fibonacci levels 1.618, 2.618 4.236 set buy limit in this case with TP at 100.0 or 0.0 stop loss is 30 pips under last buy limit
FOR SELL SCENARIO
Identify the last RED candle before the UPWARD movement
Then use the Fibonacci tool and measure (from top to bottom including the wick) the last red candle before the upward move.
Fibonacci levels 1.618, 2.618 4.236 set sell limits in this case with TP at 100.0 or 0.0 stop loss is 30 pips under last sell limit
Side note:
The fractals indicator may help identify the highs and lows as well
I’m not proposing we use fractals it was an alternative just in case.
But once the the Fibonacci tool measures the last green candle before the down move, price normally retraces to the areas: 1.618, 2.618 and 4.23. I would like the ea to place buy limits at the price coordinates the Fibonacci has the number 1.618, 2.618 and 4.23 at.
I’m gonna need the Ea to do this continuously because the one minute chart produces trades back to back.
How I define the down move: measure the first bullish candle before the swing low ( for buys ) and measure the first bearish candle before the swing high ( for sells)
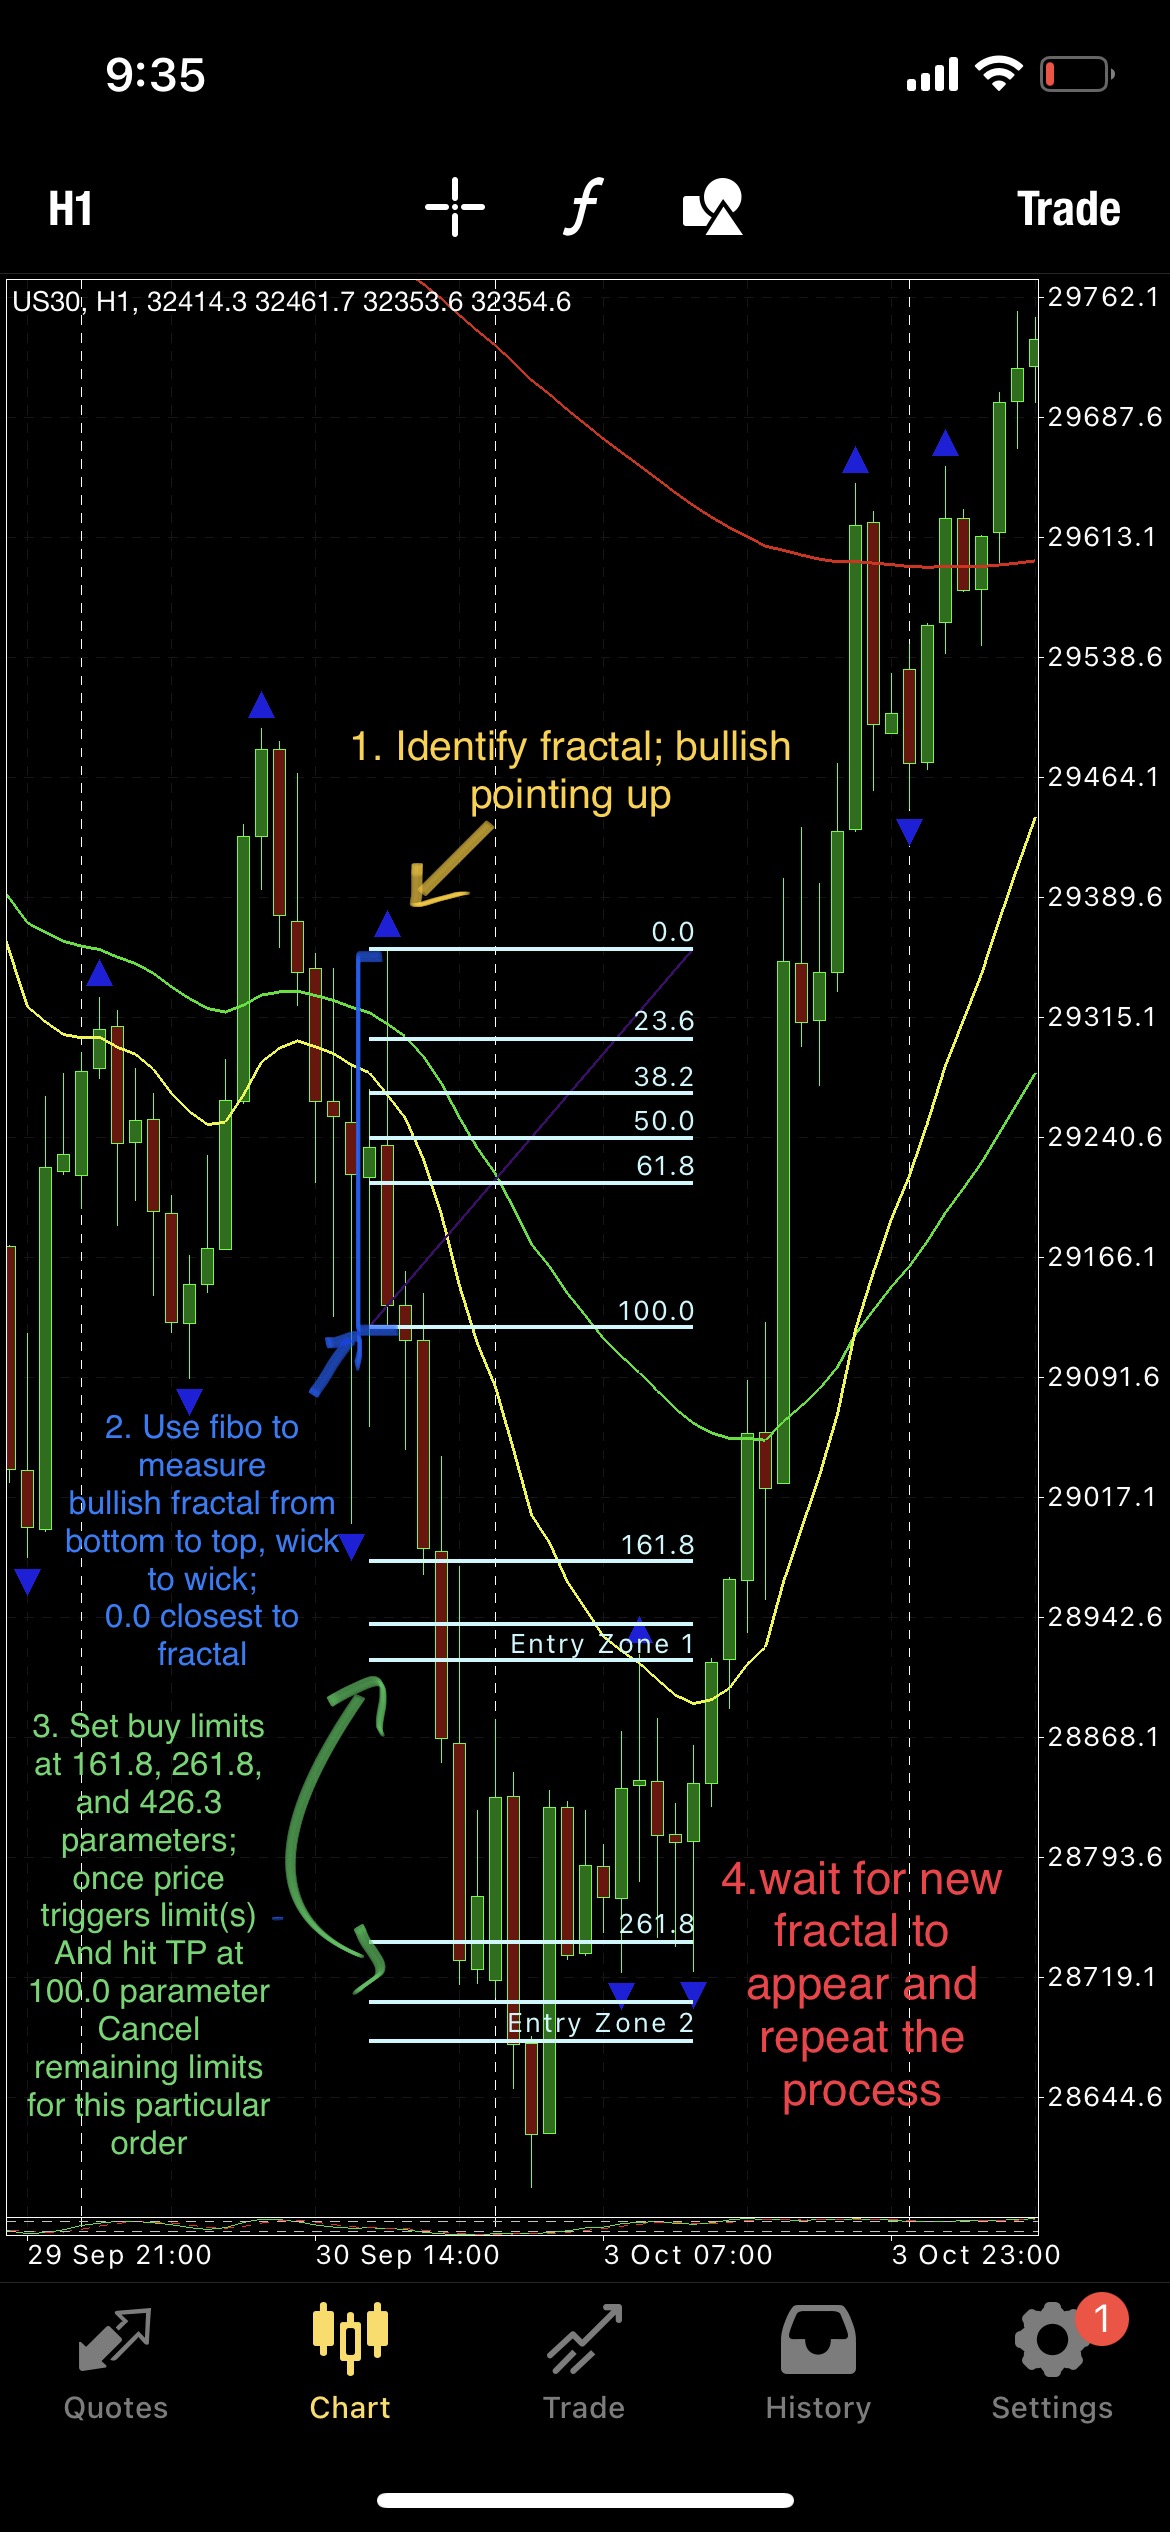
The conditions exactly to place the fibo and how do we know it's going down : We place the fibo once the fractal identifies a high or a low. That candle is identified by a triangle above or below it. We measure the highs from bottom to top. We measure the lows from top to bottom.
The reason to choose this candle:
If its a bullish fractal we use the Fibonacci to measure it from bottom to top. And if it’s a bearish fractal we measure it from top to bottom.
If you think it’s gonna be impossible to make the Fibonacci measure the fractals in this manner where it can initiate buys or sells based off the direction of the fractal candle? Entry zone for either buy or sell are at 161.8,261.8 and 423.6 I place my buy and sells once price hit these particular areas… based off the measurements from the fibo tool
once the fractal appears, depending if it’s bullish, the fibo is used to measure that candle from bottom to top. From there it will stretch the tool to see entries at those particular parameters that I specified. Then we wait for price to retrace to these parameters and that’s where I would like the buy entries to be. Once the fractal appears, depending if it’s bearish, the fibo is used to measure that candle from top to bottom. From there it will stretch the tool to see entries at those particular parameters that I specified. Then we wait for price to retrace to these parameters and that’s where I would like the sell entries to be triggered.