HowTradeFractalZFS
- インディケータ
- Vasiliy Smirnov
- バージョン: 1.0
- アクティベーション: 20
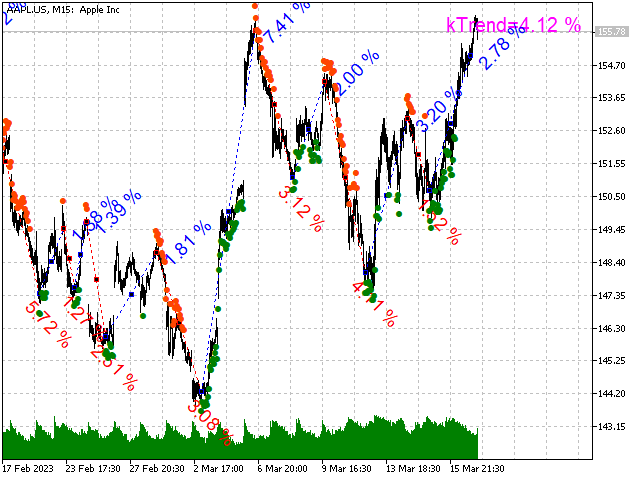
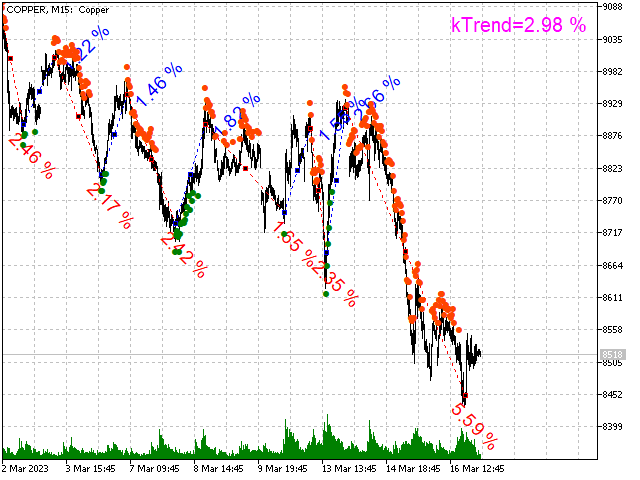
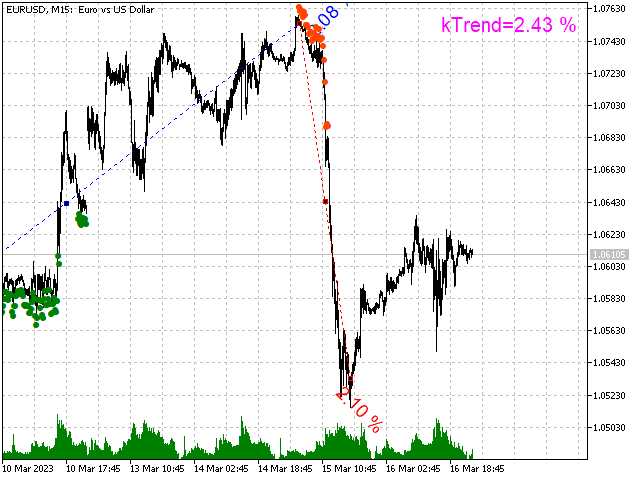
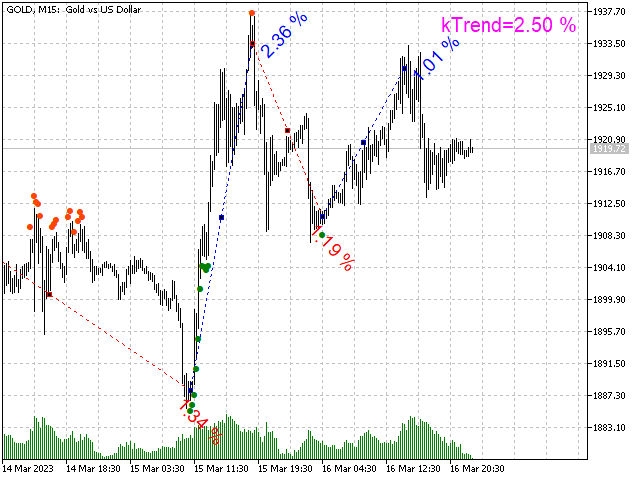
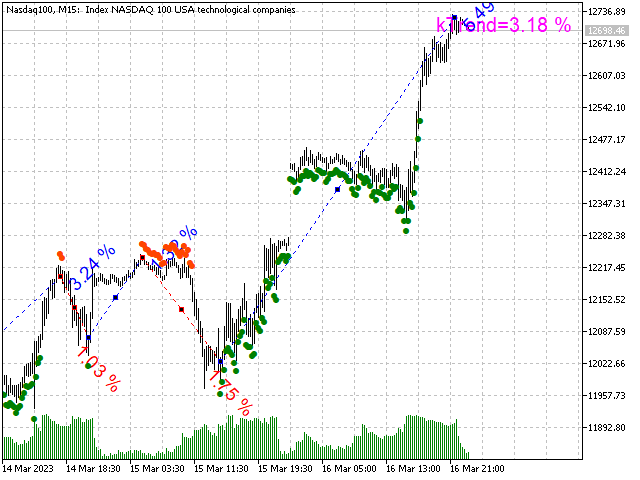
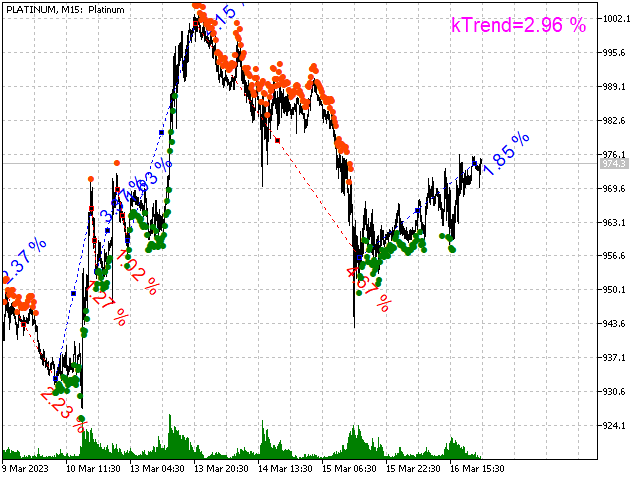
取引の結果、矢印指標、顧問の仕事、取引戦略の開発を分析するためのグラフィカルな指標。
主なパラメータの1つは、利益の最小割合です。
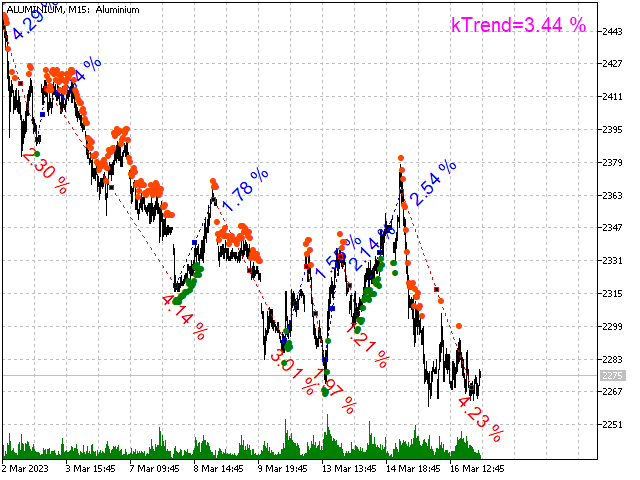
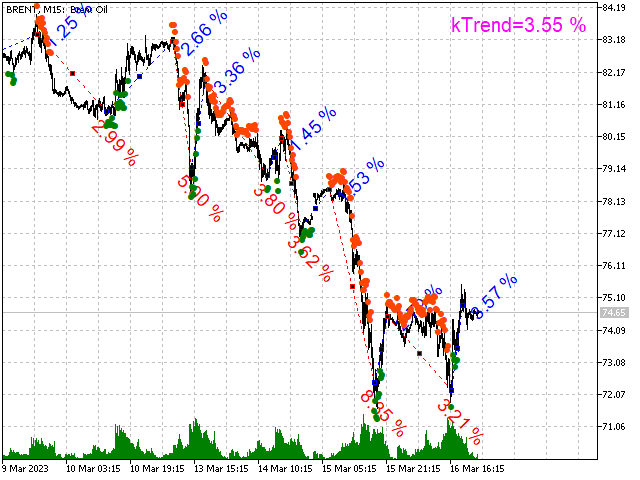
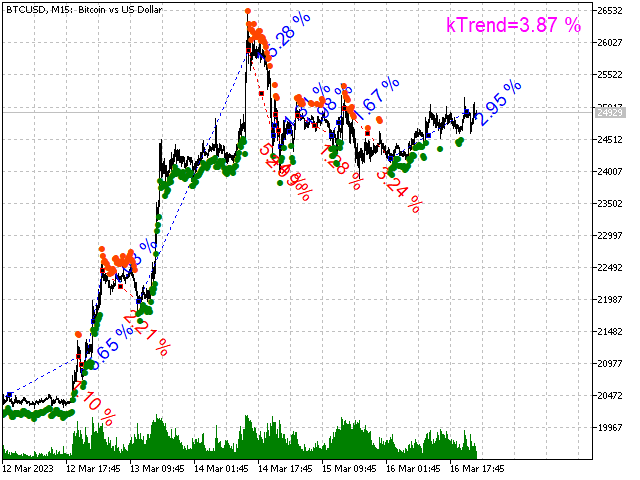
この指標は、閉じたバーとフラクタルを考慮して、任意のチャート上のすべての傾向を示し、各傾向の利益の最大割合を計算します。
さらに、商品の平均利益率を計算します。 楽器の中でより大きな割合は、投機のためのこの楽器の歴史的魅力を示しています。
インジケータを高速化するには、より小さな計算間隔を使用します。
取引の結果、矢印指標、顧問の仕事、取引戦略の開発を分析するためのグラフィカルな指標。
主なパラメータの1つは、利益の最小割合です。
この指標は、閉じたバーとフラクタルを考慮して、任意のチャート上のすべての傾向を示し、各傾向の利益の最大割合を計算します。
さらに、商品の平均利益率を計算します。 楽器の中でより大きな割合は、投機のためのこの楽器の歴史的魅力を示しています。
インジケータを高速化するには、より小さな計算間隔を使用します。