WA Order Block FVG bos MT5
- インディケータ
- Eduardo Da Costa Custodio Santos
- バージョン: 1.0
- アクティベーション: 5
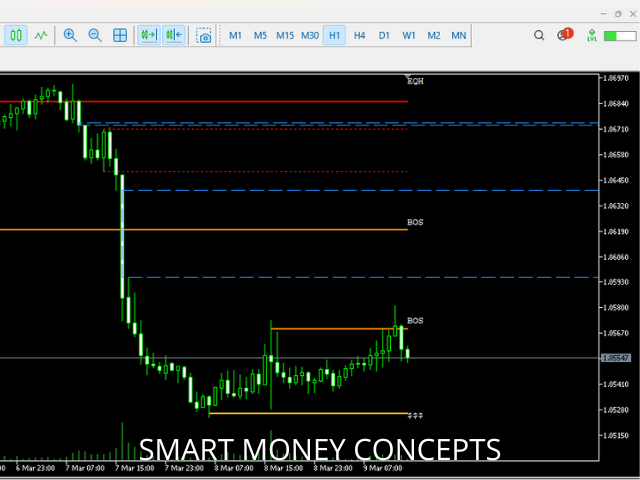
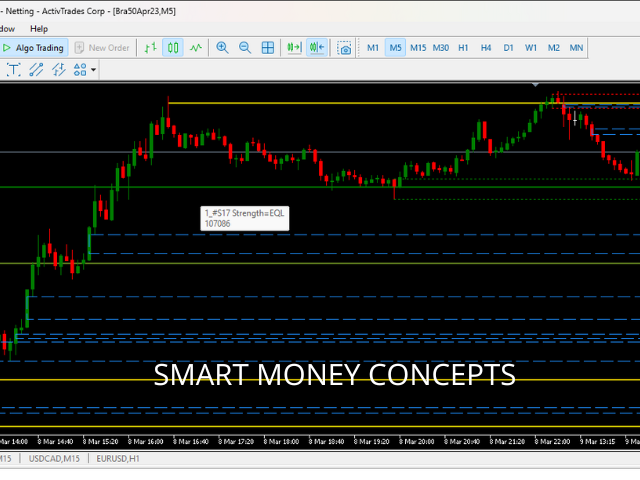
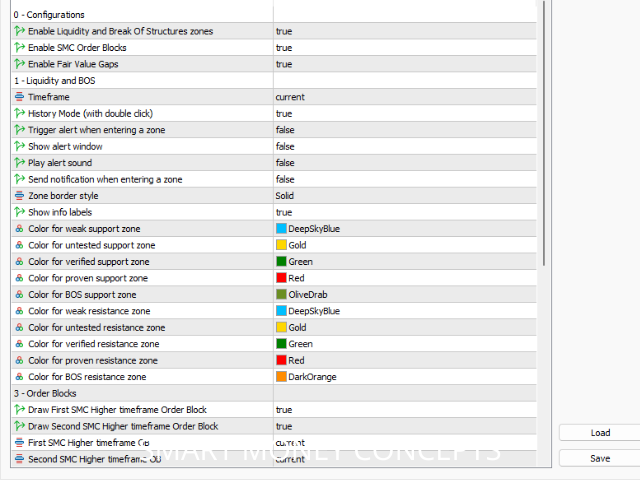
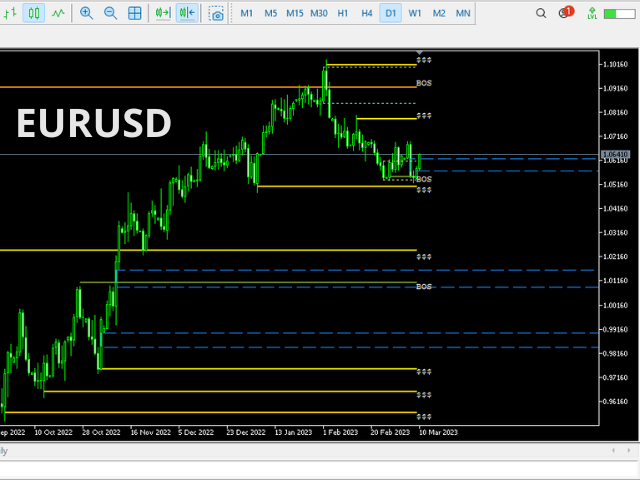
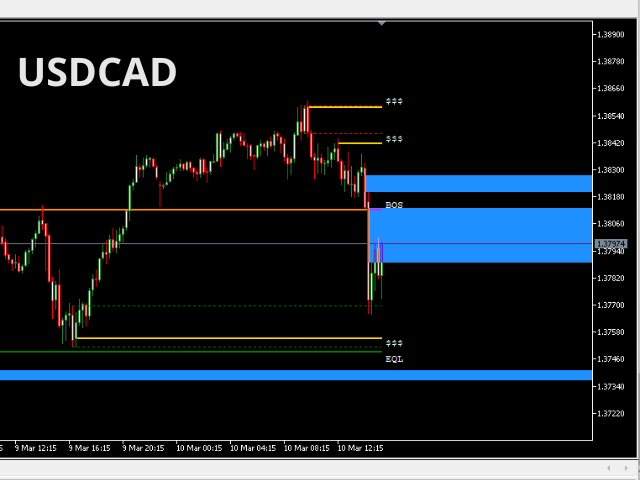
O WA Order Block FVG bos MT5 é um indicador com base no estudo de SMC (Smart Money Concepts) criado pelo ICT Inner Circle Trader, eleplota no seu gráfico as informações de Order Blocks em 3 tempos gráficos diferentes, fair Value Gaps e Regiões de Liquidez além do BOS ( Break os Structures), tudo em um só indicador.
Dessa forma você não precisa colocar essas informações de forma manual.
Agora você tem tudo isso de forma automática em seu gráfico.