Patternist
- インディケータ
- Ziya Gurkan Badem
- バージョン: 2.0
- アップデート済み: 27 11月 2022
- アクティベーション: 5
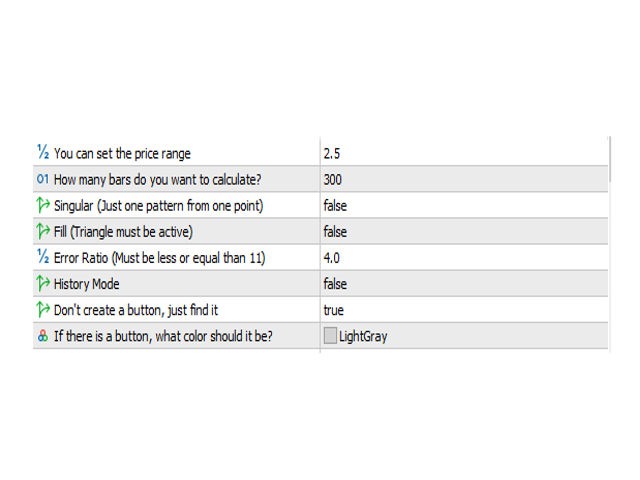
*ジグザグを修正して加速しました。 (範囲は変更できます)
* ジグザグは、新しいキャンドル/バーごとに更新されます。
※必要に応じて、ボタンを有効にして、ボタンをクリックしたときだけパターンを検索します。自動的に行うと、チャートが更新されるたびに検索されます。
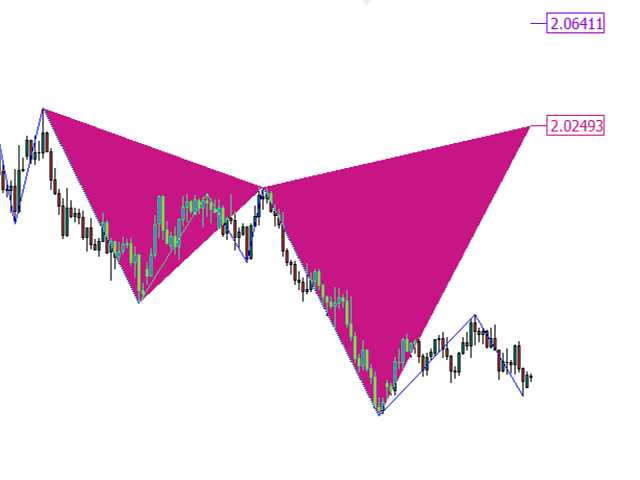
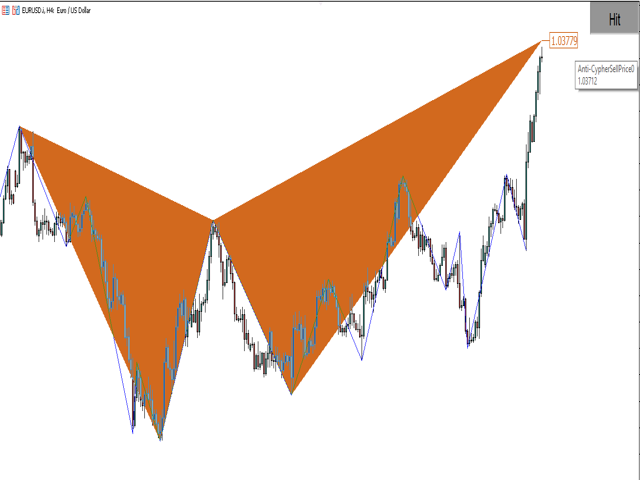
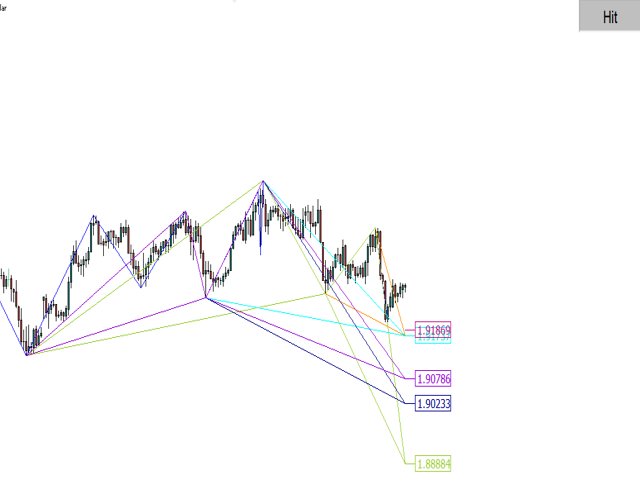
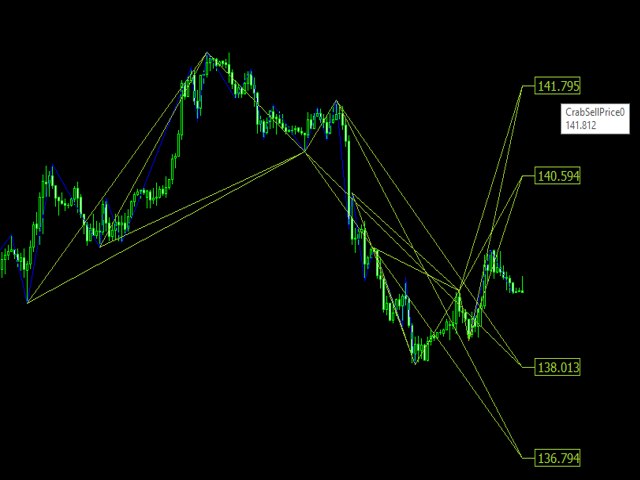
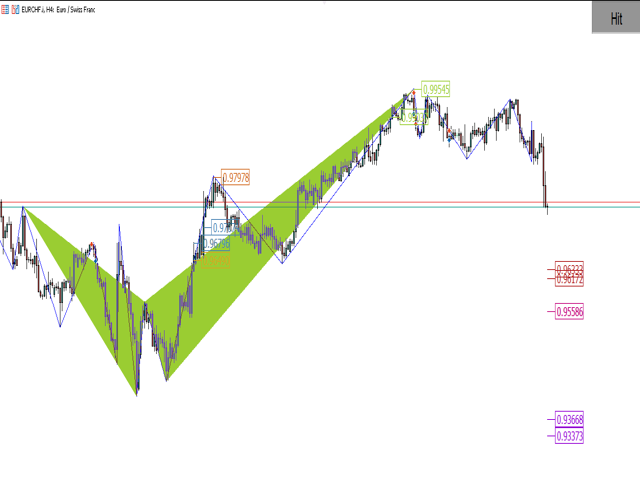
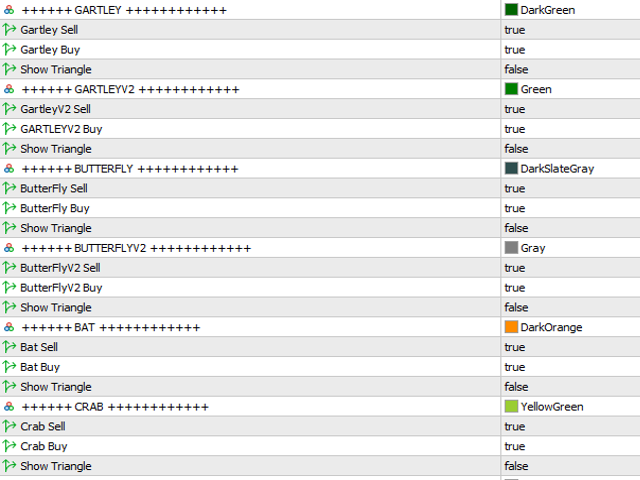
* 17 の頻繁に使用されるハーモニック パターンと、独自のプロポーションを定義できる特別なパターン。
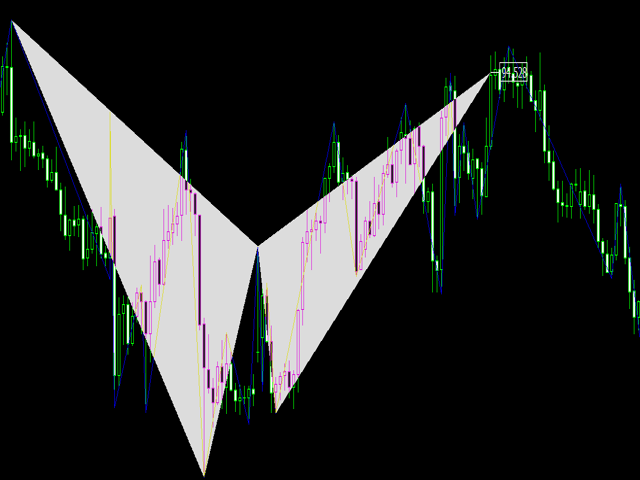
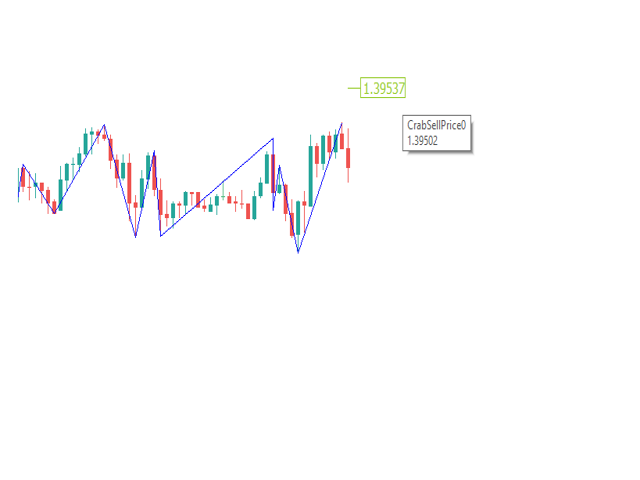
*価格表示でチャートをシンプルに保つことができます。必要に応じて、三角形の表現を作成できます。
※「ヒストリーモード」で過去の公演を振り返ることができます。
※再塗装はしておりません。
※パターンルールが無効な場合、パターンは削除されます。価格が所定の水準に達した場合、売買が可能です。
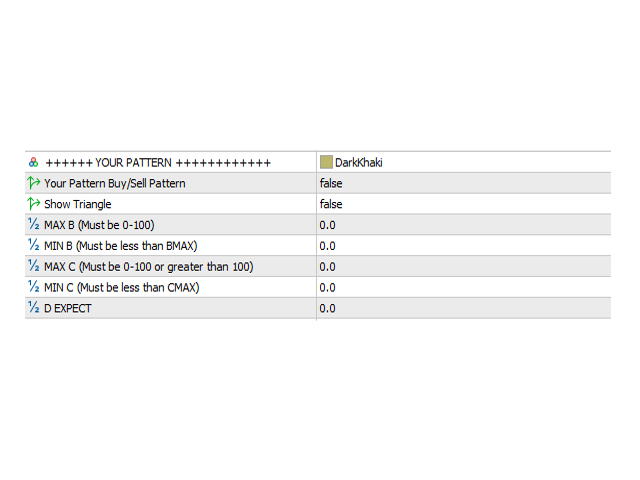
* 注: 他のすべてのパターンを「false」に設定し、独自の比率を設定できます。履歴モードで独自のパターンをテストできます。満足のいく結果が得られたら、テンプレートとして保存できます。
* パターン:
* Custon パターン (あなたの特別な比率)
*ガートレー
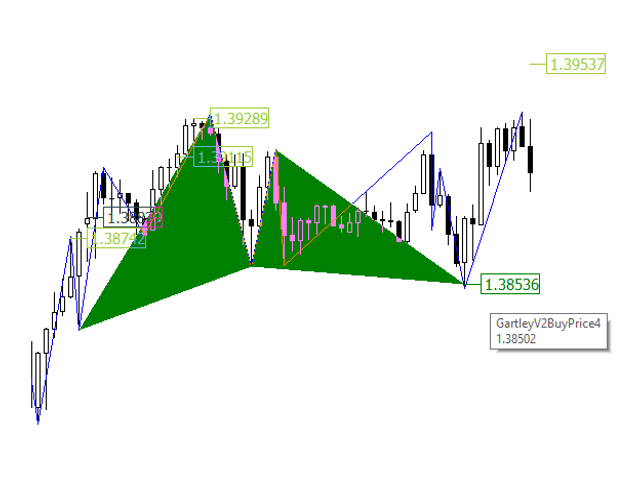
* GarleyV2
* 蝶
*ButterFlyV2
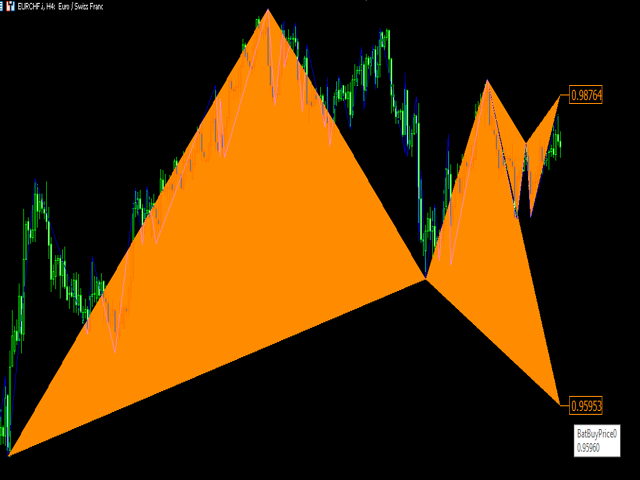
* バット
* カニ
*ディープクラブ
*サイファー
* 鮫
・ネンスター
*アンチバタフライ
*アンチバット
*アンチカニ
*アンチサイファー
・アンチ・ガートレー
*アンチAシャーク
*アンチネンスター