• 概要
  • レビュー
  • コメント (31)
  • 最新情報

MultiSymbol Triple Screen Trading System

Purpose

The indicator is intended for manual multi-currency trading based on the Triple Screen Strategy.

It works with any symbols located in the Market Watch window of the MT4: currencies, metals, indexes, etc.

The number of instruments can be limited by capacity of the МТ4's parameters. But if desired, you can create several windows with various set of instruments and parameters.


Operation Principle

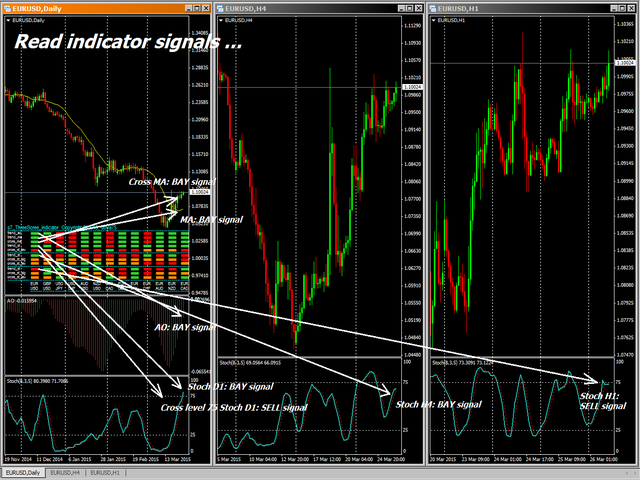
The indicator uses the modified Triple Screen Strategy for determining trend direction in the third window via Awesome Oscillator, Moving Average or Stochastic Oscillator at the trader's discretion. The oversold/overbought level is determined in the second window via Stochastic indicator. We also use Stochastic indicator in the first window, but this time we are determining the best market entry point. As a result, we obviate the necessity to move pending orders according to the market (what the classical system requires) and can enter the market at once.


Target Audience

The indicator will be useful for those who prefer multi-currency trading.

If you use the Triple Screen Strategy, you have to analyze three time periods for each instrument. You need a lot of time to work with a large number of symbols. We created this indicator to facilitate this work. It independently analyzes all chosen instruments by three time periods. When it finds the required combination of parameters' values, it notifies a trader about a possibility to perform a trade.

The trader only needs to specify parameters which will be used by the indicator to check the possibility to perform the trade with given instruments.


Features

The indicator informs the trader about the possibility to perform the trade by means of a message popping up on the screen, sending message to an e-mail or a mobile terminal, or just by a sound notification.

The indicator works with current prices (uses the zero bar).

To reduce the CPU load, it is possible to customize the period for redrawing the indicator values.


Input parameters

Indicator_Position
    • myPosition - indicator location in the main window of the chart (lower left, lower right)
Visible_Symbols
    • Symbols - enter the instruments for tracking (separated by commas, without spaces)
Third_screen_Settings
    • ThTrendAO - trend direction based on the Awesome Oscillator indicator on the third screen (true - enable, false - disable)
    • ThTrendMA - trend direction based on the Moving Average indicator on the third screen (true - enable, false - disable)
    • ThCrossMA - price above/below the Moving Average indicator line on the third screen (true - enable, false - disable)
    • ThTrendSt - trend direction based on the Stochastic Oscillator indicator on the third screen (true - enable, false - disable)
    • ThCrossStLev - the main value of Stochastic Oscillator above/below the oversold/overbought level on the third screen (true - enable, false - disable)
    • ThTF - timeframe of the third screen in minutes (1440=D1, 240=H4, 60=H1, etc.)
Second_screen_Settings
    • SeTrendSt - trend direction based on the Stochastic Oscillator indicator on the second screen (true - enable, false - disable)
    • SeCrossStSig - intersection of the signal line by the main line of the Stochastic Oscillator on the second screen (true - enable, false - disable)
    • SeCrossStLev - the main value of Stochastic Oscillator above/below the oversold/overbought level on the second screen (true - enable, false - disable)
    • SeTF - timeframe of the second screen in minutes (1440=D1, 240=H4, 60=H1, etc.)
First_screen_Settings
    • FiTrendSt - trend direction based on the Stochastic Oscillator indicator on the first screen (true - enable, false - disable)
    • FiCrossStSig - intersection of the signal line by the main line of the Stochastic Oscillator on the first screen (true - enable, false - disable)
    • FiCrossStLev - the main value of Stochastic Oscillator above/below the oversold/overbought level on the first screen (true - enable, false - disable)
    • FiTF - timeframe of the first screen in minutes (1440=D1, 240=H4, 60=H1, etc.)
iMA_Settings
    • MAPeriod - averaging period for calculation of the indicator
    • MAMethod - averaging method
    • MAAppliedPrice - applied price
iStochastic_Settings
    • StKPeriod - period (number of bars) for calculating the %K line
    • StDPeriod - averaging period for %D line calculation
    • StSlowing - value of slowing
    • StMethod - averaging method
    • StPriceField - select the price for calculations
    • StHighLevel - overbought level
    • StLowLevel - oversold level
Alert_Settings
    • UseAlert - display alerts in a pop-up window (true - enable, false - disable)
    • UseSendMail - send notifications to e-mail (true - enable, false - disable)
    • UseSendPush - send notifications to the mobile terminal (true - enable, false - disable)
    • UseSound - use sound notifications (true - enable, false - disable)
    • UseSoundFile - path to the audio file
    • StepAlertMin - interval between notifications in minutes
    • StepCalcSec - interval to recalculate the functions in seconds (redrawing the indicator)
Color_scheme
    • ClrTips - color for labels and the indicator grid
    • ClrText - color to indicate the instruments and periods
    • ClrUp - color for the bullish trend signals
    • ClrDown - color for the bearish trend signals
    • ClrNt - color for the neutral signals
    • ClrOff - color for the disabled signals


Display

  • green - buy signal;
  • red - sell signal;
  • orange - neutral signal;
  • gray - parameter is disabled.
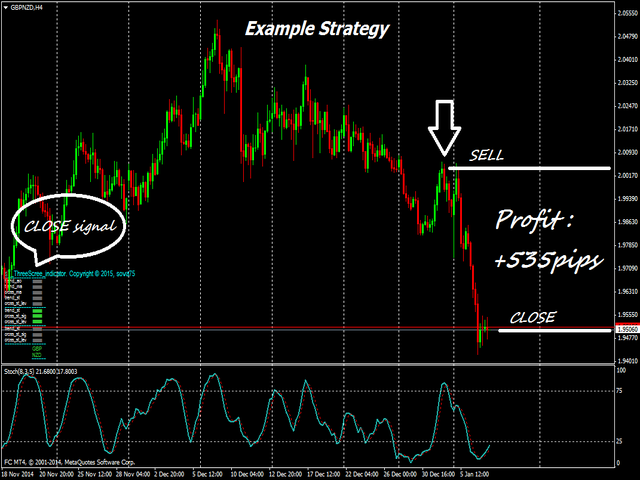

How to use

Screenshots below indicate an example of trading using this indicator.

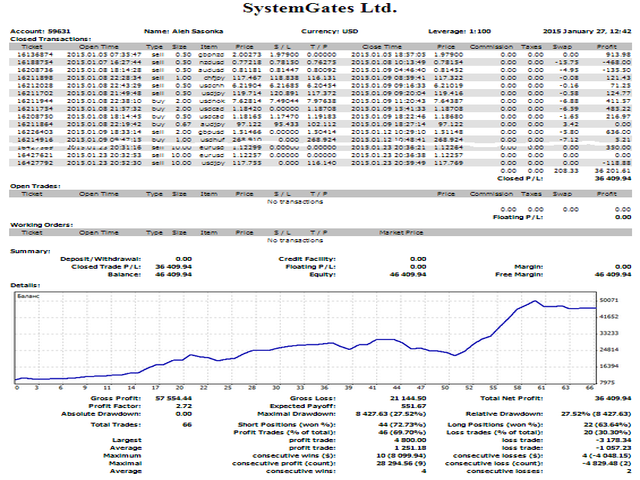
The indicator was developed for the contest of traders using manual trading based on the Triple Screen Strategy (you can see the results on the last screenshot).

おすすめのプロダクト
The EasyTrend is a seemingly simple but quite powerful trend indicator. Everyone has probably come across indicators or Expert Advisors that contain numerous input parameters that are difficult to understand. Here you will not see dozens of input parameters, the purpose of which is only clear to the developer. Instead, an artificial neural network handles the configuration of the parameters. Input Parameters The indicator is as simple as possible, so there are only 2 input parameters: Alert -
H4 GBPUSD Trend Scalper is a trend signal scalper The EA trades according to the trend strategy using original built-in indicator for opening and closing orders. The external inputs for limiting trading on Fridays and Mondays are available. The purpose of the strategy is to use the current trend with the most benefit. According to the results of testing and working on demo and real accounts, the best results achieved by using the Н4 timeframe on the GBP/USD pair Works on MetaTrader 4 Build 971+
The Expert Advisor will help you forward all pop-up alert with screenshot from  MetaTrader 4 to Telegram channel/ group, also forward all notifications to Telegram. Parameters  -  Telegram Bot Token - create bot on Telegram and get token.  -  Telegram Chat ID  - input your Telegram user ID,  group / channel ID  -  Forward Alert - default true, to forward alert.  -  Send message as caption of Screenshot - default false, set true to send message below Screenshot  How to setup and guide  - Telegram
こんにちは! 私はあなたの注意に私の自身の設計の顧問を持って来る。 取引の平均期間は2〜3日です。 設定はすべての通貨ペアに共通しており、JPY、CHF、GBPのペアを除いて、ほとんどの商品が適しています。 取引は1時間ごとの時間枠(H1)で行われます。 取引の平均期間は最大2〜4日です。 入力は滑りなしでテスターのように理想的な性能を与える蝋燭の開始で行われる。 任意の時点で条件の組み合わせによってトランザクションを終了します。 深夜(23時-0時)には取引への参入が禁止されています。  アドバイザの設定 DollarsPerLot-すべてのNアカウントの通貨のための0.01ロット FilterTrade-数値が高いほど、位置に入るためのフィルターはより硬くなりますが、平均して7-8-9-10を設定することをお勧めします Magikはアドバイザーの魔法です。  FilterDayは、入力を除外する日です。 用語の貿易曜日。 ラリー・ウィリアムズを読んでください。 0の場合、私の練習が示すように、私たちは常に取引します、この戦略は火曜日を除いてより良く機能しま
Fishing
Yasha Firooz
1 (1)
注意:外国為替トレーダー   「市場で取引するときにあなたにもっとお金を稼ぐチャートインディケーターを取得してください ... 」 はい!私はより多くのお金を稼ぎ、取引をシンプルにし、市場がリアルタイムで何をしているのかを簡単に理解する準備ができています! それに直面しよう、外国為替取引所での取引は複雑でストレスが多く、当惑しているように見えるかもしれません!チャートは、適切なシステムとインジケーターのガイドがなければ、圧倒的で混乱する可能性があります。チャートを正しく分析していないために再び市場に焦げてしまうのではないかと思うので、胃の結び目の感触を取り除きます。 「トレーダーのブロック」はどうですか?すべてのトレーダーが簡単に陥る 1 つの落とし穴は、大きな勝利または大きな損失の後の恐ろしい「トレーダーのブロック」です。あなたは大きな勝利の後に同じ成功を再現することができますか、または大きな損失の後に別の財政的な落とし穴に落ちることができますか?優れた釣り指標ガイドは、この問題を回避し、ストレスと不安を和らげるのに役立ちます。 " 究極の外国為替直感的なテクニカル指標の提示 " 
M5 タイムフレームのロボット スカルパー。 GBPUSD 通貨ペアでの取引。このロボットは、英ポンドの取引のためにプロのトレーダーの会社によって特別に開発されました。ロボットは、毎日約 5 ~ 15 の取引を開始します。 GBPUSD のスプレッドが最大 10 ピップスまでの低いブローカーと取引するのが最善です。開始するための推奨最低入金額は $500 以上です。 利点: マーチンゲールは使いません。 ネットではありません。 すべての取引にはストップロスがあります。 GBPUSDペア専用のプロボット。 ロボットスキャルパー、M5 期間の日中取引。 このロボットはどのように取引しますか? 市場を分析するために、ロボットは 2 つの指標の価格モデルと戦略的な市場パターンを使用します: パラボリック ストップとリバース システムとボリンジャー バンド。ロボットは最初に、価格エントラポレーション統計を使用して価格の動きについて市場を分析します。次に、ロボットはこれらの指標を読み取り、現在と過去の動きの傾向を比較します。市場の反転またはロールバックを示すパターンが一致した場合、ロボットは
Knowledge of the strength and weakness of each currency is vital for every forex trader. Our   Currency Strength Meter indicator   measures the strength of eight major currencies (USD, EUR, GBP, CHF, JPY, CAD, AUD, NZD) by using the Relative Strength Index indicator, also known as RSI. The Currency Strength Meter indicator shows you, simply and quickly, when a currency is oversold, overbought, or in "normal area". This way, you can identify which currency is the strongest and the weakest. Our
Black series MT4 - The indicator is designed for trading on binary options with Timeframe M1-M5-M15 Multicurrency (Works on cryptocurrency and currency pairs) The signal appears when the candle opens Up to 90% correct signals There is no signal redrawing at all Can be used with other indicators. Good for scalping! In Settings there is: -Indicator working methods -I Allert Arrow color Red signal down Blue signal up Also watch the video how the indicator works and signals
Forex strength meter is a useful indicator with which novice traders and professionals can analyze the market and see when and where to open a deal. Forex strength meter is an analytical complex for Metatrader4 which, in the form of lines on the chart, shows the trader the direction of the trend and its reversals. The interpretation of the indicator is very simple. When the indicator draws a red line above the blue line on the chart, it means that the trend is now going down. At this point, it
RaysFX Supertrend Bar RaysFX Supertrend Bar è un indicatore personalizzato per MetaTrader 4. Utilizza l'indice di canale delle materie prime (CCI) per generare segnali di trading. L'indicatore mostra dei puntini in una finestra separata sotto il grafico principale per indicare i segnali di trading. Caratteristiche principali: Calcola il CCI per diversi periodi temporali. Visualizza puntini per indicare i segnali di trading. Permette all'utente di modificare i periodi temporali e la distanza tra
This utility allows to quickly scan markets on different timeframes without dragging symbols from Market Watch. It supports multi timeframe analysis, ie. 3 different timeframes can be scanned. Additionally, it saves objects drawn of chart to file and synchronize its between other windows. Also, this utility will automatically save all objects and drawing to a file and restore when switching back; also template will be loaded on other charts, too. The watchlist is based on instruments listed on M
Trend reversal indicator, no repainting. Clean and light rendering There is no alternative buy-sell signal without taking into account the trend. Noise filtering capability. Works with all pairs. Ideal for beginners and experienced traders It is best used on timeframes above the M30, from the beginning of the London session to America. It should be remembered that there are no indicators that are not wrong. Any strategy requires confirmation of its signals. When building your own system, it
Channel indicator based on the principles of mathematical statistics. It uses neural networks to simplify a lot of complex calculations, which makes the indicator fast, even for weak computers. How it works The indicator is based on the moving average, the period of which you can set. The indicator analyzes price deviations from the moving average line for the last 1440 or 2880 bars, and each line indicates a certain probability of a price reverse depending on the selected settings: Standard,
MagicExcel will allow you to extrapolate, from your trades, reports split down by Expert Advisor. The generated reports allow you to quickly compare statistics of trades data from different Expert Advisors, different symbols and also the behavior of an Expert Advisor against different symbols. Additionally, if selected, a report will be created that shows the behavior of the Expert Advisor over time. This is a very useful tool for a trader who works with many Expert Advisors at the same time. R
PABT Pattern Indicator - it's classical system one of the signal patterns. Indicator logic - the Hi & Lo of the bar is fully within the range of the preceding bar, look to trade them as pullback in trend. In the way if indicator found PABT pattern it's drawing two lines and arrow what showing trend way.  - First line - it's entry point and drawing at: 1. On the high of signal bar or on middle of the signal bar (depending from indicator mode) for buy; 2. On the low of signal bar or on middle of t
“Practically everyone can forgive us for honesty: and, say, an insufficiently professional game, and even insufficiently professional poetry. There are many examples of this. But when honesty disappears, nothing is forgiven.” Golden Rings   - Forex financial robot offers options for finding profitable trades even in unstable markets when the current trend direction is unclear. It will follow the best trend to maximize profits and reduce the chances of possible losses. To work in MetaTrader
Currencies Strength Meter Smooth Lines   Currencies Strongest Weakest   SMOOTH STRENGTH METER INDICATOR (SMOOTH LINE) it draws Currencies TREND Volatility Power / Strength lines : -          Detects the 2 highly TRENDED Volatile pairs  ( will be the Bold Lines ) - A very Helpful Indicator - It draws smooth lines for up to 20 currencies pairs representing Volatility  strength and power - First it indicates the most powerful trended direction pairs : Strongest / Weaker -          MAIN FUNCTION  :i
Power Average
Khurram Mustafa
4.33 (3)
This Indicator is a  affordable trading tool  because with the help of  Popular Developers & Support of M Q L Platform  I have programmed this strategy. I tried to combine logic of  Moving Averages, Parabolic Stop And Reverse, Trend Strength, Oversold, Overbought . Furthermore, I have also care about  Support Resistance  that Trader can easily get in touch with market by selecting one indicator only. What is in for Trader? Trading Modes:  This selection is for  activate whole strategy  "Power
FREE
Szia! Egy indikátorral. Több idő gyertyájának kirajzoltatása egy charton. Különböző színek rendelhetők a long és short gyertyákhoz. Vonal vastagsága állítható. A gyertya kitöltése engedélyezhető. Hello! With an indicator. Drawing multiple time candles on a chart. Different colors can be ordered for long and short candles. Line thickness can be adjusted. Filling the candle can be allowed. Videó: https://www.youtube.com/watch?v=-9bequnAw-g&amp ;ab_channel=GyulaKlein
このインジケータは、スプレッドを3種類のフォーマットでCSVファイルに出力できるユーティリティです。 スプレッドがトレード結果に大きく影響を与えるようなスキャルピングの場合、あなたが利用するFX業者のスプレッドの仕様は、意識しなければならない重要な点です。スプレッドは時間帯によって大きく値が変化しますので、FX業者が公式に発表しているスプレッドの平均値は、あまり参考になりません。FX業者ごとのスプレッドの仕様を、ユーザー自ら調査することはとても大切なことです。このインジケーターは、そのようなユーザーのお役に立ちます。 CSVファイルの説明 CSVファイルは、( ./MQL4/Files/ )のフォルダに作成されます。ただし、テスターを使ったテストの場合には、( ./tester/files/ ) のフォルダに作成されます。CSVファイルのフォーマットの仕様は、スクリーンショットを参照してください。 CSV_file1 : スプレッドはtickごとに出力します。"YYYY/MM/DD", "HH:MI:SS", "Spread(pips)" CSV_file2 : Bar単位ごとの
インジケータMTFクリスタリウム矢印は、半自動取引システムであります. これは、すべての通貨ペアで動作します。  インジケータは、三つのルールを使用しています:1)我々は唯一のトレンドで取引、2)"誰もが販売しているときに購入し、誰もが買うときに販売する"、3)価格  インジケータMTF矢印は、内蔵の指標を使用して、複数の時間枠全体のクリスタリウムフィルタルール。 トレンドは、選択した時間間隔で一致した場合、インジケータは、市場に参入するための矢印を与えます。 それからあなた自身の決定をする。 購入する-緑の矢印、売る-赤い矢印。 指標では、ロットを変更したり、EAの取引時間とシャットダウン時間を設定することができます。 また、作業期間と時間フィルタを変更することができます。 ビープ音が鳴ってる  推薦された働く期間D1。 フィルタH1とH4。  設定: TF働く期間(推薦されたD1) Cci_cperiodcomment CCIレベルアップ CCIレベルDn CCI価格 SARステップ SAR最大値 TFのFilter1–(推薦されたH1
Advisor FU PULSAR  - is a scalper with high accuracy of market entries. The EA is able to work with medium spreads (for testing we used a spread of 20 points on GBPUSD), it is not critical to slippage, and it is also not demanding on trading conditions. It uses Stop Loss as protection for orders, and uses virtual trailing stop as a percentage of the balance as order support. It does not open orders often but as accurately as possible. FU PULSAR does not use indicators. The algorithm contains
VR Cub
Vladimir Pastushak
VR Cub は、質の高いエントリーポイントを獲得するためのインジケーターです。このインジケーターは、数学的計算を容易にし、ポジションへのエントリーポイントの検索を簡素化するために開発されました。このインジケーターが作成されたトレーディング戦略は、長年にわたってその有効性が証明されてきました。取引戦略のシンプルさはその大きな利点であり、初心者のトレーダーでもうまく取引することができます。 VR Cub はポジション開始ポイントとテイクプロフィットとストップロスのターゲットレベルを計算し、効率と使いやすさを大幅に向上させます。取引の簡単なルールを理解するには、以下の戦略を使用した取引のスクリーンショットを見てください。 設定、設定ファイル、デモ版、説明書、問題解決方法は、以下から入手できます。 [ブログ] レビューを読んだり書いたりすることができます。 [リンク] のバージョン [MetaTrader 5] エントリーポイントの計算ルール ポジションをオープンする エントリーポイントを計算するには、VR Cub ツールを最後の高値から最後の安値までストレッチする必要があります。
Moving indicator. It is written so that it doesn't signal when two moving averages cross. Easy to operate.  It performed well on European and Asian currencies. Designed for long-term and medium-term types of trading.  Индикатор мувингов. Написан так что даёт сигнал при пересечении двух скользящих. Прост в управлении.   Хорошо себя показал на европейских и азиатских валютах.  Рассчитан  на долгосрочный тип торговли. 
FREE
Sykes Scalping Machine   This EA was inspired from nononsenseforex,  using a number of well known high probability entry and exit positions using Kijun-sen Breakouts. Sykes Scalping Machine EA is a smart and fully automated Forex Expert Advisor for the Metatrader 4 trading platform. The system tests the hypothesis of price fluctuations and provides the output related to the previous trends and processes the market using Kijun-sen breakouts and confluence of mathematical price calculations. Thi
Utilities This is an EA program to make it easier for traders to place open limit orders on the market. This program is equipped with: Set Lots Set BuyLimit, (this is the first price you must input to set up a BuyLimit order on the chart) Set SellLimit, (this is the first price you must input to set up a SellLimit order on the chart) SL and TP sets, Set Magic Number (I also matched it in the Order Comment) Set STEP By Point, Set Max Order, and Close all by Magic Number (you can close all orde
如果产品有任何问题或者您需要在此产品上添加功能,请联系我 Contact/message me if you encounter any issue using the product or need extra feature to add on the base version. There are two critical components in a profitable trading system. One is entry (placing an order) and another one is exit (closing an order). You can exit by time: closing order after London Close, for example. You can also exit by position: closing an order when price reaches a certain support/resistance level. Easy RR Monitor Panel is an intuitive, an
It's a variation of mid of HH and LL since it compares the higher of HH or LL against a period and twice the number of bars back to avoid whipsaws. I used to display this against lines on a chart, but made a histogram out of it and it looks interesting. It looks good at gauging trend strength and general turns (see image below). The name of the indicator is BAM, which is an acronym for "Below and Above Mid". Ways to use it: 1. To see general trend on longer TFs (more than 60 ba
The indicator shows the channel in which the price moves The algorithm for calculating the indicator is based on Fibonacci numbers, and also depends on the volatility of the instrument. Corrections and price reversals are most likely near the channel borders. Allows you to conduct trend and counter trend trade within the channel It works on all timeframes, on any currency pairs, metals and cryptocurrency Can be used when working with binary options Distinctive features Shows clear boundaries o
このプロダクトを購入した人は以下も購入しています
まず第一に、この取引インジケーターは再描画されず、再描画されず、遅延しないことを強調する価値があります。これにより、手動取引とロボット取引の両方に理想的なものになります。 ユーザーマニュアル:設定、入力、戦略。 アトミックアナリストは、価格の強さとモメンタムを利用して市場でより良いエッジを見つけるためのPA価格アクションインジケーターです。ノイズや誤ったシグナルを除去し、取引ポテンシャルを高めるための高度なフィルターを備えています。複雑なインジケーターの複数のレイヤーを使用して、アトミックアナリストはチャートをスキャンし、複雑な数学的計算をシンプルなシグナルと色に変換します。これにより、どのような初心者トレーダーでも理解して使用し、一貫した取引の決定を行うことができます。 「アトミックアナリスト」は、新規および経験豊富なトレーダー向けにカスタマイズされた包括的な取引ソリューションです。プレミアムインジケーターとトップノッチの機能を1つの取引戦略に組み合わせ、すべてのタイプのトレーダーにとって汎用性のある選択肢にします。 デイリートレーディングとスキャルピング戦略:高
Enigmera
Ivan Stefanov
5 (3)
エニグメラ:市場の中核 https://www.enigmera.com はじめに このインディケータと取引システムは、金融市場に対する驚くべきアプローチです。ENIGMERAは、フラクタルサイクルを使用して、サポートとレジスタンスレベルを正確に計算します。本格的な蓄積局面を示し、方向性と目標を示します。 トレンド中でも調整中でも機能するシステムです。 どのように作動するのか? ENIGMERAは、支持線・抵抗線、目標線、乖離線の3つのラインで構成されています。このシステムは、過去のデータを現在と未来に外挿する典型的な市場指標とは異なり、現在の完全な画像を提供します。支持線上にある場合、それは本当の支持を意味し、抵抗線上にある場合、それは本当の抵抗を意味する。ある水準が破られた場合、それはトレンドの変化を意味する。再描画はしない。 市場は常に進化しているため、ENIGMERAはその評価ツールを適応させ、定期的に戦略を修正しています。  これにより、すべてのシナリオが徹底的に評価されることが保証されます。この市場指標の独自性は、その能力を見れば明らかです。  ENIGM
An exclusive indicator that utilizes an innovative algorithm to swiftly and accurately determine the market trend. The indicator automatically calculates opening, closing, and profit levels, providing detailed trading statistics. With these features, you can choose the most appropriate trading instrument for the current market conditions. Additionally, you can easily integrate your own arrow indicators into Scalper Inside Pro to quickly evaluate their statistics and profitability. Scalper Inside
指示する     ロシア     -        utilizar con   el indicador の ESP 推奨事項 -   TPSpro トレンド プロフェッショナル版 -   MT5のバージョン 最も重要なことは、将来においても最も重要なことです。 機能のプリンシパル: ゾーンのほとんどは、ベンダーとコンプラドールによってアクティブ化されます。 状況を直感的に把握できるよう、初期の衝動を修正します。 LOGIC AI: MUESTRA zonas (círculos) parabuscar puntos de entrada cuando se activa una plantilla 視覚的に優れた視覚効果があり、最も重要な機能がすべて揃っていることに注意してください。 優れたニベレス/ゾーンの視覚化 (modo MTF) 世界で最も人気のある場所/ゾーンです。これを使用するのに最適な方法です (   TPSproTREND PRO   )。 アルゴリズム プロフェッショナル セパラド パソ ア パソ パラ オペラ それは、オペラハウスやコントラ・デ・エラの指導におい
Dynamic Forex28 Navigator - 次世代の Forex 取引ツール。 現在 49% オフ。 Dynamic Forex28 Navigator は、長年人気のインジケーターを進化させたもので、3 つの機能を 1 つにまとめています。 Advanced Currency Strength28 インジケーター (レビュー 695 件)  + Advanced Currency IMPULSE with ALERT (レビュー 520 件) + CS28 コンボ シグナル (ボーナス)。 インジケーターの詳細 https://www.mql5.com/en/blogs/post/758844 次世代の Strength インジケーターが提供するもの  オリジナルで気に入っていたすべての機能が、新機能と精度の向上によって強化されました。 主な機能: 独自の通貨強度計算式。 すべての時間枠でスムーズかつ正確な強度ライン。 トレンドの特定と正確なエントリーに最適です。 ダイナミックマーケットフィボナッチレベル (マーケットフィボナッチ)。 このインジケー
TPSpro TREND PRO は 、市場を自動的に分析し、トレンドとその各変化に関する情報を提供し、再描画せずに取引に参加するためのシグナルを提供するトレンド指標です。 インディケータは各ローソク足を使用し、個別に分析します。さまざまなインパルス(アップまたはダウンインパルス)を指します。通貨、仮想通貨、金属、株、指数の取引への正確なエントリーポイント! バージョンMT5                   インジケーターの完全な説明   インジケーター -   RFI LEVELS と併用することをお勧めします。 主な機能: レンダリングなしで正確な入力信号! シグナルが表示された場合、それは関連性を維持します。これは、シグナルを提供してからそれを変更する可能性があり、入金時の資金の損失につながる可能性があるリドローインジケーターとの重要な違いです。より高い確率と精度で市場に参入できるようになりました。矢印が表示された後、ターゲットに達する (利益確定) か反転シグナルが表示されるまで、ローソク足を色付けする機能もあります。 STOP LOSS / TAKE PROFIT
mql5と Telegramの モーニング・ブリーフィングで、詳細とスクリーンショットを含む毎日のマーケット・アップデートをご覧 ください! FX Power MT4 NGは 、長年の人気を誇る通貨強度計FX Powerの次世代モデルです。 この次世代ストレングスメーターは何を提供するのでしょうか?初代FXパワーの魅力すべて プラス GOLD/XAUの強さ分析 より正確な計算結果 個別に設定可能な分析期間 カスタマイズ可能な計算上限値により、さらに優れたパフォーマンスを実現 もっと見たい人のための特別なマルチインスタンス設定 すべてのチャートでお好みの色を無限に設定可能 数え切れないほどの通知オプションにより、重要なことを見逃すことはありません。 Windows 11とmacOSのスタイルで角を丸くした新しいデザイン 魔法のように動くインジケーターパネル FXパワーの主な機能 すべての主要通貨の強さの完全な履歴 すべての時間枠における通貨の強さの履歴 すべてのブローカーとチャートで同一の計算結果 100%信頼できるリアルタイム計算 -> リペイントなし ドロップダウン・リストから
現在20%OFF! 初心者やエキスパートトレーダーのためのベストソリューション! このダッシュボードソフトウェアは、28の通貨ペアで動作しています。それは私達の主要な指標(高度な通貨の強さ28と高度な通貨インパルス)の2に基づいています。それは全体の外国為替市場の大きい概観を与えます。それは、すべての(9)時間枠で28の外国為替ペアのための高度な通貨の強さの値、通貨の動きの速度と信号を示しています。チャート上で1つのインディケータを使用して市場全体を観察し、トレンドやスキャルピングの機会をピンポイントで見つけることができたら、あなたのトレードがどのように改善されるか想像してみてください。 このインディケータには、強い通貨と弱い通貨の識別、潜在的な取引の識別と確認がより簡単になるような機能が搭載されています。このインディケータは、通貨の強さや弱さが増加しているか減少しているか、また、すべての時間枠でどのように機能しているかをグラフィカルに表示します。 新機能として、現在の市場環境の変化に適応するダイナミックなマーケットフィボナッチレベルが追加され、すでに当社のAdvan
MetaBands M4
Vahidreza Heidar Gholami
5 (2)
MetaBandsは、強力でユニークなアルゴリズムを使用してチャンネルを描画し、トレンドを検出して、トレーダーに取引の入出ポイントを提供することができます。チャンネル指標に加えて、強力なトレンド指標でもあります。入力パラメータを使用して新しいチャンネルを作成するために、異なるタイプのチャンネルを統合することができます。MetaBandsは、市場のイベントについてユーザーに通知するために、すべてのタイプのアラートを使用します。 特徴 ほとんどのチャンネルアルゴリズムをサポート 強力なトレンド検出アルゴリズム 異なるタイプのチャンネルを統合する能力 マルチタイムフレームおよびマルチカレンシー(シグナルマトリックス) すべてのタイプのアラート機能(サウンド、画面フラッシャー、プッシュ通知、メール、ポップアップ、矢印) 再描画しない トレンド検出 MetaBandsは、チャネル内を振動する青いラインを使用してトレンドを検出します。ラインがチャネルの上部バンドに達すると、下降トレンドの開始を示し、下部バンドに達すると上昇トレンドの開始を示します。青いラインが中心ラインに近づくと、市場はコンソ
TrendMaestro
Stefano Frisetti
5 (3)
note: this indicator is for METATRADER4, if you want the version for METATRADER5 this is the link:  https://www.mql5.com/it/market/product/108106 TRENDMAESTRO ver 2.4 TRENDMAESTRO recognizes a new TREND in the bud, he never makes mistakes. The certainty of identifying a new TREND is priceless. DESCRIPTION TRENDMAESTRO identifies a new TREND in the bud, this indicator examines the volatility, volumes and momentum to identify the moment in which there is an explosion of one or more of these data a
現在31%オフ! 初心者やエキスパートトレーダーに最適なソリューション! このインジケータは、独自の機能と秘密の数式を組み込んだ、ユニークで高品質かつ手頃な価格のトレーディングツールです。たった1枚のチャートで28の通貨ペアのアラートを表示します。新しいトレンドやスキャルピングチャンスの引き金となるポイントを正確に把握することができるので、あなたのトレードがどのように改善されるか想像してみてください! 新しい基本的なアルゴリズムに基づいて構築されているため、潜在的な取引の特定と確認がより簡単になります。これは、通貨の強さや弱さが加速しているかどうかをグラフィカルに表示し、その加速のスピードを測定するためです。加速すると物事は明らかに速く進みますが、これはFX市場でも同じです。つまり、反対方向に加速している通貨をペアにすれば、利益を生む可能性のある取引を特定することができるのです。 通貨の勢いを示す縦の線と矢印は、あなたの取引の指針となるでしょう。 ダイナミックマーケットフィボナッチ23レベルはアラートトリガーとして使用され、市場の動きに適応します。もしインパルスが黄色
Ultimate Gold Advisor for MetaTrader 4 – 成功を保証する最先端のトレーディングツール! Ultimate Gold Advisorは単なるインジケーターではなく、MetaTrader 4でのトレーディングアプローチを革命的に変えるテクノロジーの宝石です。最も要求の厳しいトレーダーのニーズを満たすように設計されたこの最先端のインジケーターは、外科的な精度、洗練された分析、強力な機能を組み合わせて、市場での無敵の競争優位性を提供します。金の取引に最適ですが、幅広い資産に対応できるUltimate Gold Advisorは、あなたの真の利益の可能性を引き出す鍵です。 Ultimate Gold Advisorがすべてのトレーダーにとって必需品である理由は? 優れたパフォーマンス:成功率が驚異の89%に達するこのインジケーターは、信頼性が高いだけでなく、非常に効果的です。勝ちトレードと負けトレードはすべてグラフ上で明確に表示され、リアルタイムで戦略の真の潜在能力を確認できます。これにより、アプローチを最適化し、数学的な精度で利益を最大化できます。 明確
FX Volume
Daniel Stein
4.58 (33)
mql5と Telegramの モーニング・ブリーフィングで、詳細とスクリーンショットを含む毎日のマーケット・アップデートをご覧 ください! FX Volumeは、ブローカーの視点から市場のセンチメントをリアルに洞察する、最初で唯一の出来高インジケーターです。 ブローカーのような機関投資家が外国為替市場でどのようなポジションをとっているか、COTレポートよりもはるかに速く、素晴らしい洞察を提供します。 この情報をチャート上で直接見ることは、あなたの取引にとって真のゲームチェンジャーであり、画期的なソリューションです。 以下のようなユニークなマーケットデータ洞察から利益を得てください。 比率は 、通貨のロングポジションとショートポジションの比率をパーセントで表示します。 比率の変化は 、選択した期間内のロング比率とその変化率を表示します。 Volumes Totalは 、通貨の取引量(ロングとショート)の合計をロット単位で表示します。 Volumes Long :全通貨のロングポジションの取引量を表示します。 Volumes(ショート )は、全通貨のショートポジションの取引量を表示
これはMT4のインジケーターで、再描画なしで取引に参入するための正確なシグナルを提供します。 外国為替、暗号通貨、金属、株式、インデックスなど、あらゆる金融資産に適用できます。かなり正確な見積もりを提供し、取引を開始して終了するのに最適な時期を教えてくれます。1つのシグナルを処理しただけでインジケーターの元が取れた例の 動画 (6:22)をご覧ください。Entry PointsPro インジケーターの助けを借りたほとんどのトレーダーの最初の1週間の結果が改善しています。 Telegramグループ に登録してください。Entry Points Proインジケーターのメリットは次の通りです。 再描画のないエントリーシグナル 再描画されるインジケーターでは一度表示されたシグナルが削除されて大きな金銭的損失につながることがありますが、これと異なり、表示されて確認されたシグナルは消えることがありません。 エラーなしの取引開始 インジケーターアルゴリズムによって取引を開始する(資産を売買する)理想的な瞬間を見つけることができます。それを使用するすべてのトレーダーの成功率が向上します。
ご紹介     Quantum Breakout PRO は 、ブレイクアウト ゾーンの取引方法を変革する画期的な MQL5 インジケーターです。 13年以上の取引経験を持つ経験豊富なトレーダーのチームによって開発された Quantum Breakout PROは 、革新的でダイナミックなブレイクアウトゾーン戦略により、あなたの取引の旅を新たな高みに押し上げるように設計されています。 クォンタム ブレイクアウト インジケーターは、5 つの利益ターゲット ゾーンを備えたブレイクアウト ゾーン上のシグナル矢印と、ブレイクアウト ボックスに基づいたストップロスの提案を提供します。 初心者トレーダーにもプロのトレーダーにも適しています。 量子EAチャネル:       ここをクリック MT5バージョン:   ここをクリック 重要!購入後、インストールマニュアルを受け取るためにプライベートメッセージを送ってください。 推奨事項: 時間枠: M15 通貨ペア: GBPJPY、EURJPY、USDJPY、NZDUSD、XAUUSD アカウントの種類: ECN、Raw、また
現在26%オフ 初心者やエキスパートトレーダーに最適なソリューション! このインジケーターは、独自の機能と新しい計算式を取り入れた、ユニークで高品質、かつ手頃な価格のトレーディングツールです。たった1枚のチャートで28の為替ペアの通貨強度を読み取ることができます。新しいトレンドやスキャルピングチャンスの引き金となるポイントを正確に特定することができるので、あなたのトレードがどのように改善されるか想像してみてください。 ユーザーマニュアルはこちら  https://www.mql5.com/en/blogs/post/697384 これが最初の1本、オリジナルだ! 価値のないクローンを買わないでください。 特別な サブウィンドウの矢印で強い通貨の勢いを表示 GAPがあなたのトレードを導く! 基準通貨や気配値が売られすぎ・買われすぎのゾーン(外相フィボナッチレベル)にあるとき、個別チャートのメインウィンドウに警告表示。 通貨がレンジの外側から反落した場合、プルバック/リバーサルのアラート。 クロスパターンの特別なアラート 複数の時間枠を選択可能で、トレンドを素早く
Was: $299  Now: $99   Supply Demand uses previous price action to identify potential imbalances between buyers and sellers. The key is to identify the better odds zones, not just the untouched ones. Blahtech Supply Demand indicator delivers functionality previously unavailable on any trading platform. This 4-in-1 indicator not only highlights the higher probability zones using a multi-criteria strength engine, but also combines it with multi-timeframe trend analysis, previously confirmed swings
Advanced Supply Demand
Bernhard Schweigert
4.91 (294)
現在33%オフ 初心者にもエキスパートトレーダーにも最適なソリューション このインジケーターは独自の機能と新しい公式を多数内蔵しており、ユニークで高品質かつ手頃な取引ツールです。このアップデートでは、2つの時間枠ゾーンを表示できるようになります。より長いTFだけでなく、チャートTFとより長いTF(ネストゾーンを表示)の両方を表示できます。すべてのSupply Demandトレーダーの皆さんのお気に召すはずです。:) 重要情報の公開 Advanced Supply Demandの可能性を最大化するには、 https://www.mql5.com/ja/blogs/post/720245 にアクセスしてください。   エントリーまたはターゲットの正確なトリガーポイントを正確に特定できれば取引がどのように改善されるか想像してみてください。新しい基盤となるアルゴリズムに基づいて構築されているため、買い手と売り手の間の潜在的な不均衡をさらに簡単に特定できます。これは、最も強い需要と供給のゾーンと、過去のパフォーマンス(古いゾーンを表示)がグラフィカルに表現されるためです。これらの機能は、最適
Automated Trendlines
Georgios Kalomoiropoulos
5 (16)
トレンドラインは、外国為替取引におけるテクニカル分析の最も重要なツールです。残念ながら、ほとんどのトレーダーはそれらを正しく描画していません。自動トレンドラインインジケーターは、市場のトレンドの動きを視覚化するのに役立つ本格的なトレーダー向けのプロフェッショナルツールです。 トレンドラインには、強気トレンドラインと弱気トレンドラインの2種類があります。 上昇トレンドでは、外国為替トレンドラインは価格変動の最低スイングポイントを介して描画されます。 少なくとも2つの「最低安値」を接続すると、トレンドラインが作成されます。 下降トレンドでは、トレンドラインは価格変動の最も高いスイングポイントを介して描画されます。 少なくとも2つの「最高値」を接続すると、トレンドラインが作成されます。 トレンドラインが壊れたとき? 弱気のろうそくが強気のトレンドラインの下で閉じ、ろうそくの高さがトレンドラインの上にあるとき、強気のトレンドラインは壊れます。 強気のろうそくが弱気のトレンドラインの上で閉じ、ろうそくの安値がトレンドラインの下にあるとき、弱気のトレ
Order Block Hunter
Noha Mohamed Fathy Younes Badr
5 (6)
Order block hunter indicator is the best indicator for  hunt the order blocks that area where there has been a large concentration of limit orders waiting to be executed Order blocks are identified on a chart by observing previous price action and looking for areas where the price experienced significant movement or sudden changes in direction .This indicator does that for you by using very complicated codes and helps you to take the best areas To buy and sell because it make marks at the best a
TakePropips Donchian Trend Pro
Eric John Pajarillaga Aldana
4.44 (16)
TakePropips Donchian Trend Pro   (MT4) は、ドンチャン チャネルを使用してトレンドの方向を自動的に検出し、エントリーとエグジットの取引シグナルを提供する強力で効果的なツールです! この多機能インジケーターには、トレンド スキャナー、取引シグナル、統計パネル、スクリーナー、取引セッション、およびアラート履歴ダッシュボードが含まれます。取引シグナルを提供し、チャートを分析する時間を節約するように設計されています! ユーザー マニュアルとインストール ガイドは、ブログ投稿 (   https://www.mql5.com/en/blogs/post/751368   ) からダウンロードできます。 今日は 50% オフ! 98ドルから49ドルに値下げ! このインジケーターは、ストラテジー テスターでテストできます (ビジュアル モードを有効にします)。 詳細については、説明の下にあるビデオ チュートリアルも利用できます。 ご不明な点やサポートが必要な場合は、私に連絡してください。 TakePropips Donchian Trend Pro イン
Best Currency Strength Indicator
Tumelo Patrick Rakotsoane
4.59 (46)
Advanced Currency Strength Indicator The Advanced Divergence Currency Strength Indicator. Not only it breaks down all 28 forex currency pairs and calculates the strength of individual currencies across all timeframes , but, You'll be analyzing the WHOLE forex market in 1 window (In just 1 minute) . This indicator is very powerful because it reveals the true movements of the market.  It is highly recommended to  analyze charts knowing the performance of individual currencies or the countries ec
Allows multiple indicators to be combined into a single indicator, both visually and in terms of an alert. Indicators can include standard indicators, e.g. RSI, CCI, etc., and also Custom Indicators, even those purchased through Market, or where just have the ex4 file. An early alert is provided, say when 4 out 5 indicators have lined up, and a confirmed alert when all are in agreement. A‌lso features a statistics panel reporting the success of the combined indicator by examining the current cha
現在20%OFF! 初心者やエキスパートトレーダーに最適なソリューションです。 このインディケータは、エキゾチックペア・コモディティ・インデックス・先物など、あらゆるシンボルの通貨の強さを表示することに特化したインディケータです。金、銀、原油、DAX、US30、MXN、TRY、CNHなどの通貨の強さを表示するために、9行目にどのシンボルでも追加することができます。独自の機能を多数搭載し、新しい計算式を採用したため、ユニークで高品質、かつ手頃な価格のトレーディングツールとなっています。新しいトレンドやスキャルピングチャンスのトリガーポイントを正確に把握することができるため、あなたのトレードがどのように改善されるか想像してみてください。 ユーザーマニュアル:ここをクリック   https://www.mql5.com/en/blogs/post/708876 すべての時間枠に対応します。あなたはすぐにトレンドを見ることができるようになります! 新しいアルゴリズムに基づいて設計されているため、潜在的な取引の特定と確認がより簡単になります。これは、8つの主要通貨と1つのシンボ
Precautions for subscribing to indicator This indicator only supports the computer version of MT4 Does not support MT5, mobile phones, tablets The indicator only shows the day's entry arrow The previous history arrow will not be displayed (Live broadcast is for demonstration) The indicator is a trading aid Is not a EA automatic trading No copy trading function The indicator only indicates the entry position No exit (target profit)  The entry stop loss point is set at 30-50 PIPS Or the front
NAM Order Blocks
NAM TECH GROUP, CORP.
5 (1)
MT4マルチタイムフレームオーダーブロック検出インジケーター。 特徴 -チャートコントロールパネルで完全にカスタマイズ可能で、完全な相互作用を提供します。 -必要な場所でコントロールパネルを表示および非表示にします。 -複数の時間枠でOBを検出します。 -表示するOBの数量を選択します。 -さまざまなOBユーザーインターフェイス。 -OBのさまざまなフィルター。 -OB近接アラート。 -ADRの高線と低線。 -通知サービス(画面アラート|プッシュ通知)。 概要 注文ブロックは、金融機関や銀行からの注文収集を示す市場行動です。著名な金融機関と中央銀行が外国為替市場を牽引しています。したがって、トレーダーは市場で何をしているのかを知る必要があります。市場が注文ブロックを構築するとき、それは投資決定のほとんどが行われる範囲のように動きます。 注文の構築が完了すると、市場は上向きと下向きの両方に向かって急激に動きます。注文ブロック取引戦略の重要な用語は、機関投資家が行っていることを含むことです。それらは主要な価格ドライバーであるため、機関投
カスタムMT4インジケーターで外国為替取引を成功させるための秘密を発見してください! 外国為替市場で成功を達成し、リスクを最小限に抑えながら一貫して利益を得る方法を疑問に思ったことはありますか? これがあなたが探している答えです! 取引へのアプローチに革命をもたらす独自のMT4インジケーターを導入できるようにします。 ユニークな汎用性 私たちのインジケータは、RenkoとRangeBarのろうそくのフォーメーションを好むユーザー向けに特別に設計されています。 これらのチャートタイプは多くの経験豊富なトレーダーに好まれていることを理解しています。そのため、私たちのインジケーターはそれらとシームレスに統合され、比類のない市場分析を提供します。 クリアトレンドシグナル 複雑な分析を忘れてください! 私たちのインジケーターは、鮮やかな色と明確なドット構造を利用して、市場の動向を明確に示しています。 赤と青の点は、価格の動きの方向性について疑いの余地がなく、取引の迅速な意思決定を可能にします。 HH/HL HL/LL戦略とのアライメント HH/HLおよびHL/LL構
Harmonic Papallons
Ramon Sobrevals Arce
3.33 (3)
Automatically scans the chart to find Harmonic Patterns, and give you the chance to enter early in good operations. Also if selected, it will alert you in advance when future patterns appears, showing you a projection of a posible future pattern. The main goal  for this algorithm is to determine with high precision the moment when a trend ends and a new one begins. Giving  you the best price within a reversal.   We have added the "Golden Trade", we define it as the perfect order: For those orde
Gold Channel is a volatility-based indicator, developed with a specific timing algorithm for the XAUUSD pair, which consists of finding possible corrections in the market. This indicator shows two outer lines, an inner line (retracement line) and an arrow sign, where the theory of the channel is to help identify overbought and oversold conditions in the market. The market price will generally fall between the boundaries of the channel. If prices touch or move outside the channel it is a tra
NextCandlePredictor インジケーター NextCandlePredictorは、再描画しない、色が変わらない、動かない、消えない、遅延がないアラート付きのシグナルインジケーターです。あらゆるタイムフレームで次のキャンドルまたはその次のキャンドルの方向を識別するのに役立ちます。ニューヨーク、ロンドン、またはその両方の重なり合う高ボラティリティ市場に特にお勧めです。 主な特徴: タイムフレームの汎用性: M1からH1以上のあらゆるタイムフレームで迅速かつ正確なシグナルを提供します。 明確な買い/売りシグナル: ADXのDI+とDI-ラインを使用して明確な買いと売りのシグナルを生成し、最良のトレード判断を下せるようにします。 直感的な視覚化: シグナルはチャート上に緑色(買い)と赤色(売り)の矢印で直接表示され、迅速かつ簡単に読み取れます。 カスタマイズ可能な設定: 分析するバーの数とアラートオプションを好みとトレード戦略に応じて調整できます。使用するTFに応じた提案表を以下で確認してください。 即時およびオプションのキャンドル終了時アラート: デフォルトでは、ADX条件が
作者のその他のプロダクト
This adviser can be used without optimization. To get started, you only need to install the desired risk (or the size of the lot) and regularly withdraw profit. For a start, you can install the trial version of the Expert Advisor Hunter bot PriceLines Lite , which will work on a real account with a minimum lot (and therefore with minimal risk). In this, the main version, all settings are available. EA is designed for fully automated trading. It spelled out the function of protection against most
Script Hunting for the Channel Breakout The script is designed for semi-automatic trading. It can place required number of pending BuyStop and SellStop orders with preset StopLoss and TakeProfit levels in one go. The script calculates the channel width using the ZigZag indicator and places a grid of pending BuyStop and SellStop orders according to specified settings. The first pair of pending BuyStop and SellStop orders is placed at the specified distance from the channel's borders. This distanc
FREE
An Expert Advisor. A channel breakthrough signal. Attach two horizontal lines to a chart: one for the upper channel line, name it < Up > the other one for the lower border, name it < Dn > Settings: sound = true - play a sound notification alert = true - show a dialog box containing user data comment = true - show a comment in the upper left corner of the chart print = false - print a message to the Experts log repet = 3 - number of times the sound file is played.
FREE
Script Deleting the Hunter The script is developed for fast deletion of pending orders, Up and Dn border lines, as well as arrows (symbols) which appear when an order is placed. Features: Can delete all pending orders of the current chart in one go Can delete all pending orders of the current account in one go Can delete only those orders which have specified magic number Can delete lines which show the channel's border, support and resistance levels marked Up and Dn Can delete all arrows (sym
FREE
Hunter on the channel breakout Bot The Expert Advisor places the necessary amount of BuyStop and SellStop pending orders with predefined StopLoss and TakeProfit levels at the specified time daily. The EA calculates the channel width using the ZigZag indicator and sets a grid of BuyStop and SellStop pending orders according to the specified settings. The first pair of BuyStop and SellStop pending orders is placed at a predetermined distance from the channel borders. The distance is set in the pe
The indicator displays two nearest levels in real time. The one above the current BID price is a resistance level. The one below the current BID price is a support level. The levels are calculated by the standard ZigZag indicator. Application The indicator can be used as an assistant in manual trading to obtain data on the nearest support/resistance levels. The indicator can be used on any timeframe. When a displayed level is touched or broken through, an audio alert is triggered (specified in
This utility displays the name of the current symbol and the current period in the chart background in a large font. It is very convenient, e.g. when you use multiple charts with different symbols, period or when saving a chart screenshot. The information is displayed in two lines. In the first line, the chart symbol and current timeframe are shown in a larger font (e.g. AUDUSD,h1 ). In the second line, the full name of the current symbol is displayed in a smaller font (e.g. for GPBJPY it shows
This expert Advisor is a more developed version of  News Hunter Bot OneTime . The EA places pending orders BuyStop and SellStop before the news release at a specified distance from the current price. The date and time of the news release is set in the EA parameters for a few days in advance. In total, you can set the time for 20 news. Also, the EA indicates how many minutes before the news you need to place pending orders and after how many minutes you should remove pending orders that have not
This is a multi-currency version of  Hunter bot PriceLines Extra . This expert Advisor can be installed on different currency pairs, with no limit on the number. All copies of the expert Advisor work as one team. When you open a market order for one of the instruments, all other advisors go into standby mode. As soon as the market order is closed, all the experts return to the active mode. For a start, you can install the trial version of the expert Advisor   Hunter bot PriceLines Lite , which w
A dealer with simple logic of opening orders and reliable closing control for advanced. The input signal is determined by only one indicator. Closing occurs on target profit. When drawdring first orders, the following appears. Maximum number of orders - no more than three in each direction. Settings for configuration: ----------- Trade Settings ----------- Quantity Lot 1 - the size of the first transaction Quantity Lot 2 - the size of the second transaction in the series Quantit
This utility displays the name of the current symbol and the current period in the chart background in a large font. It is very convenient, e.g. when you use multiple charts with different symbols, period or when saving a chart screenshot. The information is displayed in two lines. In the first line, the chart symbol and current timeframe are shown in a larger font (e.g. AUDUSD,h1 ). In the second line, the full name of the current symbol is displayed in a smaller font (e.g. for GPBJPY it shows
Purpose The indicator is intended for manual multi-currency trading based on the Triple Screen Strategy. It works with any symbols located in the Market Watch window of the MT5: currencies, metals, indexes, etc. The number of instruments can be limited by capacity of the МТ5's parameters. But if desired, you can create several windows with various set of instruments and parameters. Operation Principle The indicator uses the modified Triple Screen Strategy for determining trend direction in the
A dealer with simple logic of opening orders and reliable closing control for advanced. The input signal is determined by only one indicator. Closing occurs on target profit. When drawdring first orders, the following appears. Maximum number of orders - no more than three in each direction. Settings for configuration: ----------- Trade Settings ----------- Quantity Lot 1 - the size of the first transaction Quantity Lot 2 - the size of the second transaction in the series Quantit
The robot uses the logic of triangular arbitration. To work it, you need to choose a triangle of currency pairs, for example EURUSD_GBPUSD_EURGBP. The robot compares the basic cross-pair with its artificial analogue and trades towards the lag of quotations. The lag is calculated for each of the three currency pairs. The difference in quotations (spread) can be set in the settings. The adviser is multi currency, as it can trade at once with several triangles of currency pairs. The list of cross-
フィルタ:
レビューなし
レビューに返信
バージョン 1.46 2023.03.15
Fixed the displacement of markers in the upper location of the indicator.
Compilation 2023.
バージョン 1.45 2019.09.06
A section has been added to the input parameters with the settings for the text of signatures (parameter signatures can be entered independently).
バージョン 1.44 2019.08.01
A section with font settings (font size and name) has been added to the input parameters.
バージョン 1.43 2017.12.04
Ordered the information output in the indicator notifications.
Simplified the entry of parameters with enumerations.
Added a section with color scheme settings to the input parameters (6 parameters for adjusting all controls of the indicator).
バージョン 1.41 2017.07.28
Fixed incorrect display of signal emergence time in Push notifications.
Information about timeframes has been added to notifications (FiTF/SeTF/ThTF).
バージョン 1.3 2016.12.26
Fixed the 'possible use of uninitialized variable' error in calculation of the ThCrossMA parameter.
バージョン 1.2 2015.06.17
1. Added time period labels for each unit.
2. Changed fonts for better readability.
3. Enlarged color readings.