XFlow CHF
- インディケータ
- Maxim Kuznetsov
- バージョン: 1.1
- アップデート済み: 29 9月 2022
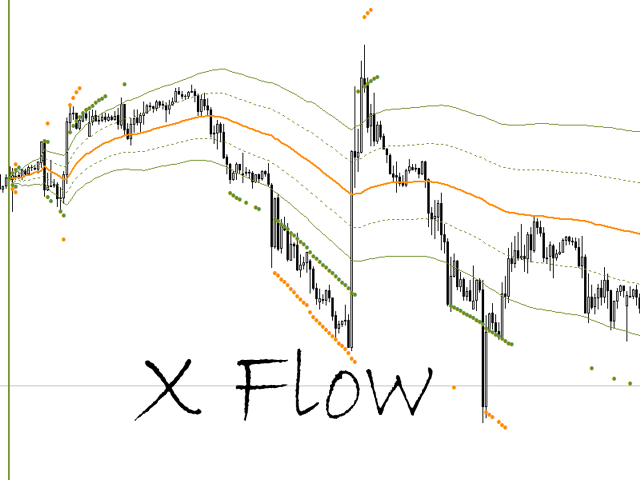
XFlow shows an expanding price channel that helps determine the trend and the moments of its reversal. It is also used when accompanying transactions to set take profit/stop loss and averages. It has practically no parameters and is very easy to use - just specify an important moment in the history for you and the indicator will calculate the price channel.
This is a demo version limited to CHF currency pairs. Designed to familiarize you with the interactive use of XFlow
DISPLAYED LINES
- ROTATE - a thick solid line. The center of the general price rotation. The price makes wide cyclical movements around the ROTATE line. The position of the price near the line itself is not stable
- UPSTREAM - the dotted line above the ROTATE - the center of the upward movement. In an uptrend, the price can move along this line for a very long time.
- UBOUND - a solid dotted line is the limit of the upward movement. In an uptrend, the price will fluctuate between ROTATE and UBOUND and move along UPSTREAM
- RESIST - the line is displayed with dots. When the price reaches the RESIST line, it precedes the trend correction.
- CRISIS is the farthest line, displayed as large dots. The price reaching this level indicates a crisis situation in the market and precedes a reversal
similar to the DOWNSTREAM,LBOUND,SUPPORT lines for a downtrend
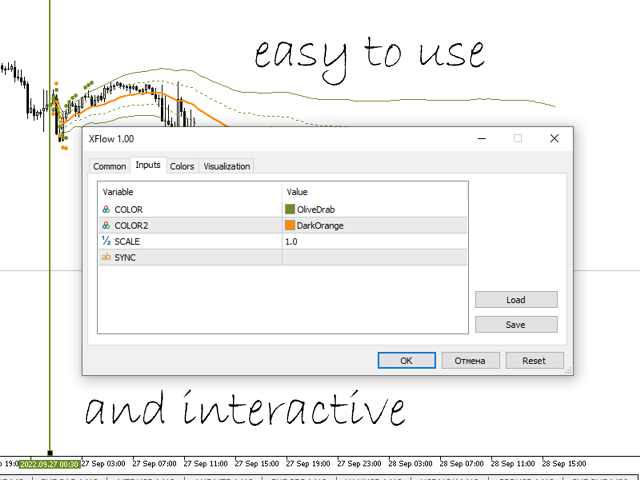
INDICATOR PARAMETERS
COLOR and COLOR2 are the colors of the displayed lines. To use multiple XFlow indicators on the same chart - set them different colors
SCALE - scaling, by default 1. You can adjust the lines by changing the scale. Scaling is also necessary when quotes are not quite correct (for example, metals and some crypto-currencies), in this case, set the scales 2,5,10, 100.
SYNC is an arbitrary name of the terminal variable. XFlow pointers on different charts but with the same SYNC move synchronously.
USAGE
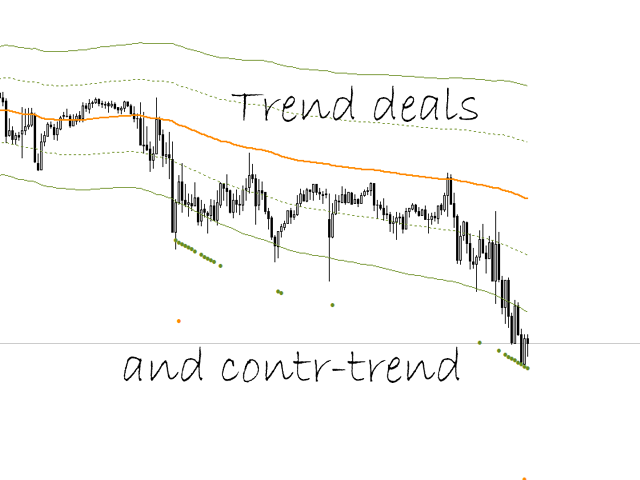
The general principle is to use the indicator lines to place trading orders and move stop loss/take profit. When SUPPORT/RESIST is reached, make counter-trend trades, and after a rollback from CRISIS, trend trades from the ROTATE line. When averaging, make sure that the average Buy price is below the ROTATE level (when Selling it is higher)
When accompanying a transaction, place the XFlow pointer to the previous trading period. For example, for short-term trading at the beginning of the previous trading day.