RubdFx Price Tracker
- インディケータ
- Namu Makwembo
- バージョン: 1.5
- アップデート済み: 20 5月 2021
- アクティベーション: 10
Big promotion!, prices are now on discount , get your copy now
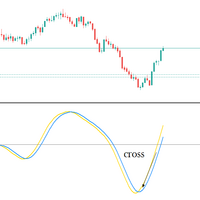
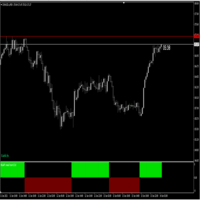
The Rubdfx Price Tracker that is used to show price price bound , the price almost never goes out of the channel and most of the time price will react when it touches the channel limits .It determines the best highest and lowest prices at which you can sell and buy respectively
-
Suitable for scalping & swing trading
-
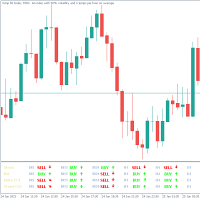
It Draws arrows that appear after a candle close , The arrows indicate bullish or bearish pressure For bearish and bullish trend respectively . When You see an arrow wait to see if the candle will close with an arrow
-
On the top right corner it shows the trend, "UP" or "DN" for uptrend and downtrend respectively
-
This indicator is part of a Trading strategy that i designed, if you want to find out about the full strategy contact us admin@rubdfx.com
Easy to implement it to an any trading strategy ,Market Nature can be used as part of confluence including Supply and Demand levels , reversal patterns etc ,The indicator will work on all timeframes
Features
- Email alerts : Yes
- Sound alerts: Yes
- Mobile alerts: Yes
- Settings Available.: Yes
- You can set indicator to Auto Adjust mode ON,This will re adjust the indicator to fit the best market structure of the current timeframe (this Auto Adjust mode feature is improved regularly, so be sure to check for updates )
- You can also set Auto Adjust mode to OFF this will enable you to change the input parameters(settings) to best fit your trading style
Preparing For Buy
-
Wait for a candle to close with a blue arrow after it has pierced the lower limit channel before placing a buy order. This shows that the price has reached its overbought level and has run its course.Stop -loss should be a few pips below the lower channel take profit when price touches the upper bound channel
-
to break even you can take profit when price is in 50% of the channel
-
A Good exit strategy would be when opposing signals starts to appear
Preparing for Sell
- Wait for a candle to close with a red arrow after it has penetrated the upper bound channel before placing a sell order. This shows that the price has reached its oversold level and is exhausted.
- Stop -loss should be a few pips below the above channel
- Take profit when price touches the lower bound channel
- To break even you can take profit when price is in 50% of the channel
- A Good exit strategy would be when opposing signals starts to appear

