SFT Trend Allow Oscillator
- インディケータ
- Artem Kuzmin
- バージョン: 1.0
- アクティベーション: 5
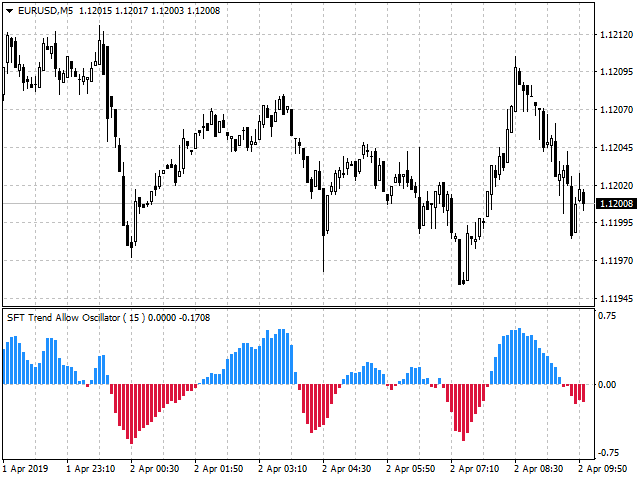
Oscillator helps determine the direction of the market
Shows the direction of the price movement and is painted in the appropriate color.
Allows you to conduct trend and counter trend trading
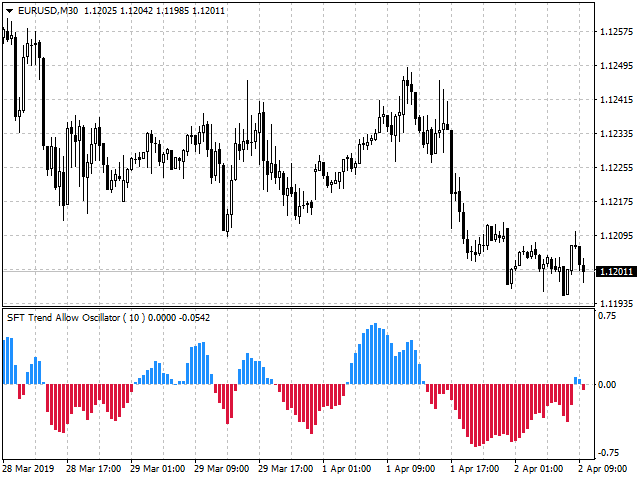
It works on all timeframes, on any currency pairs, metals and cryptocurrency
Can be used when working with binary options
Distinctive features
- Does not redraw;
- Simple and clear settings;
- It works on all timeframes and on all symbols;
- Suitable for trading currencies, metals, options and cryptocurrency (Bitcoin, Litecoin, Ethereum, etc.);
- Suitable for manual trading and for developing advisers;
For more accurate inputs and additional confirmation signals can be used in conjunction with other indicators.
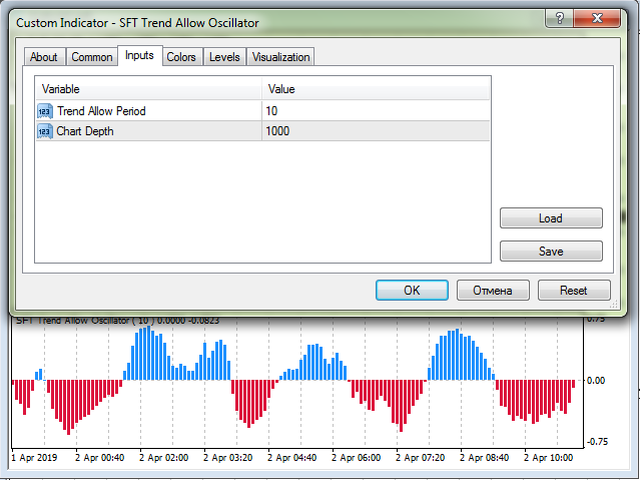
Indicator Settings
- Trend Allow Period - indicator calculation period;
- Chart Depth - the depth of the indicator on the chart;
Trading Recommendations
- When crossing the zero line and dyeing the indicator red, only a Sell or Put position is considered for opening (for options)
- When crossing the zero line and dyeing the indicator blue, only a Buy or Call position is considered for opening (for options)
- The trade direction should correspond to the trend direction on a higher timeframe.
- Well proven in collaboration with the free indicator SFT Bullet Arrow
There are other options, in the process of trading you can develop the most convenient tactics for you.
For more information and a more detailed overview of trading methods, see here:
Trading strategy with SFT Trend Allow Oscillator
We wish you a stable and profitable trade.
Thank you for using our software.
If you like it, then do a good deed and share the link with your friends.
Not to miss the release of new useful programs for trading - add as a friend: SURE FOREX TRADING


ユーザーは評価に対して何もコメントを残しませんでした