CCI Signal For MT5
- インディケータ
- Oliver Gideon Amofa Appiah
- バージョン: 1.0
- アクティベーション: 20
CCI Signal
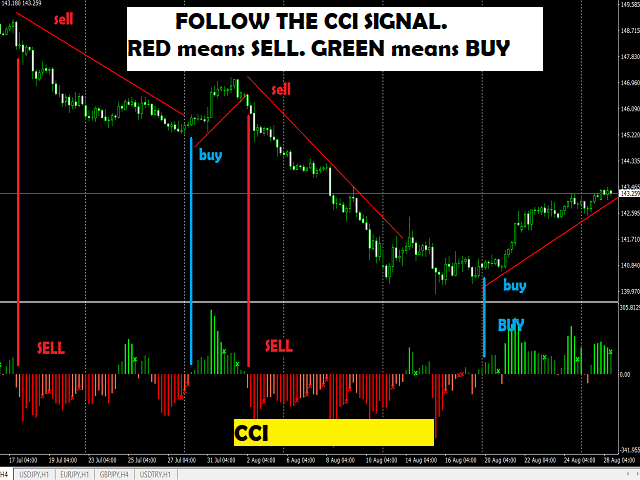
This indicator is based on a custom CCI that is colored to reflect the trend. It was created with the idea in mind: "THE TREND IS YOUR FRIEND".
It is simple and easy to use. Even a newbie can understand and use it to achieve great trade results. Simply follow the colors. RED means SELL. GREEN means BUY.
It DOES NOT repaint and can be used for Scalping, Day Trading and Swing Trading. It can be used for any time-frame and any currency pair.
CCI Signal is highly reliable and provides powerful signals.
NB:
Follow the indicator by the colors
- Bright RED signifies strong SELL
- Dull RED signifies weak SELL (so you may want to take profit or use trailing stop)
- Bright Green signifies strong BUY
- Dull GREEN signifies weak SELL (take profit or use trailing stop)
RECOMMENDATION:
In as much as this indicator can be used alone, you can combine it with my other indicator called, "FRIENDLY TREND".
The two when used together, confirms and authenticates each other to produce very powerful trade signals. They work together in that powerful manner.
The link to Friendly Trend is: https://www.mql5.com/en/market/product/31361
PLEASE CHECK MY OTHER PRODUCTS HERE:
https://www.mql5.com/en/users/4fb974a7/seller#products


Ein Indikator der gute Ergebnisse liefert. Zusammen mit Follow The Line kann man sehr gute Ergebnisse erzielen. Danke Oliver