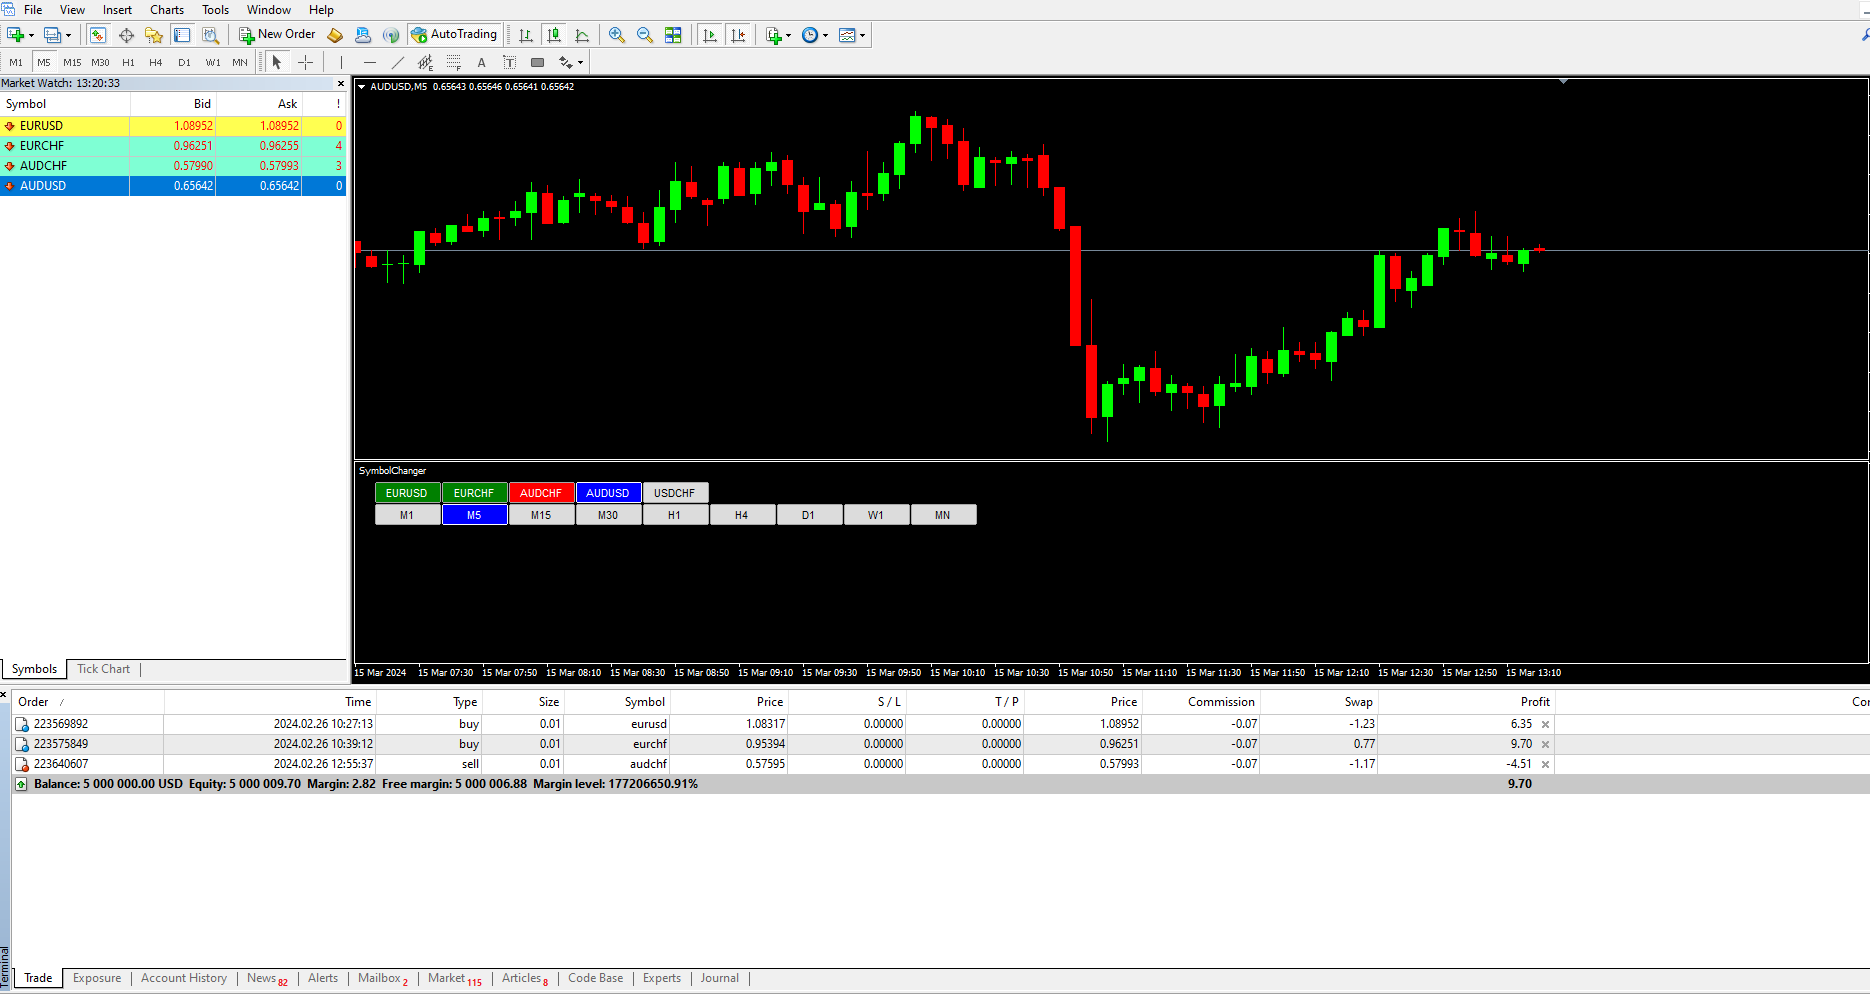
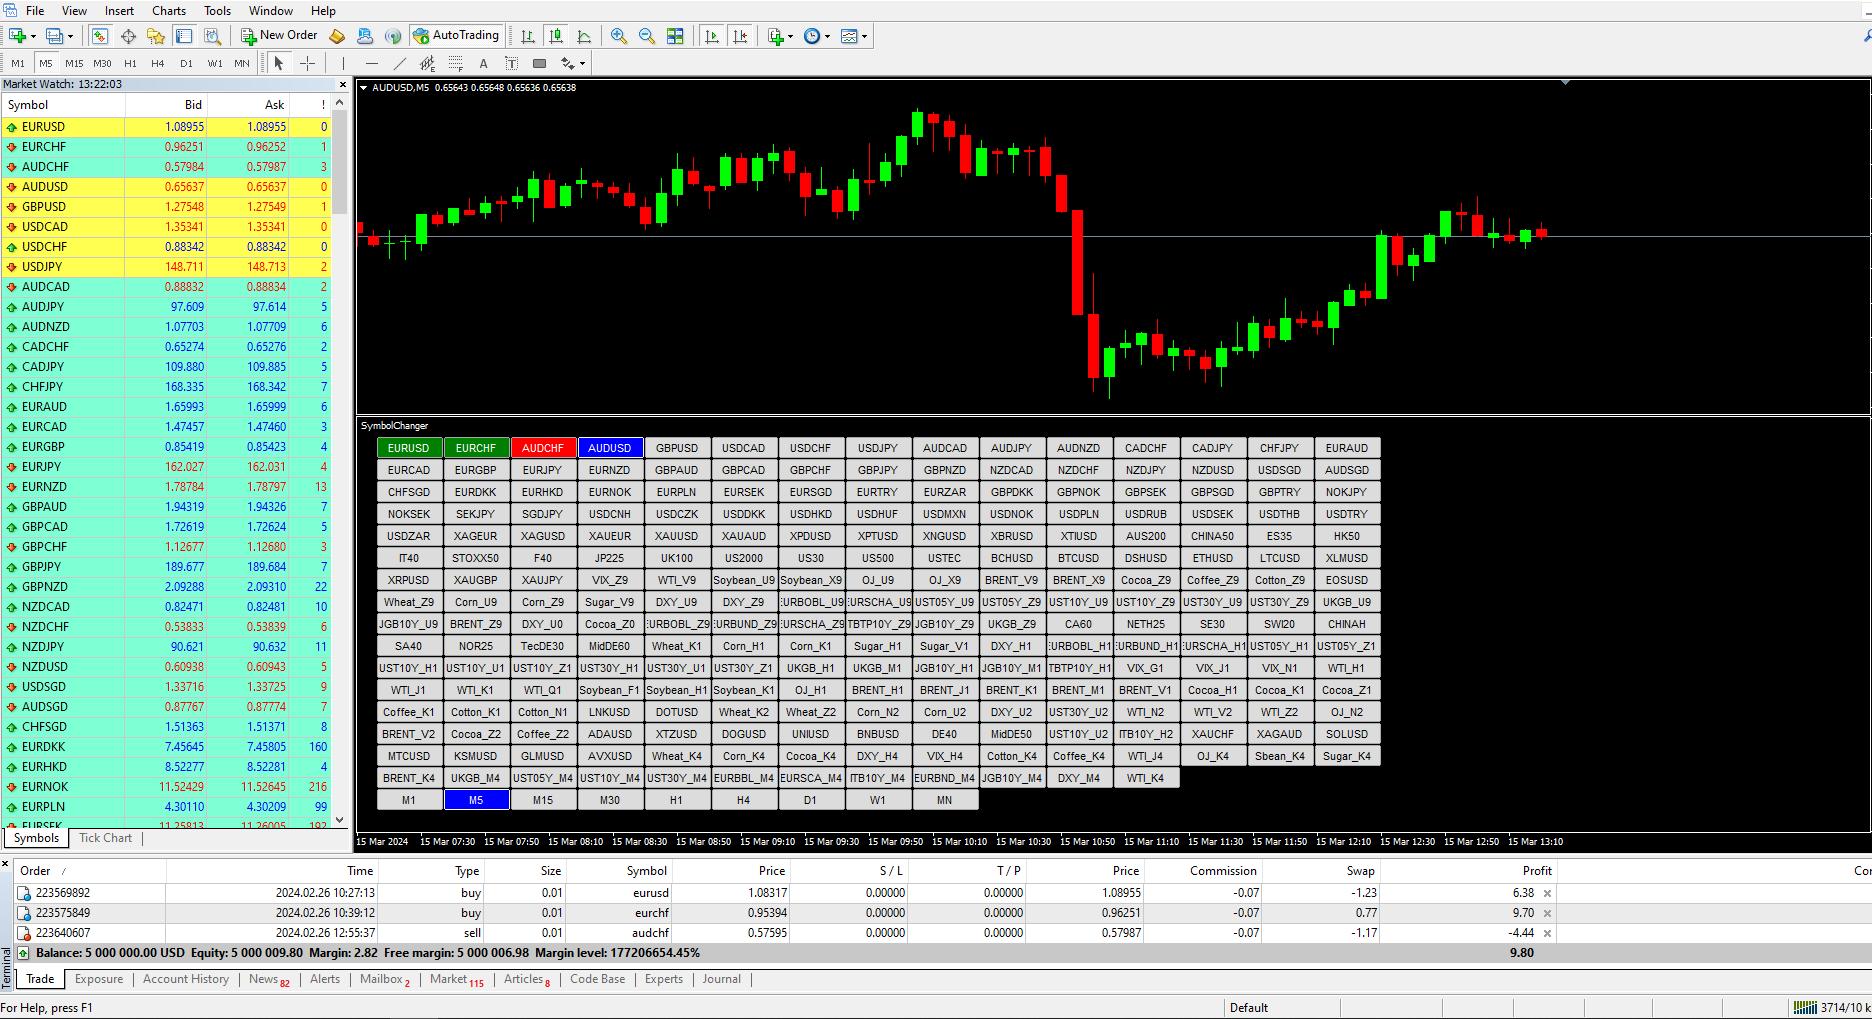
Symbol Chart Changer for MT5
** This is the short version of Symbol Changer. You might want to refer to full version with further features.
Symbol Chart Changer is an indicator/utility that offers you the option to switch between symbols and timeframes.
You can choose any symbol and timeframe on the same chart with just a few clicks. In addition, this indicator also shows the profit of the symbol through the color of the buttons.
For MT4: Symbol Chart Changer
Features
- All symbols selected in MarketWatch, that allow you to monitor your favorite instruments on the same chart.
- Works smoothly on any symbol/instrument, account type or broker.
- Show profit of opening orders of symbol through the color of the buttons. Green means positive profit, and red means negative profit.
Contact me for support: https://www.mql5.com/en/users/thucpn
Check my other products: https://www.mql5.com/en/users/thucpn/seller
If you have any ideas for this indicator or other products, please leave a comment or contact me.
If you are happy with this indicator, please rate 5 stars and leave positive comment. I would greatly appreciate your positive review.


One of the best symbol changer I've ever used. The fact that it indicates profit and loss with green and red make it stands out. Good work from the developer. Thank you.