Level Breakout Indicator
- インディケータ
- Vitalyi Belyh
- バージョン: 1.0
- アクティベーション: 7
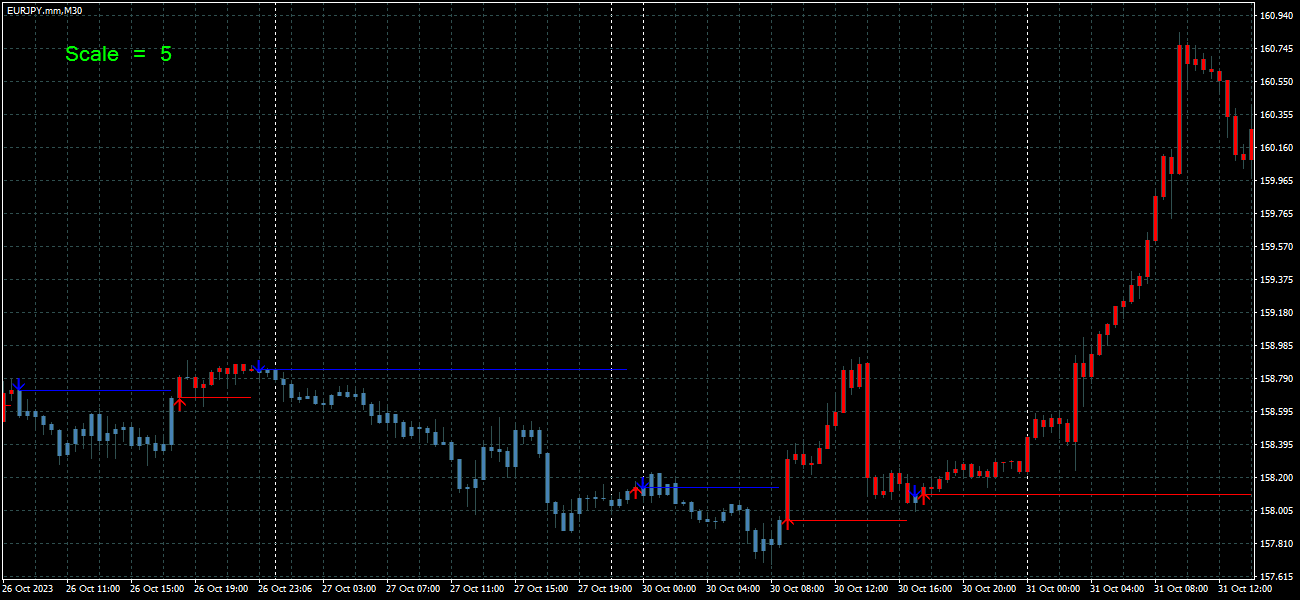
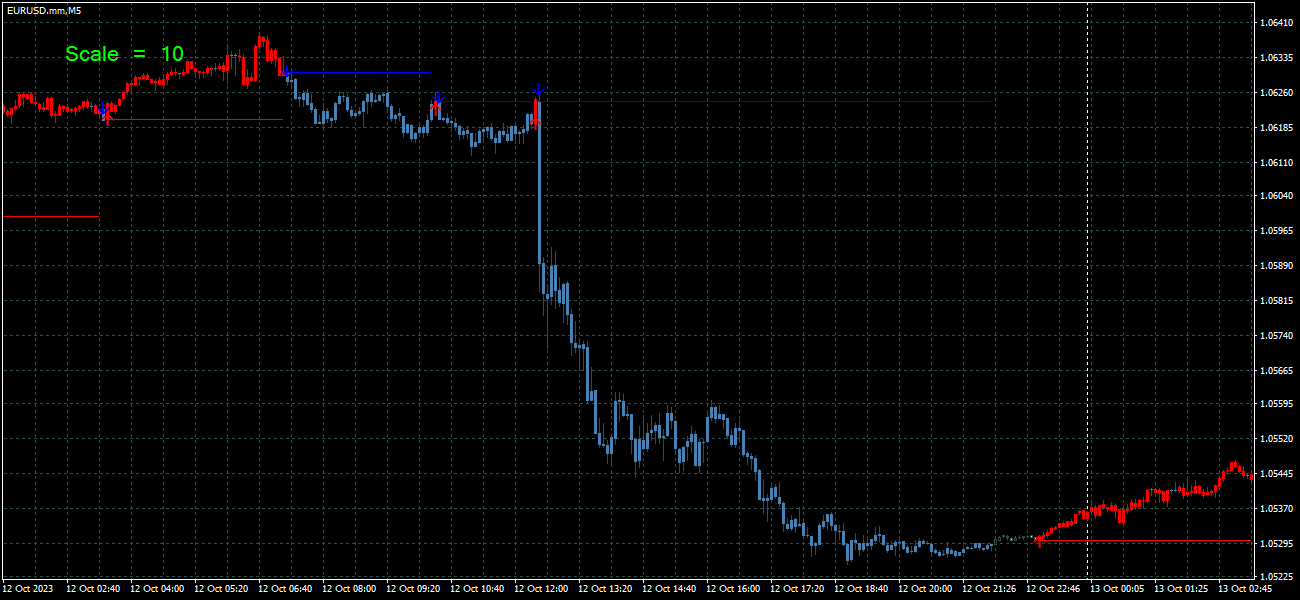
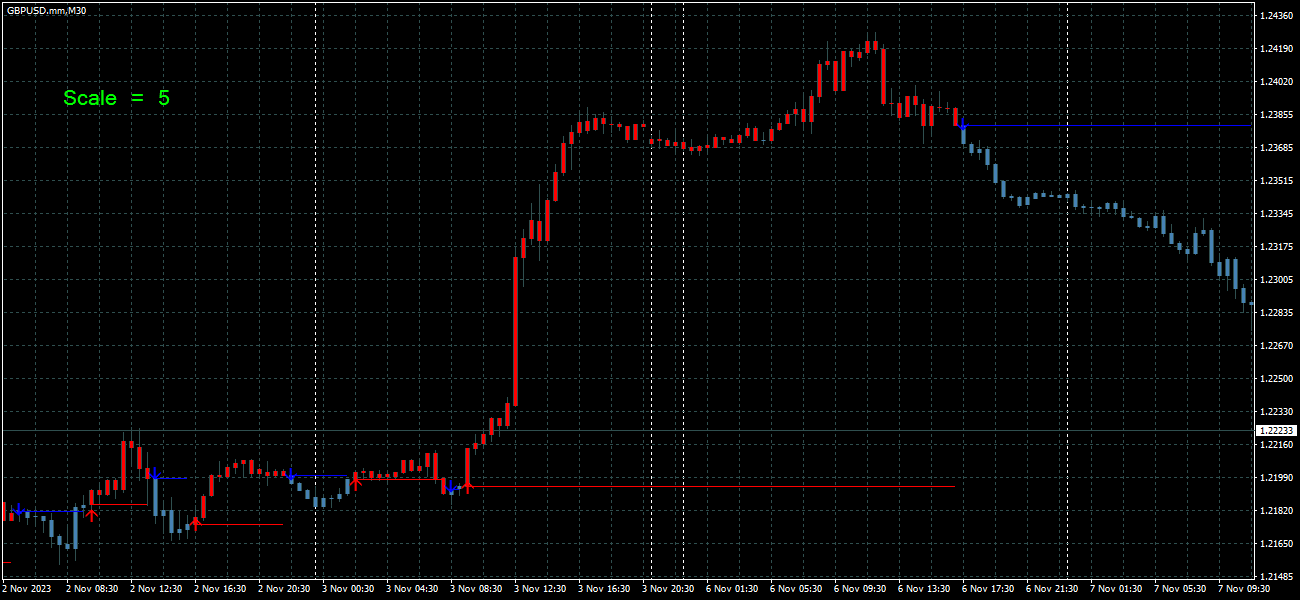
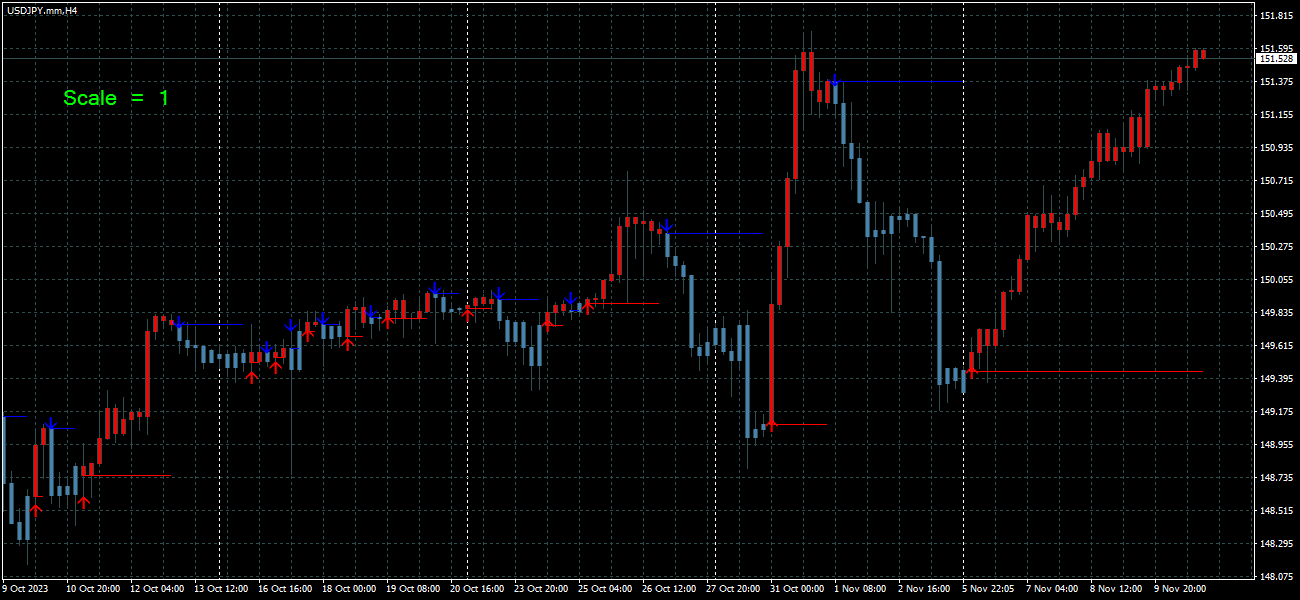
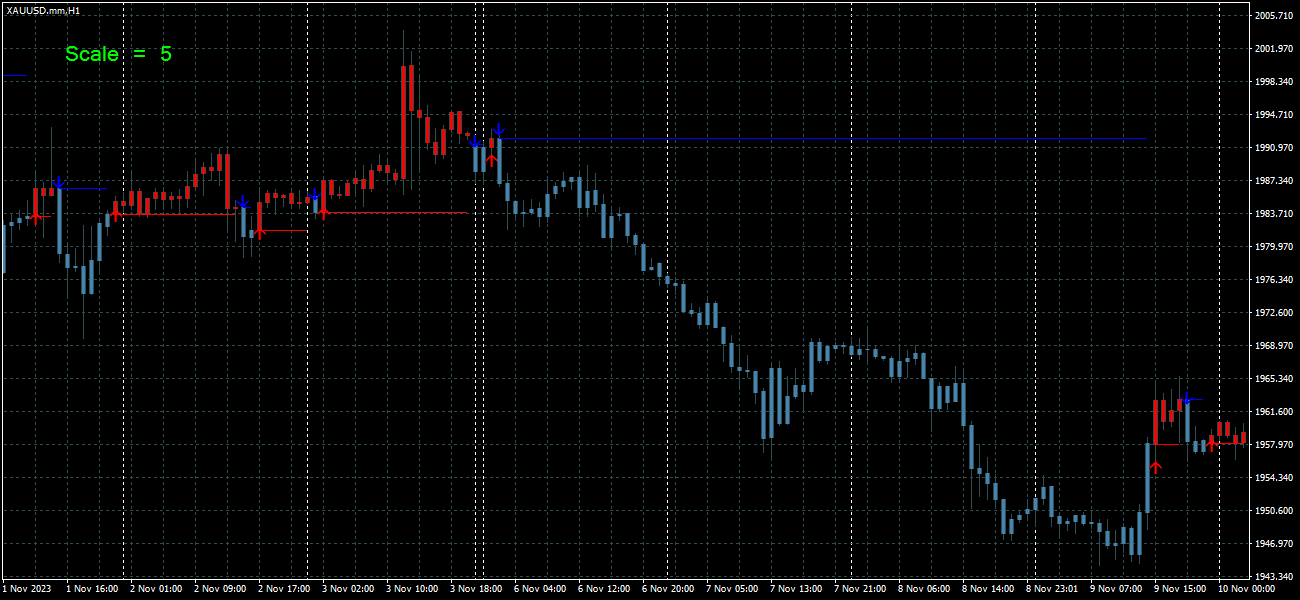
Level Breakout Indicator is a technical analysis product that works from upper and lower boundaries, which can determine the direction of the trend. Works on candle 0 without redrawing or delays.
In its work, it uses a system of different indicators, the parameters of which have already been configured and combined into a single parameter - “Scale”, which performs gradation of periods.
The indicator is easy to use, does not require any calculations, using a single parameter you need to select the desired gradation for the selected time frame and trading instrument.
When used on large time frames, use a gradation of periods of 1-5; when used on small time frames, use a gradation of periods of 5-30.
When a signal arrow appears, several types of alerts operate.
The indicator does not hide the visibility of the chart; only the body of the candle is colored.
Can be used on any trading instruments and time frames (M5 or higher recommended).