Color Chart
- インディケータ
- Miguel Antonio Rojas Martinez
- バージョン: 1.4
- アップデート済み: 17 11月 2021
- アクティベーション: 20
Visualize your charts differently in MetaTrader 5.
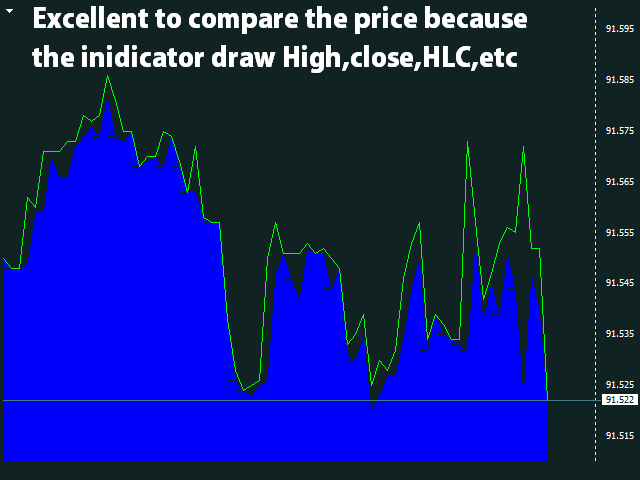
The product is good for comparing the prices, since the indicator draws High, Close, HLC, etc.
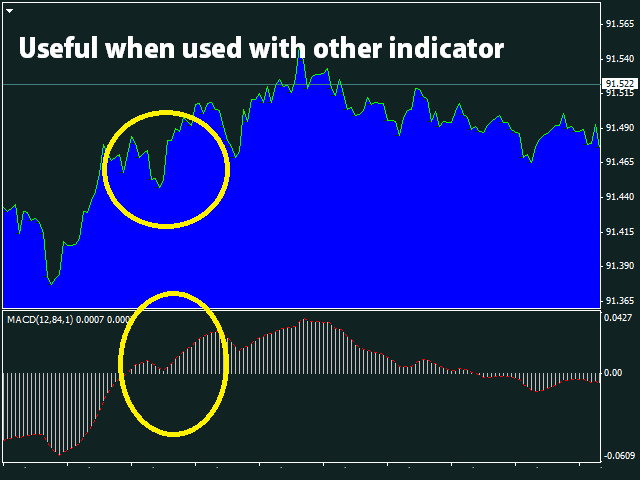
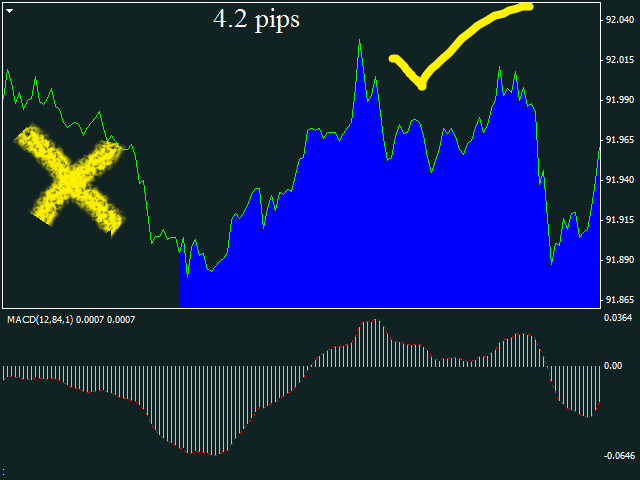
It is useful when applied with other indicators (like MACD).
This simple indicator colors the entire space below the chart allowing you to see the market with greater clarity. You will see the actual price, trends, and the market behavior.
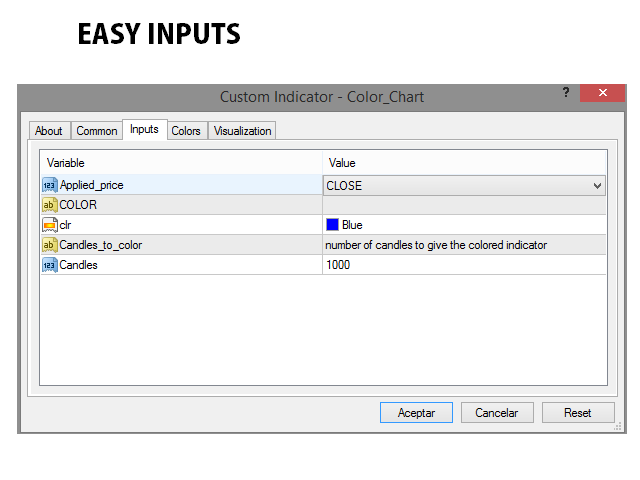
Indicator parameters:
- Applied_Price: From this option you can select the type of price you want to draw with the indicator, it can be: High, Low, Open, Close, Median, Typical, Weighted.
- Color: Select the fill color of the indicator
- Candles: Enter the number of candles that will have the Fill Effect