BTrade
★xTrend★でトレンドを一目瞭然に!
■メリット■
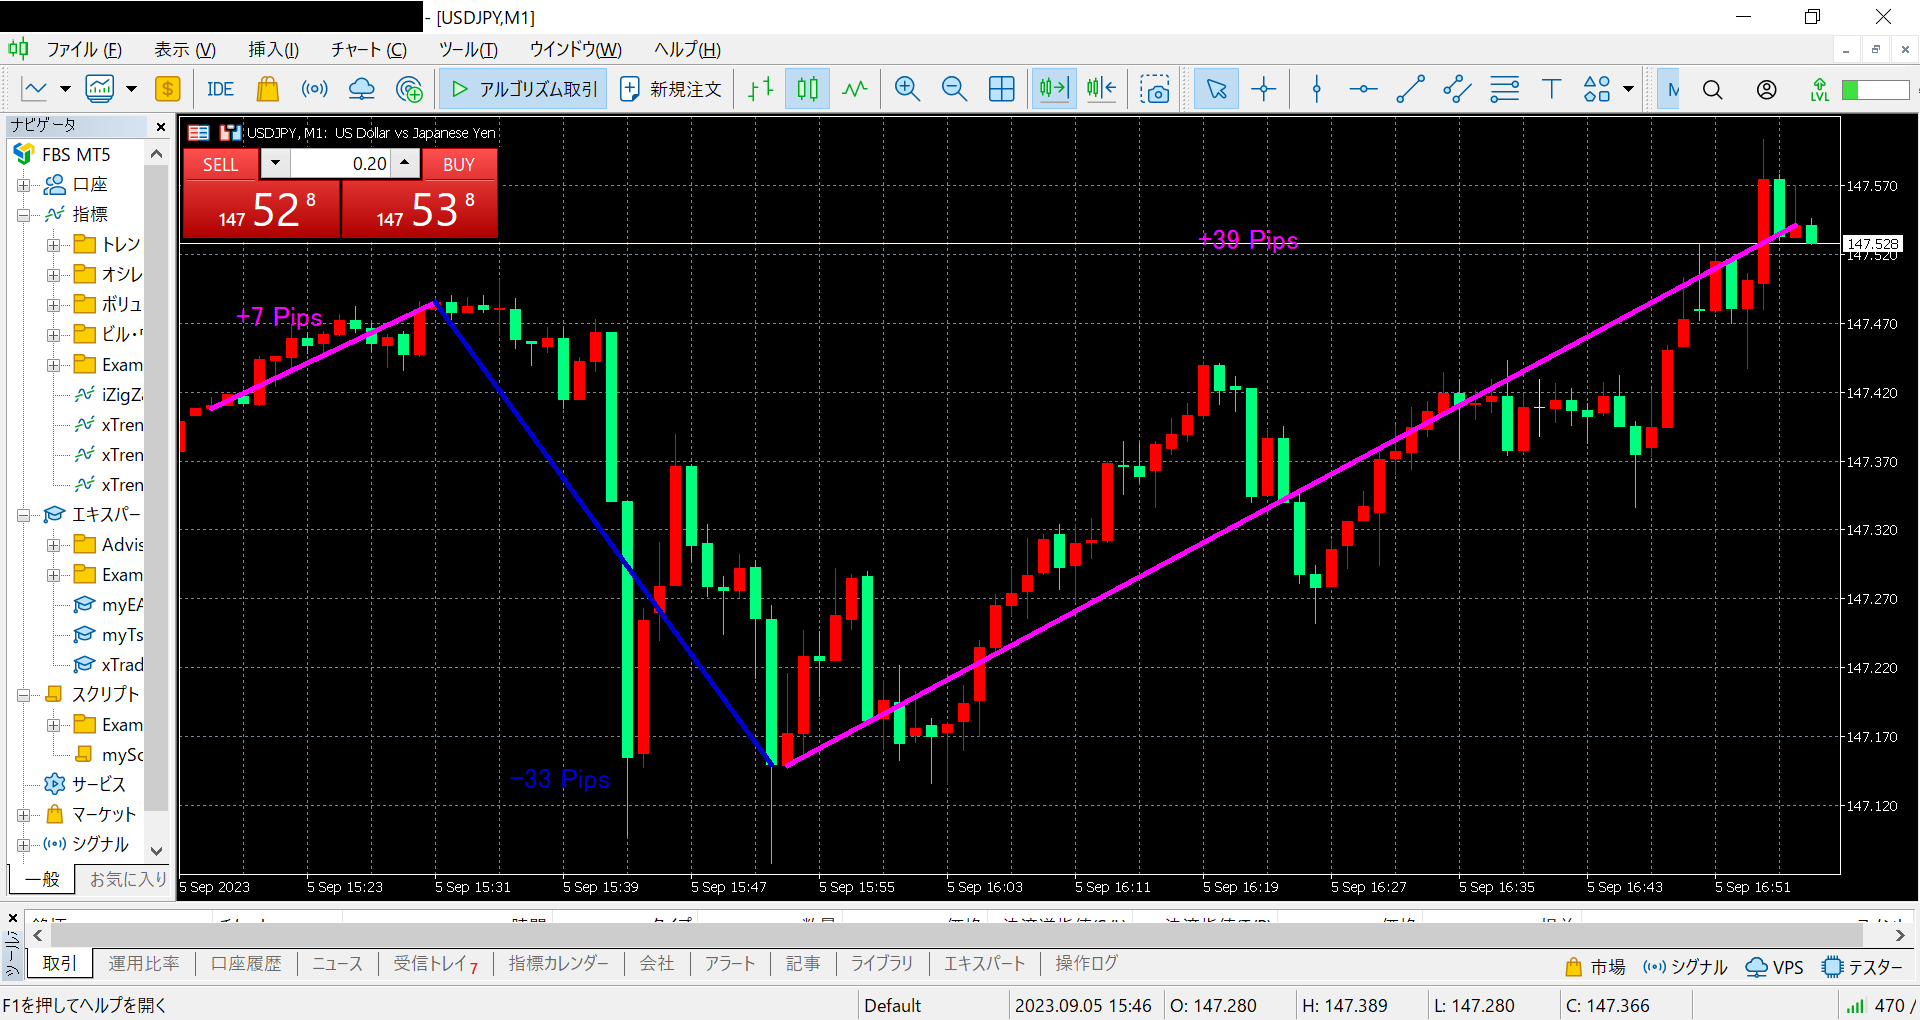
・トレンドが一目瞭然:違う色と違う太さの上昇線、下降線、レンジ線が互いに繋がって指定された過去一定期間(Barの数)から現在までの全体的なトレンドが目立ちに表示されて裁量トレードを速やかに実現できる!
・Pipsが表示可能:そのトレンド線がどれほど変化したかはPipsの表示ですぐに明らかになる。
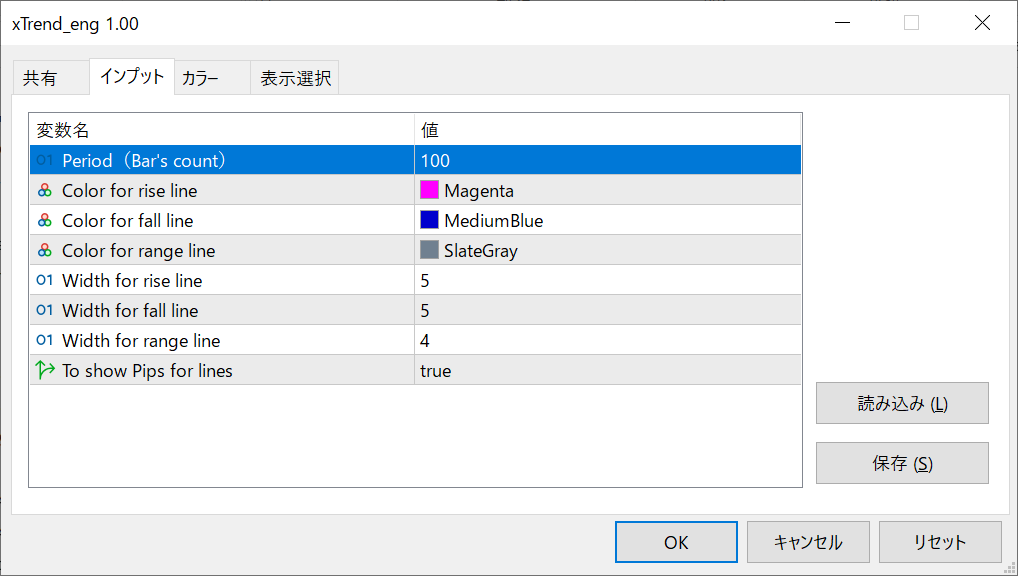
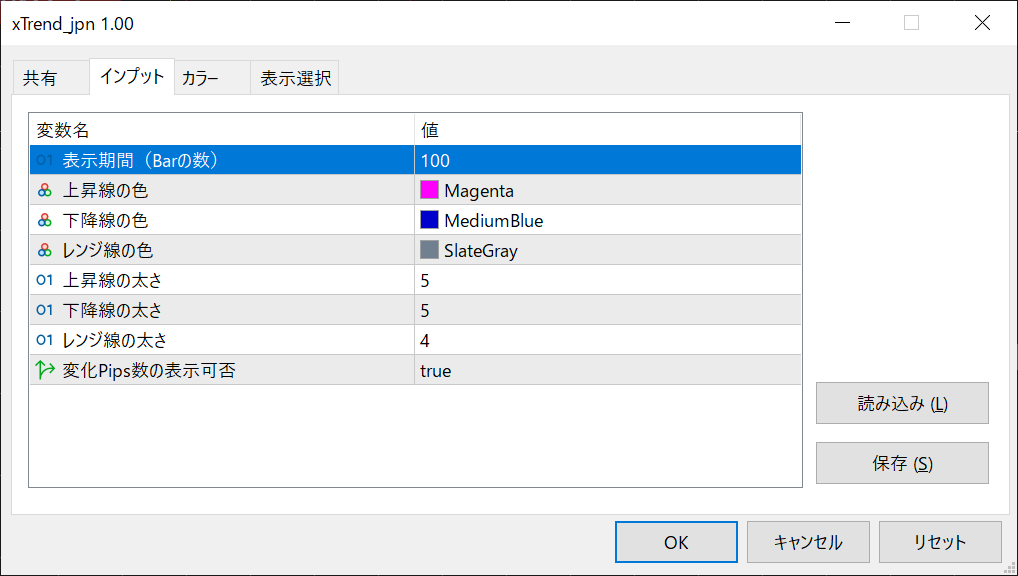
・設定簡単:表示期間、各線の色と太さ、Pips表示、それだけの設定。もデフォルトの値は最適ですので 設定なしでもぜんぜんOK!アルゴリズムに関する難しいパラメターは一切なしので全てアルゴリズムに任せて良い!
・独自のアルゴリズム:長い年月に磨いた世界唯一無二のアルゴリズム、トレンド判断の正確率抜群!
・任意の時間足に適用
・任意の銘柄に適用
・任意のFX会社 に適用
・MT4版・MT5版両方対応