• 概要
  • レビュー
  • コメント

Needles Screener


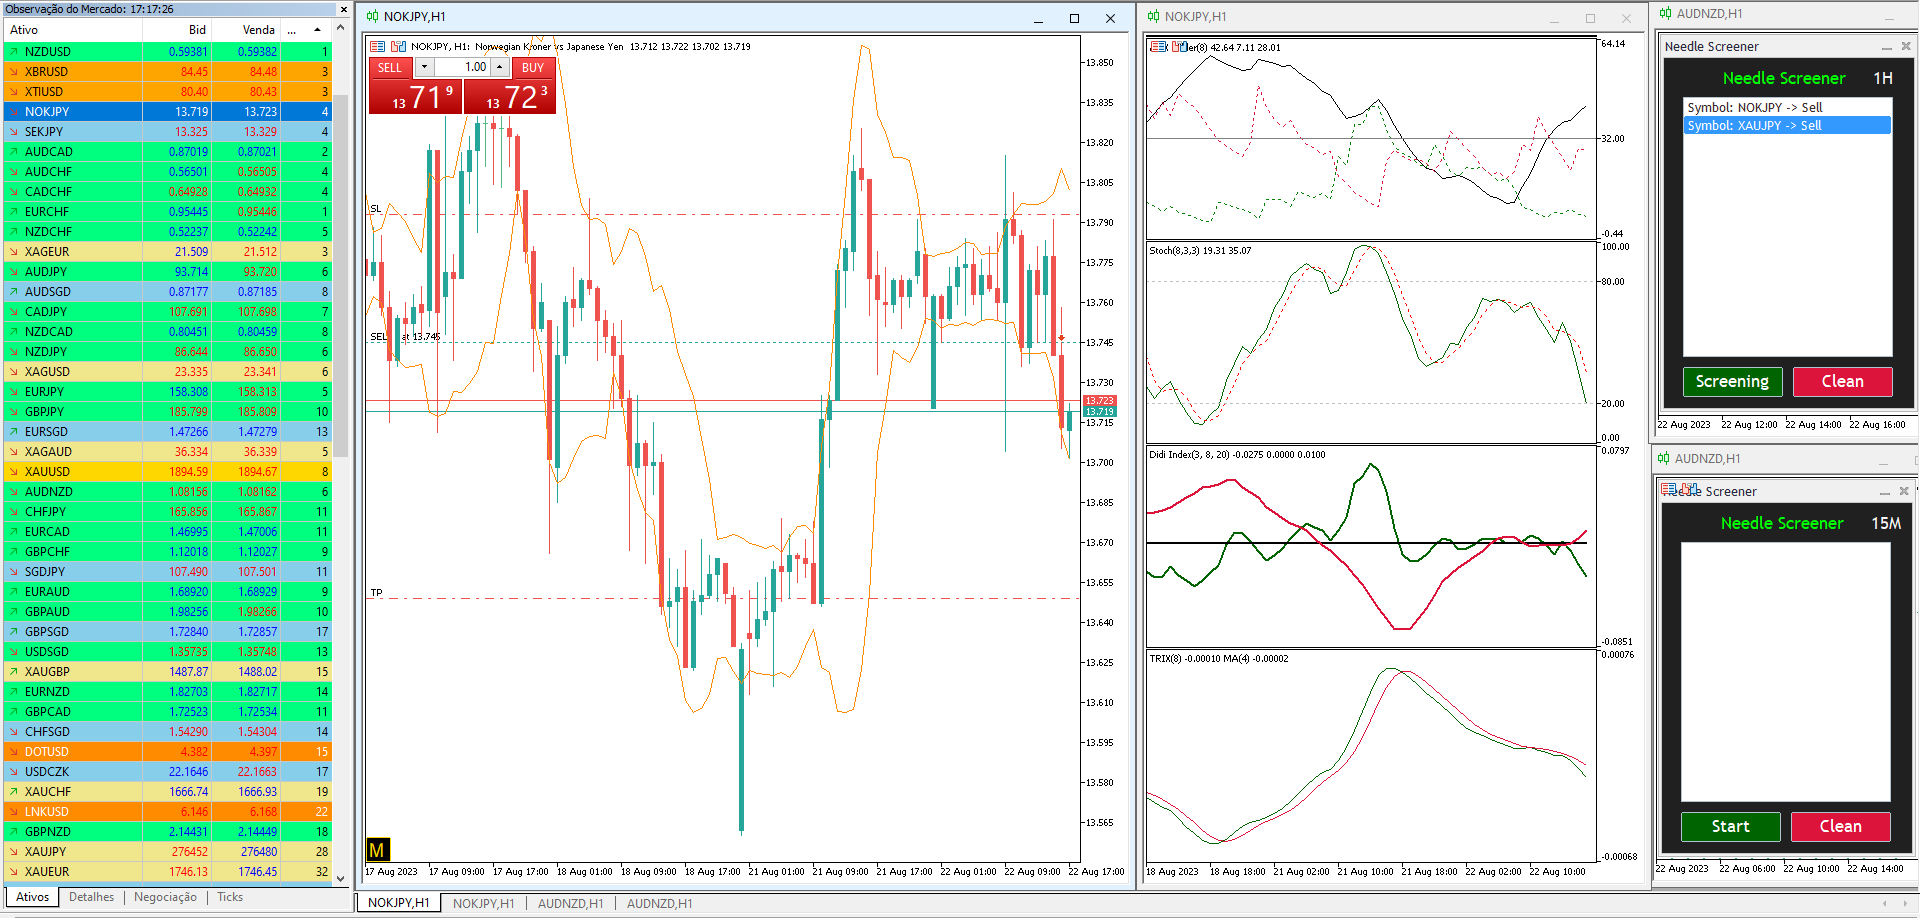
Expert Advisor that tracks assets listed in the Market Watch window by checking which assets are needled (crossing the 3, 8, and 20 moving averages) or are close to crossing. It does not track when there is no crossing of the averages. The EA allows you to choose the timeframe for analyzing the crossings. There is no maximum limit for assets or EAs running simultaneously, but a very large number can lead to system slowdown and freezing. Users should be mindful of their device's capabilities.

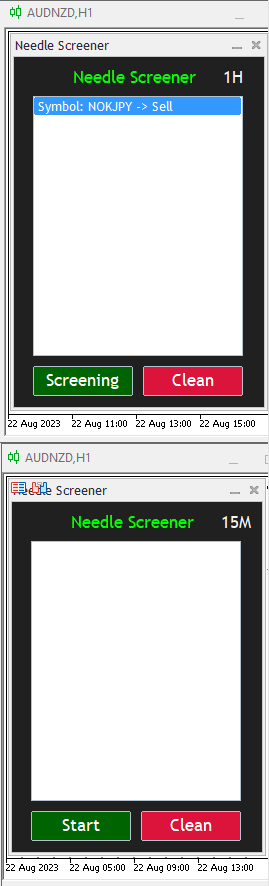
The EA displays the selected timeframe in the upper right corner. It features only two buttons that enable initiating and stopping the scanning process, as well as clearing the list.

The EA has a single initial configuration, which is the timeframe.

The assets to be analyzed should be placed in the Market Watch window.


おすすめのプロダクト
QuantumAlert RSI Navigator is a free indicator available for MT4/MT5 platforms, its work is to provide "alerts" when the market is inside "overbought and oversold" regions in the form of "buy or sell" signals. This indicator comes with many customization options mentioned in the parameter section below, user can customise these parameters as needful. Join our MQL5 group , where we share important news and updates. You are also welcome to join our private channel as well, contact me for the priva
FREE
Value Chart Candlesticks
Flavio Javier Jarabeck
4.75 (8)
The idea of a Value Chart indicator was presented in the very good book I read back in 2020 , " Dynamic Trading Indicators: Winning with Value Charts and Price Action Profile ", from the authors Mark Helweg and David Stendahl. The idea is simple and the result is pure genius: Present candlestick Price analysis in a detrended way! HOW TO READ THIS INDICATOR Look for Overbought and Oversold levels. Of course, you will need to test the settings a lot to find the "correct" one for your approach.
FREE
Donchian Pro
Paulo Henrique Faquineli Garcia
5 (2)
The Donchian Channel Channels are among the most popular tools of technical analysis, as they visually convey to the analyst the limits within which most price movement tends to occur. Channel users know that valuable information can be obtained at any time, whether prices are in the central region of a band or close to one of the border lines. One of the best known techniques to explore these concepts is Bollinger Bands. However, John Bollinger was not the only one to research the applicatio
FREE
Are you tired of drawing trendlines every time you're analyzing charts? Or perhaps you would like more consistency in your technical analysis. Then this is for you. This indicator will draw trend lines automatically when dropped on a chart. How it works Works similar to standard deviation channel found on mt4 and mt5. It has 2 parameters: 1. Starting Bar 2. Number of bars for calculation The   starting bar   is the bar which drawing of the trend lines will begin, while the   number of bars for c
FREE
QuantumAlert Stoch Navigator is a free indicator available for MT4/MT5 platforms, its work is to provide "alerts" when the market is inside "overbought and oversold" regions in the form of "buy or sell" signals. This indicator comes with many customization options mentioned in the parameter section below, user can customise these parameters as needful. Join our   MQL5 group , where we share important news and updates. You are also welcome to join our private channel as well, contact me for the p
FREE
Free automatic Fibonacci is an indicator that automatically plots a Fibonacci retracement based on the number of bars you select on the BarsToScan setting in the indicator. The Fibonacci is automatically updated in real time as new highest and lowest values appears amongst the selected bars. You can select which level values to be displayed in the indicator settings. You can also select the color of the levels thus enabling the trader to be able to attach the indicator several times with differe
FREE
Weis Waves
Flavio Javier Jarabeck
2.76 (17)
The original author is David Weis, an expert in the Wyckoff Method. The Weis Wave is a modern adaptation of the 1930's Wyckoff Method, another expert in Tape Reading techniques and Chart Analysis. Weis Waves takes market volume and stacks it into waves according to price conditions giving the trader valuable insights about the market conditions. If you want to learn more about this subject you can find tons of videos in YouTube. Just look for "The Wickoff Method", "Weis Wave" and "Volume Spread
FREE
The idea of the system is to indentify the reversal patterns using the calculation of the composite candle. The reversal patterns is similar to the "Hammer" and "Hanging Man" patterns in Japanese candlestick analysis. But it uses the composite candle instead the single candle and doesn't need the small body of the composite candle to confirm the reversal. Input parameters: Range - maximal number of bars, used in the calculation of the composite candle. Minimum - minimal size of the composite can
FREE
ET1 for MT5 is new and completely free!! ET1 for MT5 v4.20 Updated!! Now use on XAUUSD(Gold) !!  The success rate is more than 75%   !!! important update: Merge ET9 's breakout strategy Warning!! You can use ET1 completely free, but we do not guarantee ET1 stability, It is recommended that the more powerful ET9 for MT5 version includes the ET1 strategy and guarantees complete and stable returns. The Best Expert Advisor  on   XAUUSD   any timeframes  ET9  for MT5 Updated v4.70 !!  https:/
FREE
Tabajara V5
Flavio Javier Jarabeck
4.84 (32)
Metatrader 5 version of the famous Andre Machado's Tabajara indicator. If you don't know Andre Machado's Technical Analysis work you don't need this indicator... For those who need it and for those several friend traders who asked this porting from other platforms, here it is... FEATURES 8-period Moving Average 20-period Moving Average 50-period Moving Average 200-period Moving Average Colored candles according to the inflexion of the 20-period MA SETTINGS You can change the Period of all M
FREE
Cybertrade Keltner Channels - MT5 Created by Chester Keltner, this is a volatility indicator used by technical analysis. It is possible to follow the trend of financial asset prices and generate support and resistance patterns. In addition, envelopes are a way of tracking volatility in order to identify opportunities to buy and sell these assets. It works on periods longer than the period visible on the chart. All values ​​are available in the form of buffers to simplify possible automations.
FREE
Spike Catch Pro 22:03 release updates Advanced engine for searching trade entries in all Boom and Crash pairs (300,500 and 1000) Programmed strategies improvements Mx_Spikes (to combine Mxd,Mxc and Mxe), Tx_Spikes,   RegularSpikes,   Litho_System,   Dx_System,   Md_System,   MaCross,   Omx_Entry(OP),  Atx1_Spikes(OP),   Oxc_Retracement (AT),M_PullBack(AT) we have added an arrow on strategy identification, this will help also in the visual manual backtesting of the included strategies and see h
FREE
Follow The Line MT5
Oliver Gideon Amofa Appiah
4.5 (28)
This indicator obeys the popular maxim that: "THE TREND IS YOUR FRIEND" It paints a GREEN line for BUY and also paints a RED line for SELL. (you can change the colors). It gives alarms and alerts of all kinds. IT DOES NOT REPAINT and can be used for all currency pairs and timeframes. Yes, as easy and simple as that. Even a newbie can use it to make great and reliable trades. NB: For best results, get my other premium indicators for more powerful and reliable signals. Get them here: https://www.m
FREE
Wave Box Market Frenquency
Jean Jacques Huve Ribeiro
4.75 (4)
Totally linked to the result of a movement and the duration he had. Its height records how many ticks the asset walked during a given movement, its width shows us the duration that movement had. Its configuration must be in line with the Weis Wave Indicator configuration to observe the movement force and can indicate a possible accumulation or distribution of the movement;
FREE
ADX consolidado
OTAVIO AGUIAR CAMPOS Aguiar
5 (3)
Mostra a média móvel quando ADX > 20 e pinta de verde ou vermelho quando os valores de ADX estão subindo indicando tendência. Quando o ADX é menor que 20 indica movimento lateral consolidado. O indicador não define pontos de entrada, somente mostra a média colorida quando a tendência está se fortalecendo. Faz parte do grupo de indicadores do Indicador Tavim.
FREE
Supports And Resistances Lines
Francisco Gomes Da Silva
4.74 (34)
サポートゾーンとレジスタンスゾーンのインジケーターMT5 このインジケーターは、トップとボトムを自動的に識別する方法を知っています。 このサポートとレジスタンスインジケーターは、トップとボトムに基づいてサポートラインとレジスタンスラインを作成します。 サポートラインとレジスタンスラインの作り方。 これは、自動サポートラインとレジスタンスラインを作成するためのインジケーターです。 インジケーターを使用してサポートレベルを見つける方法。 このインジケーターはトップとボトムを自動的に検出します。 インジケーターは、「ZigZag」が自動的に底を作成するか、新しい底を前の底より低くするたびにサポートラインを自動的に作成するため、インジケーターは画面に自動サポートラインを自動的に描画します。 レジスタンスラインの作成方法。 インジケーターは、「ZigZag」が新しいトップまたは前のトップよりも高いトップを作成するたびに、サポートレベルを作成するのと同じ方法で抵抗線を自動的に作成します。したがって、インジケーターは新しい抵抗を自動的に作成します。トップレベルとボトムレベルがどこにあるかを心配する必
FREE
Donchian Channel is an indicator created by Richard Donchian. It is formed by taking the highest high and the lowest low of the last specified period in candles. The area between high and low is the channel for the chosen period. Its configuration is simple. It is possible to have the average between the upper and lower lines, plus you have alerts when price hits one side. If you have any questions or find any bugs, please contact me. Enjoy!
FREE
Shows min and max of last M5 Candle. Can be used to trade breakouts of last M5 candle.  The M5 Candle Breakout Strategy avoids to stay too long in a sindways phase. See documentation on  @swisstrader3713, where you can follow my live trading. The only parameters are the color of the lines defining the M5 stretch. Best use the indicator in M1 timeframe. The M5 Breakout Strategy has helped me to reduce overtrading.
FREE
FRB Trader - Our mission is to provide the best support to customers through conted and tools so that they can achieve the expected results FRB Support and Resistance - Indicator places lines on the chart to show Support and Resistance regions. - You can choose the timeframe you want to calculate, as well as the colors of the lines. - Algorithm calculates the points where the strengths of the asset are considered and are extremely important for decision making.
FREE
MIDAS Super VWAP
Flavio Javier Jarabeck
4.44 (9)
Imagine VWAP, MVWAP and MIDAS in one place... Well, you found it! Now you can track the movement of Big Players in various ways, as they in general pursue the benchmarks related to this measuring, gauging if they had good execution or poor execution on their orders. Traders and analysts use the VWAP to eliminate the noise that occurs throughout the day, so they can measure what prices buyers and sellers are really trading. VWAP gives traders insight into how a stock trades for that day and deter
FREE
Indicador Regressão Linear – Par de Ativos - INTRADAY Indicador é um oscilador que faz o plot do Resíduo resultado da regressão linear entre os dois ativos inseridos como input do indicador, representado pela fórmula: Y = aX + b + R Onde Y é o valor do ativo dependente, X é o valor do ativo independente, a é a inclinação da reta entre os dois ativos, b é a intersecção da reta e R é o resíduo. O resíduo representa a quantidade da variabilidade que Y que o modelo ajustado não consegue explicar. E
FREE
VWAP Simple
Deibson Carvalho
4.22 (27)
The Volume Weighted Average Price is similar to a moving average, except volume is included to weight the average price over a period.    Volume-Weighted Average Price [VWAP] is a dynamic, weighted average designed to more accurately reflect  a security’s true average price over a given period . Mathematically, VWAP is the summation of money (i.e., Volume x Price) transacted divided by the total volume over any time horizon, typically from market open to market close. VWAP reflects the capital
FREE
The Scaled Awesome Oscillator (SAO) represents a refined adaptation of the Awesome Oscillator, aimed at establishing consistent benchmarks for identifying market edges. Unlike the standard Awesome Oscillator, which records the variation in pips across different commodities, the only unchanging reference point is the zero line. This limitation hampers investors and traders from pinpointing specific levels for trend reversals or continuations using the traditional Awesome Indicator, a creation of
FREE
(Google 翻訳) この指標は、 Worden Brothers, Inc によって開発されたオリジナルの「 タイム セグメント ボリューム (TSV) 」に基づいています。 ただし、これにさらにいくつかの機能を追加しました。 元の終値だけを使用する代わりに、適用する価格を選択できます。 実際の範囲に基づく疑似ボリュームを含む、またはボリュームの重み付けをまったく使用しない、使用するボリュームの重み付けを選択することもできます。 (Original text) This indicator is based on the original “ Time Segmented Volume (TSV) ” developed by Worden Brothers, Inc . However, I added an extra few features to this one. One can choose the price to be applied, instead of only having the default close price used by the origin
FREE
Expert description Algorithm optimized for Nasdaq trading The Expert Advisor is based on the constant maintenance of long positions with daily profit taking, if there is any, and temporary interruption of work during the implementation of prolonged corrections The Expert Advisor's trading principle is based on the historical volatility of the traded asset. The values of the Correction Size (InpMaxMinusForMarginCallShort) and Maximum Fall (InpMaxMinusForMarginCallLong) are set manually. Reco
FREE
これはThe News Filterを使用するために必要なスクリプトです。このスクリプトはフィルタリングしたいチャートを選択し、ニュース・フィルタ・プログラムに入力を送信します。すべての入力はそのチャートに固有なので、チャートごとに異なる入力を柔軟に設定できます。ニュース・フィルター(無料デモ)へのリンクは以下にあります: ニュースフィルターガイド+ダウンロードリンク ニュース選択 ニュースソースは、Forex Factoryの経済カレンダーから取得されます。 USD、EUR、GBP、JPY、AUD、CAD、CHF、NZD、CNYなど、任意の通貨数に基づいて選択できます。 Non-Farm(NFP)、FOMC、CPIなどのキーワード識別に基づいて選択することもできます。 影響レベルによってフィルタリングするニュースを選択することができ、低、中、高の影響範囲から選択できます。 自動モードでは、チャートに関連するニュースのみが選択されます。 ニュースソースは、最新のニュースデータを確実にするために、自動的に1時間ごとに更新されます。 各ニュースの影響レベルごとに別々の入力があり、ニュ
FREE
Aggression Volume
Flavio Javier Jarabeck
4.14 (14)
Aggression Volume Indicator is the kind of indicator that is rarely found in the MQL5 community because it is not based on the standard Volume data provided by the Metatrader 5 platform. It requires the scrutiny of all traffic Ticks requested on the platform... That said, Aggression Volume indicator requests all Tick Data from your Broker and processes it to build a very special version of a Volume Indicator, where Buyers and Sellers aggressions are plotted in a form of Histogram. Additionally,
FREE
SUPERTREND; It is a trend following indicator based on the SuperTrend ATR created by Olivier Seban. It can be used to detect changes in trend direction and locate stops. When the price falls below the indicator curve, it turns red and indicates a downtrend. Conversely, when the price moves above the curve, the indicator turns green, indicating an uptrend. Like other indicators, it works well on SuperTrend when used in conjunction with other indicators such as MACD, parabolik SAR, Bollinger Band
FREE
Coral trend is   a trend-following indicator that is widely popular among FOREX traders . It is usually used as a confluence with other indicators. It uses combinations of moving averages with complex smoothing formulas! It has two configurable parameters: Coefficient   - smoothing ratio (*) Applied price Calculation: Coral = (-0.064) * B6 + 0.672 * B5 - 2.352 * B4 + 2.744 * B3
FREE
MACD Colored ZeroLag
Farzin Sadeghi Bonjar
4.25 (4)
It is the MQL5 version of zero lag MACD that was available for MT4 here: https://www.mql5.com/en/code/9993 Also there was a colored version of it here but it had some problems: https://www.mql5.com/en/code/8703 I fixed the MT4 version which has 95 lines of code. It took me 5 days to write the MT5 version.(reading the logs and testing multiple times and finding out the difference of MT5 and MT4!) My first MQL5 version of this indicator had 400 lines of code but I optimized my own code again and n
FREE
このプロダクトを購入した人は以下も購入しています
Trade Assistant MT5
Evgeniy Kravchenko
4.38 (164)
取引 ごとのリスクの 計算、新規注文 の 簡単 な 設置、部分的 な 決済機能 を 持 つ 注文管理、 7 種類 のトレーリングストップなど 、便利 な 機能 を 備 えています 。 注意、アプリケーションはストラテジーテスターでは機能しません。 説明ページからデモ版をダウンロードできます  Manual, Description, Download demo ライン機能 チャート上にオープニングライン、ストップロス、テイクプロフィットを表示します。この機能により、新規注文を簡単に設定することができ、注文を出す前にその特徴を確認することができます。   リスク計算 リスク計算機能は、設定されたリスクとストップロス注文のサイズを考慮して、新規注文のボリュームを計算します。ストップロスの大きさを自由に設定できると同時に、設定したリスクを守ることができます。 Lot calc ボタン - リスク 計算 を 有効 / 無効 にします 。 Risk フィールドでは 、必要 なリスクの 値 を 0 から 100 までのパーセンテージまたは 預金通貨 で 設定 します 。 設定」 タブで 、
価格が一瞬で変わる可能性のある市場では、注文はできるだけ簡単にすべきだと思いますか? Metatraderでは、注文を開くたびに、開始価格を入力し、損失を止めて利益を得るウィンドウと、取引サイズを開く必要があります。金融市場の取引では、初期預金を維持し、それを増やすために資本管理が不可欠です。それで、あなたが注文をしたいとき、あなたはおそらくあなたがどれくらいの大きさの取引を開くべきか疑問に思いますか?この単一の取引であなたの預金の何パーセントを危険にさらすべきですか?この取引からどれだけの利益を得ることができますか?また、リスクに対する利益の比率はどのくらいですか?トレードサイズを設定する前に、トレードサイズがどうあるべきかという質問に対する答えを得るために必要な計算を行います。 これらすべてを自動的に行うツールがあると想像してみてください。チャートを開き、市場分析を行い、エントリーポイント、ディフェンスポイント(ストップロス)、ターゲット(テイクプロフィット)を水平線でマークし、最後にリスクのレベルを定義します。利用可能な資本の%として、このトランザクションで負担することができ、こ
TradePanel MT5
Alfiya Fazylova
4.85 (114)
Trade Panel は、多機能の取引アシスタントです。 このアプリケーションには手動取引用の 50 以上の機能が含まれており、ほとんどの取引アクションを自動化できます。 購入する前に、デモ アカウントでデモ バージョンをテストできます。 デモは こちら から。 詳しい手順は こちら をご覧ください。 取引。 ワンクリックで基本的な取引操作を実行できます。 未決の注文とポジションをオープンする 注文のグリッドを開く 未決の注文とポジションを決済する ポジションの反転(買いを閉じて売りをオープンする、または売りを閉じて買いをオープンする) ポジションをロックする(反対のポジションをオープンすることで、売りポジションと買いポジションの量を等しくします) すべてのポジションを部分的に決済します。 すべてのポジションのテイクプロフィットやストップロスを共通のレベルに設定します。 すべてのポジションのストップロスを損益分岐点レベルに設定します。 注文とポジションをオープンする際に、次のことが可能になります。 確立されたリスクに応じて取引量の自動計算を使用します。 ワンクリックで複数の注文を開き
Local Trade Copier EA MT5
Juvenille Emperor Limited
4.99 (68)
Local Trade Copier EA MT5 による、驚くほど高速な取引コピーを体験してください。1分で簡単にセットアップできるこの取引コピー機は、同じWindowsコンピュータまたはWindows VPS上の複数のMetaTrader端末間で取引をコピーすることができ、0.5秒未満の高速コピースピードを実現します。 初心者であろうとプロのトレーダーであろうと、 Local Trade Copier EA MT5 には、あなたの特定のニーズに合わせてカスタマイズするための幅広いオプションが用意されています。これは、利益の可能性を高めたい人にとって究極のソリューションです。 今すぐ試してみて、これが市場で最も速くて簡単なトレードコピー機である理由を理解してください。 ヒント: デモアカウントで Local Trade Copier EA MT5 デモバージョンをダウンロードして試すことができます: ここ ダウンロードした無料のデモ ファイルを MT5 >> ファイル >> データ フォルダを開く >> MQL5 >> Experts フォルダに貼り付けて、ターミナルを再起動し
The product will copy all telegram signal to MT5 ( which you are member) , also it can work as remote copier.  Easy to set up, copy order instant, can work with almost signal formats, image signal,  s upport to translate other language to English Work with all type of channel or group, even channel have "Restrict Saving Content", work with  multi channel, multi MT5 Work as remote copier: with signal have ticket number, it will copy exactly via ticket number. Support to backtest signal. How to s
Tired of complex order placement and manual calculations? Trade Dashboard is your solution. With its user-friendly interface, placing orders becomes effortless, by a single click, you can open trades, set stop loss and take profit levels, manage trade lot size, and calculate risk to reward ratios, allowing you to only focus on your strategy. Say goodbye to manual calculations and streamline your trading experience with Trade Dashboard. Download  Demo Version  right now. You can find  Details of
MT5 to Telegram Signal Provider は、Telegramのチャット、チャンネル、またはグループに 指定された シグナルを送信することができる、完全にカスタマイズ可能な簡単なユーティリティです。これにより、あなたのアカウントは シグナルプロバイダー になります。 競合する製品とは異なり、DLLのインポートは使用していません。 [ デモ ] [ マニュアル ] [ MT4版 ] [ Discord版 ] [ Telegramチャンネル ] セットアップ ステップバイステップの ユーザーガイド が利用可能です。 Telegram APIの知識は必要ありません。必要な全ては開発者から提供されます。 主な特長 購読者に送信する注文の詳細をカスタマイズする機能 例えば、Bronze、Silver、Goldといった階層型のサブスクリプションモデルを作成できます。Goldサブスクリプションでは、すべてのシグナルが提供されます。 id、シンボル、またはコメントによって注文をフィルターできます 注文が実行されたチャートのスクリーンショットが含まれます 追加の
MT5のトレードコピー機は、МetaТrader5プラットフォームのトレードコピー機です 。 それは間の 外国為替取引をコピーします   任意のは 、MT5 - MT5、MT4 - MT5   COPYLOT MT5版の アカウント (またはを MT4 - MT4   MT5 - MT4   COPYLOT MT4版用) 信頼できるコピー機! MT4のバージョン 完全な説明   +DEMO +PDF 購入する方法 インストールする方法     ログファイルの取得方法     テストと最適化の方法     Expforex のすべての製品 МТ4ターミナルでトレードをコピーすることもできます(   МТ4   -   МТ4、МТ5   -   МТ4   ):   MT4のCOPYLOT CLIENT このバージョンには、端末間 МТ5   -   МТ5、МТ4   -   МТ5が含まれ ます。 ディールコピー機は、2/3/10端末間でディール/ポジションをコピーするために作成されます。 デモ口座と投資口座からのコピーがサポートされています。 プログラムは、複数の端末
あなたがメンバーである任意のチャネルから(プライベートおよび制限されたものを含む)シグナルを直接あなたのMT5にコピーします。  このツールは、トレードを管理し監視するために必要な多くの機能を提供しながら、ユーザーを考慮して設計されています。 この製品は使いやすく、視覚的に魅力的なグラフィカルインターフェースで提供されています。設定をカスタマイズして、数分で製品を使用を開始できます! ユーザーガイド + デモ  | MT4版 | Discord版 デモを試してみたい場合は、ユーザーガイドにアクセスしてください。 Telegram To MT5 受信機は、ストラテジーテスターで動作しません! Telegram To MT5の特徴 複数のチャネルから一度にシグナルをコピー プライベートおよび制限されたチャネルからシグナルをコピー BotトークンまたはChat IDは必要ありません   (必要に応じて使用することができます) リスク%または固定ロットを使用して取引 特定のシンボルを除外 すべてのシグナルをコピーするか、コピーするシグナルをカスタマイズするかを選択 すべてのシグナ
Attention: this is a multicurrency EA, which trades by several pairs from one chart!  Therefore, in order to avoid duplicate trades, it is necessary to attach EA only to one chart, ---> all trading in all pairs is conducted only from one chart! we can trade simultaneously in three different pairs, as by default (EURUSD + GBPUSD + AUDUSD), which take into account the correlation when entering the market for all three; we can trade only EURUSD (or any currency pair) and at the same time take into
Hedge Ninja
Robert Mathias Bernt Larsson
5 (1)
Make sure to join our Discord community over at www.Robertsfx.com , you can also buy the EA at robertsfx.com WIN NO MATTER IN WHICH DIRECTION THE PRICE MOVES This robot wins no matter in which direction the price moves by following changing direction depending on in which direction price moves. This is the most free way of trading to this date. So you win no matter which direction it moves (when price moves to either of the red lines as seen on the screenshot, it wins with the profit target yo
YuClusters
Yury Kulikov
4.93 (41)
Attention: You can view the program operation in the free version  YuClusters DEMO .  YuClusters is a professional market analysis system. The trader has unique opportunities to analyze the flow of orders, trade volumes, price movements using various charts, profiles, indicators, and graphical objects. YuClusters operates on data based on Time&Sales or ticks information, depending on what is available in the quotes of a financial instrument. YuClusters allows you to build graphs by combining da
Trade copier MT5
Alfiya Fazylova
4.44 (25)
Trade Copierは、取引口座間の取引をコピーして同期するように設計された専門的なユーティリティです。 コピーは、同じコンピューターまたはvps にインストールされている、サプライヤーのアカウント/端末から受信者のアカウント/端末に行われます。 購入する前に、デモ アカウントでデモ バージョンをテストできます。 デモ版 こちら 。 詳細な説明は こちら 。 主な機能と利点: MT5ネッティングアカウントを含む、MT5> MT5、MT4> MT5、MT5> MT4のコピーをサポートします。 高いコピー速度(0.5秒未満)。 ベンダーモードと受信者モードは同じ製品内に実装されています。 チャートから直接リアルタイムでコピーを制御できる、簡単で直感的なインターフェイス。 接続が切断されたり、端末が再起動されたりしても、設定と位置が失われることはありません。 コピーするシンボルを選択できます。また、受信者のシンボルを置き換えることもできます(例:EURUSD> USDJPY)。 バックコピーをサポートします。 特定の注文のみのコピーを有効にする機能。 取引開始価格の最大差と最大遅延時間を
Mentfx Mmanage mt5
Anton Jere Calmes
4.25 (8)
The added video will showcase all functionality, effectiveness, and uses of the trade manager. Drag and Drop Trade Manager. Draw your entry and have the tool calculate the rest. Advanced targeting and close portions of a trade directly available in tool (manage trades while you sleep). Market order or limit order on either side with factored spread. Just draw the entry, the tool does the rest. Hotkey setup to make it simple. Draw where you want to enter, and the stop loss, the tool calculates al
Trade Manager は、リスクを自動的に計算しながら、取引を迅速に開始および終了するのに役立ちます。 過剰取引、復讐取引、感情的な取引を防止する機能が含まれています。 取引は自動的に管理され、アカウントのパフォーマンス指標はグラフで視覚化できます。 これらの機能により、このパネルはすべてのマニュアル トレーダーにとって理想的なものとなり、MetaTrader 5 プラットフォームの強化に役立ちます。多言語サポート。 MT4バージョン  |  ユーザーガイド + デモ Trade Manager はストラテジー テスターでは機能しません。 デモについてはユーザーガイドをご覧ください。 危機管理 % または $ に基づくリスクの自動調整 固定ロットサイズを使用するか、ボリュームとピップに基づいた自動ロットサイズ計算を使用するオプション RR、Pips、または価格を使用した損益分岐点ストップロス設定トレーリングストップロス設定 目標に達したときにすべての取引を自動的に終了するための 1 日あたりの最大損失 (%)。 過度のドローダウンからアカウントを保護し、オーバートレードを防ぎます
Set price targets, and leave everything else to HINN Lazy Trader! This tool is designed for automatic position sizing from specified levels to designated targets. Using a VPS is recommended (*). The demo version   limited in functionality, be sure to watch this video before using -->  https://youtu.be/geLQ6dUzAr8 A community for users, product discussion, update news, and first line of support are organized in a free Discord: https://discord.gg/zFhEZc7QDQ Use Webmoney For payments in cryptocu
ニュースイベントの洞察でトレードを強化 トレードの世界では、ニュースイベントが市場価格に大きな影響を与えることがあります。これらのイベントが価格変動にどのように影響するかを理解することは、ボラティリティの高い時期にトレードを管理するために重要です。News Tool EA は、過去および今後のニュースイベントに関する洞察を提供し、情報に基づいたトレードの意思決定を支援します。 このEAは、ストラテジーテスターでは実行できません。 ユーザーガイド 主な機能: 歴史的影響分析 過去の特定のニュースイベントに対して価格変動がどのように反応したかを理解します。イベントがしばしば強気または弱気のトレンドに従うかを分析し、調整可能な時間枠でポイントまたはパーセンテージの平均価格影響を表示します。ビジュアルグラフを使用して、ニュースイベントと価格反応を並べて観察し、より深い市場の洞察を得ることができます。 リアルタイムニュースの統合 MT5内で直接、今後のニュースイベントのライブアップデートを受け取ります。特定のイベントや重要度レベルに対するアラートを設定し、通貨や関連性でイベントをフィルタ
Trade Assistant 38 in 1
Makarii Gubaydullin
4.89 (18)
多機能ツール 搭載機能: ロット計算機、プライスアクション、リスク/リワードレシオ、トレードマネージャー、需要供給ゾーンなどをはじめ65以上の機能。 バージョ:デモ版   |   ユーザーマニュアル   |    MT5版 このユーティリティはストラテジー テスターでは機能しません。 ここからデモ   バージョンをダウンロードして製品をテストできます。 ご不明な点や改善提案、バグの発見などございましたら、 連絡してください 。 取引プロセスを簡素化、高速化、自動化します。このダッシュボードで標準端末機能を拡張します 1. 新しい取引を開始します : ロット / リスク / RR の計算 1. Lot計算機(リスクサイズに基づく取引量計算 2. リスク計算機(ロットサイズに基づくリスク量) 3. リスク/リワードレシオ (R/R) 4. 注文のアクティベーション トリガー + Buy StopLimit / Sell StopLimit 5. 仮想 SL / TP レベル (隠しSL、TP: ブローカーには見えない) 6.  Smart SL / エントリー レベル: バ
この製品は、ニュースタイム中にすべてのエキスパートアドバイザーと手動チャートをフィルタリングするため、急激な価格変動によるマニュアルトレードのセットアップの破壊や他のエキスパートアドバイザーによって入力された取引について心配する必要はありません。この製品には、ニュースのリリース前にオープンポジションとペンディングオーダーを処理できる完全な注文管理システムも付属しています。 The News Filter  を購入すると、将来のエキスパートアドバイザーのためにビルトインのニュースフィルターに頼る必要はなく、今後はすべてのエキスパートアドバイザーをここからフィルタリングできます。 ニュース選択 ニュースソースは、Forex Factoryの経済カレンダーから取得されます。 USD、EUR、GBP、JPY、AUD、CAD、CHF、NZD、CNYなど、任意の通貨数に基づいて選択できます。 Non-Farm(NFP)、FOMC、CPIなどのキーワード識別に基づいて選択することもできます。 影響レベルによってフィルタリングするニュースを選択することができ、低、中、高の影響範囲から選択できます
-25% discount ($199 -> $149) Advanced trading tool: One click smart orders that execute under your conditions Developed by trader for trading community:  position size calculator (lot size), open position after price action, strategy builder, set and forget trading, mobile notifications... Risk Management -  Risk percentage position size calculator, gain percentage, target risk reward ratio, spread and commissions are included in calculations 7 Advanced order types  - Set and forget trading w
ATTENTION the expert does not work in strategy tester, for a trial version visit my profile. Manual RiskGuard Management   RiskGuard management was born with the idea of ​​helping traders from their initial journey to becoming expert and aware traders. Compatible with any operating system whether Mac or Windows. The operations panel is integrated into the graph giving the possibility to choose size and position between right and left, while the various buttons light up when they can be used,
ワンクリックで取引できるトレーディングパネル。ポジションと注文の操作!チャートまたはキーボードから取引。 当社の取引パネルを使用すると、チャートから直接シングルクリックで取引を実行でき、標準の MetaTrader コントロールよりも 30 倍高速に取引操作を実行できます。 パラメータと関数の自動計算により、トレーダーにとって取引がより速く、より便利になります。 グラフィックのヒント、情報ラベル、取引取引に関する完全な情報はチャート MetaTrader にあります。 MT4のバージョン 完全な説明   +DEMO +PDF 購入する方法 インストールする方法     ログファイルの取得方法     テストと最適化の方法     Expforex のすべての製品 手動取引用の取引パネル。チャート(チャートウィンドウ)またはキーボードから取引できます。  開閉、リバース、ロックポジションと注文を処理する МetaТrader5 のメインオーダーのトレーディングコントロールパネル:売買、売却、売却、売却、売却、閉じる、削除、修正、トレーリングストップ、ストップロス、takep
Adam FTMO MT5
Vyacheslav Izvarin
5 (2)
ADAM EA Special Version for FTMO Please use ShowInfo= false for backtesting ! Our 1st EA created using ChatGPT technology Trade only GOOD and checked PROP FIRMS  Default parameters for Challenge $100,000 Tested on EURUSD and GBPUSD only  Use 15MIN Time Frame Close all deals and Auto-trading  before Weekend at 12:00 GMT+3  Friday For Prop Firms MUST use special Protector  https://www.mql5.com/en/market/product/94362 -------------------------------------------------------------------------------
Grid Manual MT5
Alfiya Fazylova
4.87 (15)
「Grid Manual」は、注文のグリッドを操作するための取引パネルです。 ユーティリティはユニバーサルで、柔軟な設定と直感的なインターフェイスを備えています。 それは、損失を平均化する方向だけでなく、利益を増やす方向でも注文のグリッドで機能します。 トレーダーは注文のグリッドを作成して維持する必要はありません。 すべてが「Grid Manual」によって行われます。 注文を開くだけで十分であり、「Grid Manual」は注文のグリッドを自動的に作成し、非常に閉じるまでそれに付随します。 完全な説明とデモバージョン ここ。 ユーティリティの主な機能と機能 ユーティリティは、モバイル端末から開かれた注文を含め、あらゆる方法で開かれた注文を処理します。 「制限」と「停止」の2種類のグリッドで機能します。 グリッド間隔の計算には、固定と動的(ATRインジケーターに基づく)の2つの方法で機能します。 オープンオーダーグリッドの設定を変更できます。 チャート上の各注文グリッドの損益分岐点を表示します。 各注文グリッドの利益率を表示します。 ワンクリックでグリッドから収益性の高い注文を閉じるこ
Cerberus Equity Watcher
Samuel Bandi Roccatello
5 (2)
Cerberus the Equity Watcher はリスク管理ツールであり、アカウントの資産を常に監視し、不完全な EA や裁量的なトレーダーの場合は感情的な行動によって引き起こされる大きなドローダウンを回避します。これは、バグを含む可能性のある EA や、予想外の市況でうまく機能しない可能性のある EA に依存するシステマティック トレーダーにとって非常に役立ちます。 Cerberus では、最小エクイティ値と (オプションで) 最大値を設定できます。これらのいずれかに達すると、すべてのポジションがフラットになり、すべての未決注文がクローズされ、すべての EA が「強制終了」されます。すべての位置を平坦化すると、ユーザーの携帯電話に通知が送信され、画面に明確なメッセージが表示されます。 「平坦化」の後、Cerberus は株式価値を監視し続け、再初期化されるまでそれ以上の取引の試みを停止し続けます。 Cerberus によって実行されるすべての操作は、画面に明確に表示され、Expert advisor タブに報告され、通知がユーザーに送信されます。ユーザーのミスを避けるために、
概要 Stats Dashboardを使用して、トレーディングパフォーマンスを追跡、分析、および向上させましょう。日次、週次、月次、カスタム期間など、さまざまな期間にわたる主要な統計を表示します。インタラクティブなラインチャートを使用して、最もパフォーマンスの良い、または悪い取引商品を簡単に特定できます。 EAはストラテジーテスターでは動作しません。無料トライアルをご希望の方はご連絡ください。 表示される統計: 利益 - 利益率(%)および総純利益($) 取引 - 総取引数および勝率 統計 - 利益ファクターおよび回復ファクター 勝率 % ドローダウン - エクイティドローダウン %およびバランスドローダウン % ブローカーフィー - 総手数料および総スワップフィー 総取引ロット数および平均取引期間 初期バランスおよび現在のバランス 主な機能 詳細な利益とパフォーマンスのメトリクス リアルタイムデータ分析 日次サマリーレポート 月次カレンダービュー 特定のアルゴリズムでフィルタリング(マジックナンバー) リアルタイムデータ分析 リアルタイムのトレーディングデータにアクセス : 最新の市
The  Easy Strategy Builder (ESB)  is a " Do It Yourself " solution that allows you to create a wide range of the automated trading strategies without any line of codes. This is the world’s easiest method to automate your strategies that can be used in STP, ECN and FIFO brokers. No drag and drop is needed. Just by set conditions of your trading strategy and change settings on desired values and let it work in your account. ESB has hundreds of modules to define unlimited possibilities of strategi
The top-selling EAs on the market cost a lot and one day they are suddenly gone. This is because one strategy will not work in the forex market all the time. Our product is unique from all others in the MQL Marketplace because our EA comes with 34+ built-in indicators that allow develop strategies every time.  You build your strategy and keep updating it. If one strategy does not work, simply build another all using only one EA. This is All-In-One EA   in this market place. You can use as trade
Unlimited Trade Copier Pro MT5 is a tool to copy trade remotely to multiple MT4, MT5 and cTrader accounts at different computers/locations over internet. This is an ideal solution for you if you are a signal provider and want to copy your trades to other receivers globally on your own rules. One provider can copy trades to multiple receivers and one receiver can get trade from multiple providers as well. The provider can even set the subscription expiry for each receiver, so that receiver will n
UTM Manager は、迅速かつ効率的な取引執行を提供する直感的で使いやすいツールです。際立った機能の 1 つは、「スプレッドを無視」モードです。これにより、スプレッドを完全に無視して、ローソク足の価格で取引できるようになります (たとえば、LTF でより高いスプレッドのペアを取引でき、スプレッドによって取引から除外されるのを回避できます)。 UTM Manager のもう 1 つの重要な側面は、独自のローカル取引コピー機であり、各ブローカーで異なる取引戦略と設定 (たとえば、さまざまな TP、BE、およびリスク ルール) を柔軟に実行できます。 取引執行: 迅速かつ効率的な取引執行: チャート上のエントリー価格とストップロス価格をクリックして簡単に取引を入力するか、ワンクリックの固定ストップロスサイズ機能を使用します。 自動ロットサイズ計算: ロットは事前定義されたリスク設定に基づいて計算され、ドラッグによってポジションが変更されると再計算されます。 1 つまたは複数のポジションを同時に処理できる能力。 利益確定と損益分岐点: 柔軟なテイクプロフィット設定: 特定のリスク対報
作者のその他のプロダクト
SyncGraph Plus
PATRICK ANTONIO MORELO A.
Indicator that synchronizes the charts, that is, when the asset is replaced in one of the charts, all those that appear with the synchronized indicator are changed, with the same timeframe (Same_Timeframe = true) or with different timeframes (Same_Timeframe = false). The graphics to be synchronized are identified by color (Label). To synchronize the indicators, the indicator must be inserted in all charts to be synchronized, using the same color (Label). A box with the chosen color (Label) and
Indicator that synchronizes the charts, that is, when the asset is replaced in one of the charts, all those with the synchronized indicator are changed, with the same timeframe (Same_Timeframe = true) or with different timeframes (Same_Timeframe = false). The graphics to be synchronized are identified by color (Label). To synchronize indicators, the indicator must be inserted in all charts to be synchronized, using the same color (Label). A box with the chosen color (Label) and identification A
Mini Panel Plus
PATRICK ANTONIO MORELO A.
4.33 (6)
Remodeling the BoletaMiniPanel, the Mini Panel Plus has the same functionalities, but is now in the form of a box that allows it to be minimized and placed anywhere on the chart. Simple Panel with Stop loss (Loss), Stop gain (Gain), Trailing stop (TS) and Breakeven (BE-P). The Lot is the number of contracts to be traded. Gain is the number, in points, at which the stop gain will be positioned. If you don't want to place a stop gain, just put 0 (zero) in its place and when you open the order it w
FREE
SyncGraph
PATRICK ANTONIO MORELO A.
2 (3)
Indicator that synchronizes the charts, that is, when the symbol is replaced in one of the charts, all those that appear with the synchronized indicator are changed, with the same timeframe (Same_Timeframe = true) or with different timeframes (Same_Timeframe = false). The graphics to be synchronized are identified by color (Label). To synchronize the indicators, the indicator must be inserted in all the charts to be synchronized, using the same color (Label). A box with the chosen color (La
FREE
TRIXs
PATRICK ANTONIO MORELO A.
5 (6)
The TRIXs Indicator is the combination of the TRIX (Triple Exponential Moving Average) indicator with the addition of a SMA (Simple Moving Average) signal. It provides signs of trend continuity and the start of a new trend. The entry and exit points of operations occur when the indicator curves cross. It performs better when combined with other indicators.
FREE
BoletaMiniPanel
PATRICK ANTONIO MORELO A.
5 (3)
Simple panel with  Stop loss (Loss), Stop gain (Gain) , Trailing stop (TS) and Breakeven (BE-P). Lot is the number of contracts to be traded. Gain is the number, in points, that the stop gain will be positioned. If you don't want to put stop gain, just put 0 (zero) in place and when you open the order it won't have this stop. Loss is the number, in points, that the stop loss will be placed. If you don't want to put stop loss, just put 0 (zero) in place and when you open the order it won't
FREE
TRIXe
PATRICK ANTONIO MORELO A.
5 (3)
The TRIXe Indicator is the combination of the TRIX indicator (Triple Exponential Moving Average) with the addition of an EMA (Exponential Moving Average) signal. It provides signs of trend continuity and the start of a new trend. The entry and exit points of operations occur when the indicator curves cross. It performs better when combined with other indicators.
FREE
フィルタ:
レビューなし
レビューに返信