YouTubeにあるマーケットチュートリアルビデオをご覧ください
ロボットや指標を購入する
仮想ホスティングで
EAを実行
EAを実行
ロボットや指標を購入前にテストする
マーケットで収入を得る
販売のためにプロダクトをプレゼンテーションする方法
MetaTrader 5のための無料のエキスパートアドバイザーとインディケータ - 6

T he most Flexible & Reliable Trend-Based Fibonacci indicator by Safe Trading. This indicator helps you calculate Trend-Based Fibonacci levels base on the main and retracement trends to predict future price . If you just looking for a simple Fibonacci Retracement indicator, please use this Free indicator .
### FEATURES ### Auto-calculate up to 7 Trend-Based Fibonacci levels on adjustable frame. Adjust Fibonacci levels as your need. Adjust the start and the end of calculated frame
FREE
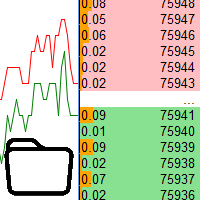
Using data from the order book in the strategy tester Key features: Simultaneous use of several symbols, up to 7 pieces DOM visualization With the visualization of order books, real-time simulation is available, as well as acceleration or deceleration Working with the library: This product also requires a utility to save data: https://www.mql5.com/en/market/product/71642 Speed control utility: https://www.mql5.com/en/market/product/81409 Include file: https://c.mql5.com/31/735/Market_book_s
FREE

Что такое Heiken Ashi? Heiken Ashi — это метод построения графиков, который можно использовать для прогнозирования будущего движения цены. Он похож на традиционные свечные графики. Однако в отличие от обычного свечного графика, график Heiken Ashi пытается отфильтровать часть рыночного шума для лучшего определения трендовых движений на рынке. Как рассчитать Heiken Ashi?
Heiken Ashi использует формулу COHL, которая означает «Закрытие, Открытие, Максимум, Минимум». Это четыре компонента, кото
FREE

Unlock the Rhythm of the Markets: Automated Backtesting for Price Action Strategies Experience the power of our revolutionary price action concept backtesting product, capable of conducting years' worth of backtesting in a matter of seconds. Say goodbye to hundreds of hours of manual analysis and hello to instant insights. Our automated backtesting tool empowers traders to create and test strategies from scratch, optimize and refine their current strategies. No more manual constraints - propel
FREE

Gold4L Clover EA Overview: Gold4L Clover EA is a powerful automated trading system designed specifically for trading the GOLDUSD pair. This Expert Advisor operates on a daily timeframe, implementing a robust strategy that places multiple pending orders daily based on historical price levels. With a focus on risk management and optimized performance, Gold4L Clover EA ensures high trading precision and profitability. Key Features: Trading Instrument: GOLDUSD Timeframe: Daily Order Types: Pending
FREE

Supply and Demand indicator does not repaint as it counts the number of tests/retests occurred in the past x number of times. As a trader you need a path to be able to place your buy and sell trades such as: Supply and Demand, Falling & raising channels . Experienced trades will draw the key levels and channels around the timeframes. But, they will not be able to draw them on the small time frames as the price changes too frequent. This indicator is based on Shved supply and demand indicator, b
FREE

Line Profit 預金通貨での利益の視覚的な線の指標。インジケーターがインストールされているシンボルの市場にオープンポジションがある場合にのみ機能します。マウスで行を移動するか、入札価格の自動追跡を有効にすることができます。 インジケーター設定の説明: colotLine-線の色 WidthLine-線幅 colotText-テキストの色 FontSize-テキストの高さ アンカー-テキストのアンカーメソッド FollowBid-入札価格に従ってください 預金通貨での利益の視覚的な線の指標。インジケーターがインストールされているシンボルの市場にオープンポジションがある場合にのみ機能します。マウスで行を移動するか、入札価格の自動追跡を有効にすることができます。
FREE
Engulfing Pattern is a free indicator available for MT4/MT5 platforms, its work is to provide "alerts" when a "Bullish" or "Bearish engulfing pattern forms on the timeframe. This indicator comes with alerts options mentioned in the parameter section below. Join our MQL5 group , where we share important news and updates. You are also welcome to join our private channel as well, contact me for the private link. Engulfing Pattern Indicator MT4 Other Products Try our Martini EA with 2 years of liv
FREE
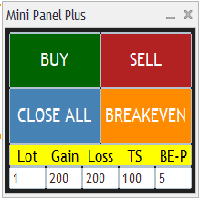
Remodeling the BoletaMiniPanel, the Mini Panel Plus has the same functionalities, but is now in the form of a box that allows it to be minimized and placed anywhere on the chart. Simple Panel with Stop loss (Loss), Stop gain (Gain), Trailing stop (TS) and Breakeven (BE-P). The Lot is the number of contracts to be traded. Gain is the number, in points, at which the stop gain will be positioned. If you don't want to place a stop gain, just put 0 (zero) in its place and when you open the order it w
FREE

This is RSI with alarm and push notification -is a indicator based on the popular Relative Strength Index (RSI) indicator with Moving Average and you can use it in Forex, Crypto, Traditional, Indices, Commodities. You can change colors to see how it fits you. Back test it, and find what works best for you. This product is an oscillator with dynamic overbought and oversold levels, while in the standard RSI, these levels are static and do not change.
This allows RSI with alarm and push notific
FREE

Indicator Description: MACD EMA Crossover
The MACD EMA Crossover is a powerful MetaTrader 5 (MT5) indicator designed to generate trading signals based on the crossovers between the Moving Average Convergence Divergence (MACD) and the Exponential Moving Average (EMA). This indicator assists traders in identifying opportune buy and sell signals, with a specific focus on trend reversals.
Features:
1. MACD Crossing Below the 0 Line (Buy Signal):
- When the MACD line crosses the signal li
FREE

Exp5-COPYLOT MASTERは、МetaТrader5とMetaTrader4のトレードコピー機です。任意のアカウントから外国為替取引をコピーします。 インストール このエキスパートアドバイザーはマスターコピー機です。トレードをコピーしたいターミナルにエキスパートアドバイザーをインストールします。 「COPY」のように、任意のテキストラベル名をpathWriteとして指定します。 トレードをコピーしたい端末にMT5用のCOPYLOTMASTERをインストールします。 次に、コピー先の MT4 端末にCOPYLOTクライアントMT4をインストールします。 または MetaTrader5用の CopylotクライアントMT5
MT4用のCOPYLOTMASTERを ダウンロードすることもできます COPYLOT-完全な説明とマニュアル PDFガイド 注:設定のリストは[コメント]タブにあります。 EAは1チャートに設定する必要があります!デフォルトでは、アドバイザーがアカウントからすべてのポジションと注文をコピーします。 注文はアクティベーション時にコピーされ(ポジション)
FREE

Free TrendLine EA opens trades whenever the price on the chart interacts with or crosses your trend line. You simply draw the trend line manually then let the EA do the trading automatically according to the rules you give it. The settings available in the EA are explained below: Lots : The lot size for trading. RiskPercentage : Set a value other than zero to activate lot sizing by use of percentage of margin. TrendLineName: The name of the line to track. You can either * rename the trend li
FREE
A neural network Expert Advisor based on two moving averages with the training mode. Train the Expert Advisor on selected examples and make a profit in real life. The EA can work on any instrument and in any timeframe.
Trading Algorithm of the EA Two moving averages are analyzed by the neural network core, which produces commands to buy or sell. the values of two moving averages, fast (FMA) and slow (SMA), are provided to the first layer, at the second layer it calculates two neurons responsib
FREE

Indicator determines the direction of price movement, calculates the possibility of entering the market using an internal formula and displays a breakout entry signal. Indicator signals appear both at the beginning of trend movements and in the opposite direction, which allows you to open and close orders as efficiently as possible in any of the market conditions. Version for МТ4: https://www.mql5.com/en/market/product/58349
Benefits: a unique signal calculation formula; high signal accuracy;
FREE

Engulfing Candle Detector
Detectable pattern Double Candlestick Patterns Bullish Engulfing
The first candle is black candle. The second candle opens with a gap below the real body of the black candle but rallies upwards to close above the real body of the black candle. In other words, the second candle's real body completely engulfs the first candle's real body Bearish Engulfing
The first candle is white candle. The second candle opens with a gap above the real body of the white candle but
FREE

速度の抵抗ラインは傾向および抵抗ラインを定めるための強力な用具である。 この指標は、チャートの極値と特別な数式を使用して線を構築します。 指標は、トレンドの方向とピボットポイントを決定するために使用することができます。
<---------------------------->
指標パラメータ:
"Depth of search" -チャートの極端な検索の深さ(バー単位) "Back step of search" -極端な間の最小距離(バー単位) "Deviation of price" -同じタイプの両極端間の許容価格差 "Line color" -対応するインデックスを持つ線の色 "Line style"-対応するインデックスを持つラインスタイル "Line width"-対応するインデックスを持つ線幅 <---------------------------->
あなたは本の中でより多くの情報を見つけることができます"エドソン*グールドによる希少な著作のコレクション"またはプライベートメッセージで私
<--------------------------
FREE

毎日特定のローソク足で動くPIVOTを何度探したことでしょう。
多くのトレーダーは、マーケットが開いてから30分後、正午12時など、毎日特定の時刻を基準にして、その日のトレンドの方向性を推し量ることを好みます。
このインディケータでは、特定の時間(時、分)を指定し、その時間から翌日までのピボットを同時にプロットすることができます。その特定のローソク足/時間に基づき、中央値、最大値、最小値、サポ ート、レジスタンスの5本のラインが表示されます。
選択した時間がPERIODの制限外(M5タイムフレームの10:12など)である場合、この値は最も近いローソク足の時間に切り上げられます。さらに、ユーザーはすべての線のスタイル、色、幅を設定することができます。
これで良いトレードができることを願っています。 また、時間範囲に基づくPIVOTが必要な場合は、 他の製品をご覧ください 。
FREE

Introducing the AI Keltner Channel , a cutting-edge Forex indicator that leverages machine learning to dynamically calculate Keltner Channels in real-time. Unlike traditional Keltner Channel indicators, which rely on static inputs, the AI Keltner Channel adapts continuously to ever-changing market conditions, providing traders with a more accurate and responsive view of price trends and volatility. Powered by advanced machine learning algorithms, the AI Keltner Channel analyzes historical and re
FREE

EurAscend EurAscend is a powerful and innovative trading robot designed specifically for the EUR/USD currency pair on the 4-hour (H4) timeframe. It is tailored for traders seeking progressive gains while effectively managing risk. EurAscend's strategy focuses on capturing key market trends and momentum within the H4 timeframe, balancing profitability with controlled risk in medium-term trading scenarios. Technical Indicators Utilized: Moving Average Convergence Divergence (MACD): EurAscend lever
FREE

Hello this is MT5 version of my first EA Project - MA CROSS Simple MA Cross Fast and Slow with additional High Time Frame Filter. You can set manually to get optimum Result. It's suit for swing Trader that Trade on High Time Frame. ex. H1 / H4 with D1 Filter. Or you can modify It that follow your strategy.
Give me good feedback to improve for better version. Cheers!!
Hurry up FREE download for Limited Time!!
Please test It on Demo account or strategy tester before applied on Live Account
FREE

Pro tren entri premium
Logika TZ Trade, menehi sampeyan, versi apik saka entri tren Premium
Rilis iki, bakal nggawa sampeyan kahanan dagang sing luwih santai kanthi fitur canggih kanggo nyaring tren lan wektu mlebu sinyal premium.
Kanggo kita, dudu nggawe produk sing penting! nanging pangopènan lan pendhidhikan terus kanggo pangguna. liwat sarana khusus kanggo nggayuh kita, sampeyan bakal nemokake pandhuan cedhak babagan cara nggunakake produk lan latihan liyane sing gegandhengan karo dag
FREE

革新的な自動取引ツール「HydraAlchemist」が登場しました。この最先端のエキスパートアドバイザー(EA)は、複数のテクニカル指標を巧みに組み合わせ、金融市場での有望な取引機会を的確に捉えます。MACD、ストキャスティック、RSIなどの指標から得られるシグナルを独自のロジックで精査し、市場のトレンドと転換点を正確に把握することで、利益の最大化を目指します。 「HydraAlchemist」の真の強みは、実際の取引戦略に基づいていることです。市場に出回る多くのゴールドEAが単純なグリッド/マーチンゲールシステムに依存し、危険な取引を繰り返す中、本EAは異なるアプローチを採用しています。複数の戦略を組み込み、シームレスに連携させることで、安定した成長曲線を実現します。バックテストの結果に惑わされることなく、現実の市場環境に適応できる堅牢な設計となっています。 使いやすさも「HydraAlchemist」の大きな特長です。直感的で理解しやすい設定画面では、少ないパラメータで最適な取引戦略を実行できます。また、全自動の取引システムでありながら、各取引のリスクを適切に管理し、安全性を確
FREE

Moving Average Trend Alert is a triple MA indicator that helps traders to identify potential market trends based on 3 MAs alignment and crossover.
Moving Average Trend Alert features: Customizable short-term, medium-term, and long-term MAs. Option to filter signals based on a minimum distance between moving averages to avoid premature MAs alignment. Optional Filter of signals with RSI indicator overbought/oversold levels. Optional Filter of signals with ADX indicator. Popup, email, and phone n
FREE

A very simple indicator, but one that cannot be missed when carrying out your operations.
Fast and accurate Spreed information before entering a trade as well as the time to start another candlestick.
Spread refers to the difference between the buy (purchase) and sell (offer) price of a stock, bond or currency transaction.
Come and see our mql5 signals too. https://www.mql5.com/pt/signals/899841?source=Site +Signals+From+Author
FREE

Understanding the levels of the previous day or week is very important information for your trading.
This indicateur allow to draw Previous day High/Low Previous week High/Low
Congifuration High & Low for: Previous day, week Line Style, color Label position, size, color Any questions or comments, send me a direct message here https://www.mql5.com/en/users/mvonline
FREE

Display Order box list from Trading box Order Management tool. Find contacts and manual links on my profile . This dashboard gives you an edge in forex trading because in few seconds you can decide which pair and timeframe is worth to watch more closely. This is how you will not be distracted by all other forex pairs that you trade, and you will not miss great opportunities to trade the best price.
Trading Dashboard (order box overview panel and Trading box Order management extension) Tr
FREE

Synthetic indeces are one of a kind of forex markets. Specially, on boom and crash indices on M1 timeframe is really interesting. I always thought that it was impossible to catch spikes safely until today. Everything has it's limits. This EA is based on martingale strategy with low drawdown. Max grid level is 3. When each trades goes on drawdown, the next trade will be multiplied by 2. The EA does not use take-profit or stoploss . So the backtesting will show the same results as real-time tradi
FREE

Trading has never been easier! Let's check this out! MT4 version: https://www.mql5.com/en/market/product/72153 Strategy There are some news within a day that can make the price jumps up or down very quickly and that is a good opportunity for traders to get some profits. Looking to scalp a news release? Here's how you can do it: Open two stop orders (a buy stop and a sell stop) 3 to 5 minutes before the news release. Place them about 15 to 20 pips away from the current market price. When the ne
FREE

Do you love VWAP? So you will love the VWAP Cloud . What is it? Is your very well known VWAP indicator plus 3-levels of Standard Deviation plotted on your chart and totally configurable by you. This way you can have real Price Support and Resistance levels. To read more about this just search the web for "VWAP Bands" "VWAP and Standard Deviation".
SETTINGS VWAP Timeframe: Hourly, Daily, Weekly or Monthly. VWAP calculation Type. The classical calculation is Typical: (H+L+C)/3 Averaging Period
FREE

Overview: The trading robot is a software application tailored for the XAU/USD currency pair. It is fine-tuned for an H1 (one-hour) trading timeframe, making it ideal for traders seeking a balance between short-term and medium-term strategies. Technical Indicators Utilized: Relative Strength Index (RSI) : This indicator is employed by the robot to gauge the speed and extent of price movements in a given direction. It is instrumental in detecting overbought or oversold conditions for the asset. B
FREE

It is the MQL5 version of zero lag MACD that was available for MT4 here: https://www.mql5.com/en/code/9993 Also there was a colored version of it here but it had some problems: https://www.mql5.com/en/code/8703 I fixed the MT4 version which has 95 lines of code. It took me 5 days to write the MT5 version.(reading the logs and testing multiple times and finding out the difference of MT5 and MT4!) My first MQL5 version of this indicator had 400 lines of code but I optimized my own code again and n
FREE

Check my version of the moving average convergence divergence (MACD) indicator based on Heikin Ashi calculations. Here you find multi-colored histogram which corresponds to bull (green) / bear(red) trend. Dark and light colors describes weakness/strenght of price trend in time. Also you can switch calculations between normal and Heikin Ashi price type.
Note: Buffers numbers for iCustom: 0-MACD, 2-Signal line
FREE

O indicador criado por Didi Aguiar, o mestre das Agulhadas!
O padrão do indicador é o cruzamento de três médias móveis simples. Média rápida, período 3. Média normalizada, período 8. Média lenta, período 20.
Quando as três médias se cruzam próximas o suficiente, acontece a agulhada! Pela posição das médias é possível identificar: Agulhada de compra, agulhada de venda, ponto falso e beijo da mulher aranha.
Quer saber mais? Procure pelo site dos robôs oficiais da Dojistar: tradesystembots.co
FREE

Fair Value Gap Sweep is a unique and powerful indicator that draws fair value gaps on your chart and alerts you when a gap has been swept by the price. A fair value gap is a price gap that occurs when the market opens at a different level than the previous close, creating an imbalance between buyers and sellers. A gap sweep is when the price moves back to fill the gap, indicating a change in market sentiment and a potential trading opportunity.
Fair Value Gap Sweep indicator has the following
FREE

HiLo Activator is a technical analysis indicator developed by Robert Krausz, a renowned hungarian trader with a career in the USA.
It is a trend indicator that helps you to predict the cange of the current trend. In an uptrend it is displayed at the bottom of the candles; in a downtrend it is displayed at the top.
Its only setting is the calculation period.
It is possible to have alerts when a new trend begin. Enjoy! This is a free indicator, but it took hours to develop. If you want to pay m
FREE

取引セッションインジケータは、各取引セッションの開始と終了を強調表示します。 セッションの開始/終了をカスタマイズする可能性のあるTrading_Session_Indicator_Pro製品の有料版 >>>
[オプション:] Timeshift - セッションの時間オフセットがある場合に使用します
[パラメータの設定:] Asian session Open=0; Asian session Close=9; Asian session OpenSummertime=1; Asian session CloseSummertime=10; European session Open=8; European session Close=17; European session Open=13; European session Close=22;
市場の私の他のプロダクト https://www.mql5.com/en/users/sky-angel/seller
FREE
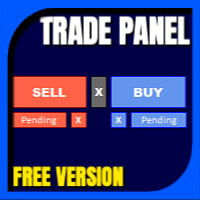
Have you missed any tools or shortcuts in Meta Trader? Simple things that would make your daily trading much easier ?
We have the solution for you: our Trade Panel!
This is an EA tool (Expert Advisor) that, if configured to controll all symbols, needs to be loaded only once.
This is the Lite version (free) of our tool. Professional version: https://www.mql5.com/en/market/product/42658 If you have some problemas with the shortcut buttons on chart on unpinned mode try change the tickets d
FREE

Introduction This indicator detects volume spread patterns for buy and sell opportunity. The patterns include demand and supply patterns. You might use each pattern for trading. However, these patterns are best used to detect the demand zone (=accumulation area) and supply zone (=distribution area). Demand pattern indicates generally potential buying opportunity. Supply pattern indicates generally potential selling opportunity. These are the underlying patterns rather than direct price action. T
FREE

Elliot Waves Analyzer calculates Elliot Waves to Help Identify Trend direction and Entry Levels. Mainly for Swing Trading Strategies. Usually one would open a Position in trend direction for Wave 3 or a Correction for Wave C . This Indicator draws Target Levels for the current and next wave. Most important Rules for Elliot Wave Analysis are verified by the Indicator. This free version is limited for Analyzing one Timperiod Waves. Waves are Shown only in PERIOD_H4 and above. Not Useful for Intr
FREE

AI forex robot is an advanced trading tool that utilizes sophisticated algorithms and machine learning techniques to analyze market data and make informed trading decisions. One of the key indicators it uses is the envelopes indicator, which plots a pair of parallel lines, usually representing a standard deviation away from a moving average. This indicator helps the robot to identify potential trend reversals or breakouts by highlighting areas of support and resistance. By continuously monitorin
FREE

This Free Version I separate from Paid version to whom is newbies here and don't have much money to buy good EA. This EA working on AUDCAD with very small Balance and no martingale , No grid its just hedge positions opposite side to cover loss side until trailing Profits and loss together, last I am not make sure this ea work on your broker too so test demo before running on live account. My recommendation for first use : Pair : AUDCAD Time Frames : M15 Balance : 100$ or Above Use Force Trend M
FREE
This utility tool shows the ticker symbol, timeframe, and description information as a watermark on the chart. Text resizes automatically according to chart size. It is useful to identify the correct chart when multiple charts are shown on the screen. Want more control over text apperance? Check out our Chart Watermark MT5 Premium utility. See the demonstration video below!
Inputs: Font Size: Initial font size for the ticker symbol and timeframe text (Default; 50). Description text font siz
FREE
Limited time promotion!
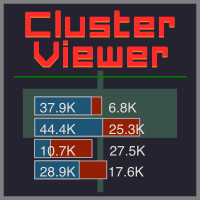
Within each candlestick is an epic fight between bears and bulls. Some pushing the price down and others forcing them up. Wouldn't it be great to be able to see where there is a greater concentration of business? Or to know if there is more buying or selling aggressions in the candlestick? After all, who is stronger, buyers or sellers? Although a candlestick image has a lot of information, it is nevertheless weak for deeper analysis. This is where you can count on the
FREE

Using the Stochastic Oscillator with a Moving Average is a simple but very efficient strategy to predict a trend reversal or continuation.
The indicator automatically merges both indicators into one. It also gives you visual and sound alerts.
It is ready to be used with our programmable EA, Sandbox, which you can find below: Our programmable EA: https://www.mql5.com/en/market/product/76714 Enjoy the indicator!
This is a free indicator, but it took hours to develop. If you want to pay me a c
FREE

This EA specializes in trading gold on the M5 time frame. I have meticulously optimized it, so you just need to start it and let it run without doing anything else. You can also check out my premium VIP version, which is paid, to increase profitability further
This is a trading strategy adapted from my very successful manual trading, which helps to make money in both trending and sideways markets. - The EA has been optimized, just turn it on, and it will run without needing to do anything else
FREE

Overview:
Recommend Broker exness. TBH, As it is a free script, Please register using this url. So I can get some referral benefit, it motivates me and will keep continue supporting this and any future Expert Advisor.
https://one.exnesstrack.net/a/7lex5q7rkt Introducing the VWAMP Buster Expert Advisor, a sophisticated trading algorithm designed for MetaTrader 5. Harnessing the power of the Volume Weighted Average Price (VWAP), Bollinger Bands, and ATR (Average True Range), VWAMP Bus
FREE

The Pivot Point indicator automatically calculates and displays the pivot point line and support and resistance levels. Pivot can be calculated according to the Classic, Floor, Fibonacci, Woodie, Camarilla or DeMark formula. It is also possible to select the period for calculating the indicator. A trader can choose from daily, weekly, monthly, or user-defined periods.
Types of pivots Classic Floor Fibonacci Woodie Camarilla DeMark
Main features The indicator shows the current and histor
FREE

CPR Pivot Lines It Will Draw Pivot Point R1,R2,R3 S1,S2,S3 Tc Bc Best Part Is That You Can Even Add Values Of High,Low,Close Manually Also To Get Your All Levels On Chart.So If Your Broker Data Of High ,Low ,Close Is Incorrect Then You Don’t Have To Depend On Them Anymore. You Can Even Modify All Lines Style. It Will Show Line In Floting Style And Not Continues Mess.
FREE
Darvas Flow is a revolutionary trading indicator that combines the classic Darvas Box method with modern market flow analysis. Developed for serious traders, Darvas Flow offers a powerful and intuitive tool for identifying trading opportunities. This indicator has been through backtesting on the XAUUSD M30 pair for 6.5 years. If you are interested, please visit this EA product : https://www.mql5.com/en/market/product/121320
Key Features: Darvas Box Method Implementation : Darvas Flow au
FREE

This indicator combines TRIX (Triple Exponential Moving Average) with a Moving Average, which can be simple, exponential, smoothed or weighted.
This combination is very useful to identify the main trend and when it is changing to a new direction.
The indicator also has signals on the chart that indicates the TRIX crossing with the Moving Average, as well as pop-up alerts and push (in the MT5 app).
Enjoy it!
FREE

This indicators automatically draws the support and resistances levels (key levels) for you once you've dropped it on a chart. It reduces the hustle of drawing and redrawing these levels every time you analyse prices on a chart. With it, all you have to do is drop it on a chart, adjust the settings to your liking and let the indicator do the rest.
But wait, it gets better; the indicator is absolutely free! For more information: https://youtu.be/rTxbPOBu3nY For more free stuff visit: https
FREE

Trading Keys is an advanced and easy to use risk calclator. Features: Drag and drop visual lines to take profit/stop loss/ entry levels. Risk calculation based on account balance / quity percentage per trade. Profit protection and trailing toggle button Auto break even toggle button Risk calculation for prop firms based on drawdown level How to setup your Trading Keys? Add trading keys to your chart Setup the parameters Save the chart as default template "Default.tpl" How to use Trading keys? Cl
FREE

VR カラー レベルは、トレンドライン、四角形、テキストなどの要素を使用してテクニカル分析を適用する人にとって便利なツールです。グラフにテキストを直接追加したり、スクリーンショットを撮ったりすることができます。 設定、設定ファイル、デモ版、説明書、問題解決方法は、以下から入手できます。 [ブログ]
レビューを読んだり書いたりすることができます。 [リンク]
のバージョン [MetaTrader 4] インジケーターの操作は ワンクリック で実行できます。これを行うには、線の付いたボタンをクリックすると、カーソルの下に傾向線が表示されます。次に、カーソルを移動して 線の位置 を選択し、もう一度クリックして修正します。 インジケーター の特徴は、スタイルと色のすべての変更が自動的に保存され、その後すべての 新しく作成された グラフィック オブジェクトに適用されることです。 このインジケーターには、異なるスタイルのトレンド ラインを設定するための 2 つの独立したボタン、異なるスタイルの 2 つの独立した四角形、独自のスタイルを持つ 1 つのテキスト フィールド、およびスクリーンショ
FREE

BeST_Oscillators Collection is a Composite MT5 Indicato r including the Chaikin , Chande and TRIX Oscillators from which by default Chaikin and TRIX Oscillators but not Chande Momentum Oscillator are contained in MT5 platform. It also provides for each Oscillator the option of displaying or not a Mov. Average as a Signal Line and the resulting Signals as Arrows in a Normal (all arrows) or in a Reverse Mode (without showing up any resulting successive and of same type arrows).
Analytically f
FREE

Sessions are very important in trading and often good area where to look for setup. In SMC, ICT we will look for Asian session to serve as liquidity
This indicator displays: High & Low of the Asia session Midnight New York time opening line
Congifuration Line Style, color Label position, size, color Start of the level (Start of the day, Start of the session, Highest or Lowest point in the session)
Any questions or comments, send me a direct message here https://www.mql5.com/en/users/mvonl
FREE

The MACD 2 Line Indicator is a powerful, upgraded version of the classic Moving Average Convergence Divergence (MACD) indicator.
This tool is the embodiment of versatility and functionality, capable of delivering comprehensive market insights to both beginner and advanced traders. The MACD 2 Line Indicator for MQL4 offers a dynamic perspective of market momentum and direction, through clear, visually compelling charts and real-time analysis.
Metatrader4 Version | How-to Install Product | How
FREE
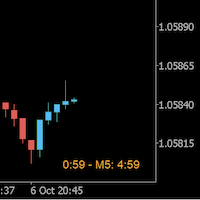
Always wanted to know when the M5 candle closes when you are in M1 ? This indicator allow to display a candle timer (countdown) on the current time frame as well as any higher time frame you have configured for this time frame. So this is easy now to see when the H4 candle closes when you are in H1.
Congifuration Label position, size, color HFT time frame per time frame Any questions or comments, send me a direct message here https://www.mql5.com/en/users/mvonline
FREE

MT5 Alert Indicator Please add Ema moving averages 60/100/200 & Rsi period 10 levels 30/70 to your chart. This indicator alert on a trend reversal strategy were - ema 60 > 100&200 - ema 100 < 200 And the Rsi is below 30 FOR BUY SIGNAL
Use this strategy in confluence with a larger timeframe trend in the same direction. This strategy identifies great entry opportunities to enter an early trend.
FREE

The Trend Line Reverse Expert Advisor is a highly innovative and powerful tool that enables traders to effortlessly identify and trade trends in the financial markets. With this advanced tool, you can easily draw trend lines on your MT5 chart, and the EA will automatically buy or sell when the price reaches the trend line. This EA is user-friendly and requires minimal setup. You can simply attach it to your chart and start drawing up to three trend lines where you anticipate the price to reverse
FREE
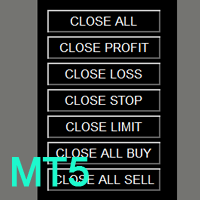
如果产品有任何问题或者您需要在此产品上添加功能,请联系我 Contact/message me if you encounter any issue using the product or need extra feature to add on the base version.
You can get the free Close Button MT4 version at LINK . Close Button provides you an intuitive, effective, and handy way to close your orders and/or positions based on their type and their profit status. The tool provides seven close options: Close All: close all pending orders and positions. Close Profit: close all positions which are in profit. Close
FREE

A bot utility designed to streamline trade management. It offers auto lot calculation based on money, account risk, or fixed lot size, with order setup featuring draggable take profit, stop loss, and entry price to fit your plan. It supports Buy/Sell market, Buy/Sell limit, and Buy/Sell stop orders, with or without stop loss and take profit. Additional features include single-click breakeven, deleting positions/orders, and more, making trade management efficient and easy.
FREE

Este indicador traça uma reta baseada em regressão linear, esta reta é dinâmica e é atualizada a cada tick. O cálculo de regressão linear é feito considerando o número de candles definido pelo tamanho da janela fornecida pelo usuário. São traçadas duas linhas, uma superior e uma inferior, para guiar a estratégia do usuário, a distância dessas linhas para a linha central deve ser configurada. É possível definir os estilos, cores e espessuras de cada uma das linhas.
Esse indicador foi inicialm
FREE

RSI Colored Candlesへようこそ。この革新的なインジケーターは、相対力指数(RSI)を直接価格チャートに統合し、従来のRSIインジケーターとは異なり、四色のカラースキームを使用してRSIレベルを直接ローソク足に表示します。一目で価値ある洞察を提供します。 特徴と利点: スペース節約デザイン: 混雑したインジケーターウィンドウにさようなら! RSI Colored Candlesは、別個のRSIウィンドウの必要性を排除し、より清潔で簡素な取引体験を提供することで、貴重なチャートスペースを節約します。 オーバーボートおよびオーバーソールドゾーンの視覚的表示: ローソク足で直接オーバーボート(赤いキャンドルで表される)およびオーバーソールド(青いキャンドルで表される)の状態を簡単に識別します。この視覚的表示により、より良い取引の決定を下し、逆転の可能性を最大限に活用できます。 改善されたエントリーシグナル: 色分けされたキャンドルをトレーディングシグナルとして使用し、青いキャンドルが買いの機会を示し、赤いキャンドルが売りの機会を示すようにします。この直感的なアプローチは、RS
FREE

OVERVIEW
The Fibonacci Moving Averages are a toolkit which allows the user to configure different types of Moving Averages based on key Fibonacci numbers.
Moving Averages are used to visualise short-term and long-term support and resistance which can be used as a signal where price might continue or retrace. Moving Averages serve as a simple yet powerful tool that can help traders in their decision-making and help foster a sense of where the price might be moving next.
The aim of this s
FREE

Necessary for traders: tools and indicators Waves automatically calculate indicators, channel trend trading Perfect trend-wave automatic calculation channel calculation , MT4 Perfect trend-wave automatic calculation channel calculation , MT5 Local Trading copying Easy And Fast Copy , MT4 Easy And Fast Copy , MT5 Local Trading copying For DEMO Easy And Fast Copy , MT4 DEMO Easy And Fast Copy , MT5 DEMO 高度なボリンジャーバンド:
1.ボリンジャーレールは方向によって色が変わります」
2.ボリンジャーアウターレールの伸縮はアウターレールの色の変化でマークされます。」 3.ボリンジャ
FREE

HFT EA -DE40, US30, US500, USTEC
-IC Market Recomment Broker -EA can Trade with every Broker
only DE40 with this Standart Settings (Change the Compare Count to 3 or higher 10 for better Results) for other Indizes or Pairs Set the Stop Loss x10 to actuall Spread or higher, and Set Take Profit x40 from Spread, PriceOffset x4 from Spread or higher Recomment M5, M15, M30, H1, D1 minimum 1000$/€ ...Lot 1 in first 3 Weeks Expert have auto Lot Settings, to delete auto Lot...Set VolumePercent to Ze
FREE

!! THE FIRST FREE NEURAL NETWORK EA WITH EXCELLENT AND REALISTIC RESULTS.!! Another beautiful work of art, guys you don't know the powerful creations that are created by my developer Nardus Van Staden. Check him out guys and gals, he is the real deal, an amazing person and a professional when it comes to coding and business, if you want work done!, hit him up! you can get in contact with him HERE .
THE FOLLOWING PRODUCT IS A FREE VERSION OF A PAID VERSION THAT IS TO COME, PROFITS ARE GOING TO
FREE

This indicator uses the Zigzag indicator to identify swing highs and swing lows in the price chart. Once it has identified the swing highs and swing lows, it can use them to determine potential support and resistance levels. A support level is formed when the price drops and bounces back up from a swing low, indicating that there is buying pressure at that level. A resistance level is formed when the price rises and reverses downward from a swing high, suggesting selling pressure at that level.
FREE

強力なNRTR(Nick Rypock Trailing Reverse)インディケーターをご紹介します。トレンドの反転を特定し、効果的なトレーリングストップレベルを設定することを目指すトレーダーにとって必須のテクニカルツールです。ニック・ライポックによって開発されたこのインディケーターは、常に変化する市場条件に適応する独自のアルゴリズムを採用しており、どんなトレーダーのツールキットにも欠かせない存在となっています。
以下は、トレーダーがこのインディケーターを使用する人気のある方法です:
1. トレンドの反転:NRTRインディケーターは、トレンドが反転する予兆があるときに明確なシグナルを生成します。インディケーターラインが価格チャートを交差することに注意し、トレンドの方向が変わる可能性を示します。
2. トレーリングストップ:NRTRは、トレンド市場で利益を保護する頼りになるトレーリングストップツールとしても機能します。価格が望む方向に動くと、NRTRラインが価格の下または上に動的に追随し、適応可能なストップロスレベルを提供します。
カスタマイズ可能なパラメータ:NR
FREE
MetaTraderマーケットは、他に類のない自動売買ロボットやテクニカル指標の販売場所です。
MQL5.community ユーザーメモを読んで、取引シグナルのコピー、フリーランサーによるカスタムアプリの開発、支払いシステムを経由した自動支払い、MQL5Cloud Networkなど、当社がトレーダーに対して提供するユニークなサービスについて詳しくご覧ください。
取引の機会を逃しています。
- 無料取引アプリ
- 8千を超えるシグナルをコピー
- 金融ニュースで金融マーケットを探索
新規登録
ログイン