YouTubeにあるマーケットチュートリアルビデオをご覧ください
ロボットや指標を購入する
仮想ホスティングで
EAを実行
EAを実行
ロボットや指標を購入前にテストする
マーケットで収入を得る
販売のためにプロダクトをプレゼンテーションする方法
MetaTrader 5のための無料のエキスパートアドバイザーとインディケータ - 33
White label available. contact us for more info. dushshantharajkumar@gmail.com Replica Local Trade copier by Chart Walker
Replica, a MetaTrader 5 (MT5) local trade copier, is a powerful tool designed to streamline and automate trading processes for users within the MT5 platform. This innovative software allows traders to replicate trades from one account (master) to another (slave) in real-time, enabling efficient and synchronized trading across multiple accounts. With its user-friendly int
FREE
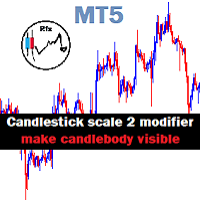
Chart Candlestick scale 2 zoom will visible instead of just a tiny unrecognized line make it look neat and tidy Instruction.
If you don't like the candles colors, you can do so by changing color. read below:
-Colors must be changed in the indicator setting.
-It won't change through the Chart properties to modify.
-After changing the color, save it as template so it wont change the colors to default value.
FREE

The indicator has only one parameter - the number of bars for analysis. The indicator calculates statistics for when the market was moving down, when it was moving up, and the number of bars for each movement. From this data, the average number of bars is calculated, which is displayed in the indicator window. If the indicator values sharply decrease, then the market is preparing for an upward movement. If the indicator values persist at high levels for an extended period, then the market is pre
FREE

Utility for order reversal. Closes orders on the chart on which it is launched and opens orders with the opposite direction instead of them. Has a simple and intuitive graphical interface. It is also possible to automatically reverse newly opened orders. MT4 version of the utility- https://www.mql5.com/en/market/product/74771 If you like this utility, take a look at my other products - https://www.mql5.com/en/users/nina_yermolenko/seller
FREE

Pairs Navigator is a simple and easy-to-use tool that allows you to view all of your charts in a single window. This eliminates the need to open multiple charts from the Market Watch window, saving you time and effort. Pairs Navigator is also very lightweight, so it will not put a strain on your RAM or cause your MT4/5 platform to hang. To use Pairs Navigator, simply drag and drop the currency pairs you want to view into the Pairs Navigator window. You can then easily switch between charts by
FREE

This is an original trend indicator. The indicator draws three lines in a separate window. Its values vary from -1 to +1. The closer the indicator is to +1, the stronger is the ascending trend. The closer it is to -1, the stronger is the descending trend. The indicator can be also used as an oscillator for determining the overbought/oversold state of the market. The indicator has one input parameter Period for specifying the number of bars to be used for calculations.
FREE

It is the very same classic Stochastic indicator, but with a little twist: NO NAME and data is shown in the sub window. It could be stupid, BUT, if you are running out of space in Micro windows like Mini Charts, where the indicator's name is totally useless, you came to the right place. And that's it! I know it seems stupid but I needed the classical version of Stochastic indicator without that annoying name on my Mini Chart, so I did it that way... The original formula is right from Metaquote's
FREE

Indicador Regressão Linear – Par de Ativos Indicador é um oscilador que faz o plot do Resíduo resultado da regressão linear entre os dois ativos inseridos como input do indicador, representado pela fórmula: Y = aX + b + R Onde Y é o valor do ativo dependente, X é o valor do ativo independente, a é a inclinação da reta entre os dois ativos, b é a intersecção da reta e R é o resíduo. O resíduo representa a quantidade da variabilidade que Y que o modelo ajustado não consegue explicar. E os resíduos
FREE

GeoInfo5 is one of the most informative indicators, it displays basic information about a trading instrument in a compact form. The version for the Meta Trader 4 terminal has gained wide popularity among traders. The indicator is free and will always be free. The launch version is now available for MetaTrader 5 as well.
displays information about the main parameters of the tool in a brief form in the line in the upper left corner of the chart: Spread, Swap for Buy order, Swap for Sell order,
FREE
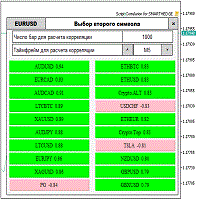
Script for quickly selecting a tool with high correlation. The script is placed on the tool to which you need to select the second correlating one. Then you can change the number of bars to calculate and the timeframe. The script iterates through all available symbols in the market overview and returns the 20 most correlated ones. You can use the selected pairs to trade with THE new SH expert Advisor
FREE

If you are looking for an easy-to-use Expert Advisor, then this is what you need. No settings. All that is required of you is to choose a currency pair, a timeframe and allow automatic trading for the EA. The strategy of the expert is based on the local support and resistance levels. When a candle closes beyond any level, an order is opened in the opposite direction, expecting a price rebound. The maximum number of orders opened at a time is limited to 3. This is a safety measure, which prevents
FREE

This utility opens orders when the candle touches the manually placed trend line, as if it were a more articulated pending order. It can be used on any asset, when it opens the order it eliminates the line it touched. In this case, it is used for price reversal operations, it opens a sell order when the bullish candle touches the bottom-up line and opens a buy order when the bearish candle touches the top-down line.
With the latest update, you can place multiple lines, to avoid bugs, displ
FREE
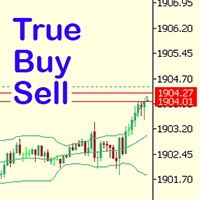
Have you ever noticed how on the forex symbols, the buy / sell button's price doesn't match the buy / sell lines on the chart? The spread always looks a lot tighter on the chart, you open a position and then realise the spread is huge. This is a very simple utility, it adds lines on the chart which match the buy / sell price on the buttons. Once installed I recommend right clicking the chart, go to Properties and uncheck "Show bid price line" and "Show ask price line", now click OK. Then righ
FREE

"Are you tired of losing money on unsuccessful trades? Look no further than EA Trailing Stop! Our program is designed to help you prevent losses and control your trades efficiently. With features such as adjustable stop loss and more, you can rest assured that your trades are in good hands. Don't wait any longer to start making successful trades. Try EA Trailing Stop today!"
You can use this as a starting point and tailor it to your audience and the platform you're using. This EA Trailing Stop
FREE

Revolutionize Your Trading Experience with Our Advanced Management Panel Maximize efficiency and control with our cutting-edge Management Trades Panel, exclusively designed for discerning traders. Our innovative panel is a game-changer in the realm of financial trading, offering unparalleled functionality and user-friendly features. Key Features: Automated Daily Profit/Loss Closure : Set your desired profit or loss thresholds, and let our panel automatically close all current trades when these
FREE
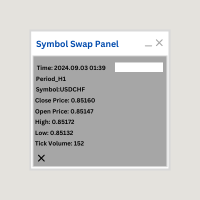
Symbol Swap Panel: Effortlessly switch the active symbol on your chart while simultaneously adding the new symbol to Market Watch. This tool ensures seamless integration and access to real-time market data, optimizing your trading workflow.
Description:
The "Symbol Swap Panel" is a versatile utility designed for traders seeking to manage their chart symbols and Market Watch more efficiently. This tool allows you to easily swap the current symbol on your chart while automatically adding the
FREE

The indicator ColorCandlesDaily draw candles with different colors depending on the day of the week.
FREE
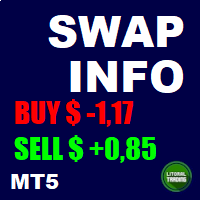
This is a script based tool that informs the swap from all the currency pairs (gold and silver too). It is possible to highlight pairs with a specific currency and whether the swap is positive or negative. In addition it is possible to complement the name of the symbols depending on the broker. The informations are showed in the Experts tab of the Toolbox (Ctrl+T). If you have any doubt or suggestion, please, contact us. Enjoy!
FREE

Online monitoring of forex accounts fxmon.io The application helps track real-time accounts from your forex terminals Metatrader 4/5 around the clock. List of main features: The state of your accounts in the moment Profitability on each account and on all together Metrics for currency pairs Screenshots of pairs from the terminal Fine-tuning of notifications for any indicators Access to statistics via Telegram, Android app, iOS app
If you use Expert Advisors and robots, this app is for you Moni
FREE

================ // Average period ma_Sma, // Simple moving average ma_Ema, // Exponential moving average ma_Smma, // Smoothed MA ma_Lwma // Linear weighted MA =============== // Average method // Turn alerts on? // Alert on current bar? // Display messageas on alerts? // Play sound on alerts?
FREE

Idea I programmed this tool out of the necessity to be constantly informed about what is going on. Before I sometimes forgot to set a stopp loss, this is impossible with this tool. Further this tool allows you to make distributed entries, eg. with a first feeler with 0.1 contracts and when the direction is the right one you just put more contacts into the game. Money- and risk management is built in. If you use more then the predetermined number of contracts there is a warning. You are constantl
FREE

This reliable, professional trade copier system is without a doubt one of the best on the market, it is able to copy trades at very fast speeds from one master account (sender) to one or multiple slave accounts (receivers). The system works very fast and mimics the master account a full 100%. So changing stop losses, take profits, pending orders on the master account is executed on the slave accounts too, like each other action. It is a 100% full copy (unlike many other copiers who only copy ma
FREE

Простой индикатор, показывающий цены Bid и Ask. Есть настройки отображения информации и возможность перетаскивать панель. Индикатор используется для наглядного отображения цен покупки и продажи актива.
Входные параметры : Support - Ссылка, на помощь проекту heigth - Высота формы width - Ширина формы size - Размер текста bidcol - Цвет текста bid askcol - Цвет текста
FREE

The indicator calculates the inclination angle between the Highs, Lows and Closes of adjacent bars. The angle can be measured in degrees or radians. A linear graph or a histogram is drawn in a subwindow. You can set the scale for the calculation — floating or fixed. For use in Expert Advisors or indicators, you need to specify a fixed scale.
Parameters Angular measure — degrees or radians. Scale mode for calculation — scaling mode. Free scale — free transformation, the indicator will calculate
FREE

最後に、インターフェイスが便利になっています。 今、あなたはマウスでインジケータ期間を制御することができます。 ただ、ボタンをクリックして、CCI期間を増減するには、マウスホイールをスクロールします。 ボタンは、任意の便利な場所に配置し、固定し、ワンクリックで使用することができます。 複数の指標を1つのチャートに設定し、個別に、または一度にすべて管理できます。 チャートに簡単にインストールすると、各インジケータのパラメータの名前変更や変更を心配する必要はなく、自動アルゴリズム自体が必要なオブジェク インターフェイスは可能な限り便利で、実際には手動の介入を必要としません。 このコンポーネントは、多くの場合、彼らの取引戦略でCCI指標を使用する人のための理想的です。 チャート上で常に動作することができます!テスターでは動作しません。 この無料の製品にあなたのフィードバックを残すための巨大な要求。 インストール:
-チャートに"Button_Cci"を設定します。 インジケータとCCIインジケータ自体を制御するためのボタンが表示されます。 あなたは一つのウィンドウにいくつかの指標を設定
FREE

What is this indicator?
このインジケーターはMT5のFX検証ソフト「 Knots Compositor 」の 全てのチャートモードに対応したエンベロープ です。 どのチャートモードでも、 チャートに表示されているローソク足で計算して表示します 。
Types of the moving average - Simple (SMA ) - Exponential (EMA) - Smoothed (SMMA ) - Linear weighted (LWMA)
Types of the applied price - Close - Open - High - Low - Median Price (HL/2) - Typical Price (HLC/3) - Weighted Price (HLCC/4)
KC-Indicators - KC-MA (移動平均線) - KC-ENV (エンベロープ) - KC-BB (ボリンジャーバンド) - KC-ADX (Average Directional Mov
FREE

The indicator highlights in color the places on the chart where the price moves in one direction continuously from the selected number of candles.
You can specify the number of points from the beginning of the movement to select only movements from this amount.
It can be useful for looking for reversals or sharp impulses.
I also recommend purchasing this utility to determine local weekly / monthly trends and support and resistance lines. https://www.mql5.com/en/market/product/61401
FREE

Este indicador apresenta 7 médias configuráveis, que podem facilmente ser utilizadas em robôs ou em operações manuais.
Facilita a identificação de tendências e reversões. Seus buffers estão ordenados e são facilmente identificáveis para utilizar em robôs. Liberado para uso em operações manuais ou automatizadas.
Em breve vamos postar um robô que utiliza estas médias como parâmetro de negociação.
FREE
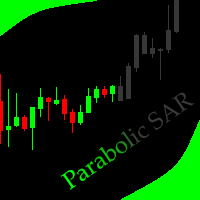
This indicator allows to hide Parabolic SAR (on all MT5 timeframes) from a date define by the user, with a vertical line (Alone) or a panel (with "Hidden Candles"). Indicator Inputs: Step Maximum Color Width Information on "Parabolic SAR" indicator is available here: https://www.metatrader4.com/en/trading-platform/help/analytics/tech_indicators/parabolic ************************************************************* Hey traders!! Give me your feeds! We are a community here and we have the sa
FREE

Analyze potential Covered Call structures in the Brazilian market. Define where you want the break-even of your structure and see what structure to use.
It works for any asset that has authorized series of options on B3 (Brazilian Stock Exchange). Associate the indicator to the asset you want to set up the Covered Call. *** ATENTION *** For the robot to work, the service that consults the authorized series of B3 options must be running on your terminal. Download the utility for free from
FREE
製品概要 本製品はMT5のユーティリティツールであり、裁量取引に役立ついくつかの情報をチャートに表示します。 MT5により標準搭載されているインジケータを使ったり、手動計算によって得られる情報の一部を、最初からチャート上に表示します。
This Is Something Useful MT5の利点 裁量取引で確認が必要な必要最低限の情報をいつでもチャートに表示 本ツールを用いることで、必要な情報にいつでも素早くアクセスすることができ、トレードに集中することができます。
設定項目 ・Time Information 自身が設定したMT5サーバとローカルPCの時差から、ローカル時間を表示 夏時間・冬時間の考慮の有無 (ニューヨークサマータイムルールを採用) 各時間にグリッド線を表示 テキストおよびグリッドの色設定
・Count Down Timer 表示中の時間足チャートのロウソク足の確定までの時間を表示 カウントダウンタイマーの表示位置 カウントダウンタイマーの文字色
・ATR 表示中の時間足チャートのATRの表示 ATRの計算期間 ATRの表示位置 ATRの文字色
FREE

Only Exponential Moving Average at Close Price is used in standard Bears Power limiting the possibilities of that indicator to some extent. Bears Power Mod enables you to select from four Moving Averages and seven applied prices, thus greatly expanding the indicator's functionality.
FREE

This is a multi frame stochastic indicator, you can attach any time frame of stoch indicator on one chart. It is very useful if you like to check multi time frame stoch data. If you are interested in EA,click below links to take a look: https://www.mql5.com/en/market/product/80170 https://www.mql5.com/en/market/product/81136
How to use: > Atach the first time frame you want on to the currency pair's chart > Atach the second time frame you want on to the currency pair's chart > Atach the thir
FREE

Dynamic Theoretical Stop
Histogram indicator that dynamically analyzes the theoretical Stop levels in real time.
Operation :
The DTS - Dynamic Theoretical Stop does a mapping of fractals in previous candles and suggests two levels of Stop: For purchase and for sale.
Suggested reading :
It is necessary to make the definition of Maximum Stop in points in the Trading Plan. In this way, the trader can decide the best entry point by analyzing the theoretical stop levels:
Stop for sales: S
FREE

The Buffer Reader will help you to check and export the custom indicators buffers data for your current chart and timeframe. You can select the number of buffer and historical bars to read/export. The data can be exported in a CSV format and the files will be stored in the folder: \MQL5\Files .
How it works Put the number of buffers to read in the Buffers_Total input parameter. Put the number of rows to display in the Rows_Total. Choose the CSV separator in the parameter. Copy the correct na
FREE

Индикатор, показывающий моменты пересечения важных уровней индикатора RSI. Может быть использован для поиска моментов пересечения уровней для успешной торговли на отскок или по тренду.
Входные параметры Inform about finding the signal - параметр, отвечающий за получение уведомлений (Alert) о найденном сигнале. По умолчанию - нет RSI period - Период RSI для работы RSI Max - Значение максимальной границы RSI RSI Min - Значение минимальной границы RSI
FREE

Please, if you like this AE, I would appreciate it if you could rate it with 5 stars ️ ️ ️ ️ ️ THANK YOU!!
The expert advisor includes the following parameters: Magic number: Maximum slippage: Stop loss (pips): Take profit (pips): Trailing stop (pips): Trailing step (pips): Fixed lot or Risk: Info panel: This expert advisor does not use any dangerous strategy, such as martingale or grid, which can generate a total loss of the account. The Expert Advisor incorporates an inf
FREE

This is a demo version of the Candle Absorption Full indicator. It has limitations on operation. This indicator detects the Engulfing candlestick pattern and draws the corresponding market entry signal.
Features It works only with EURUSD on timeframes M1 and M5. The indicator analyzes a combination of 2 or 3 candlesticks depending on settings. The number of pre-calculated bars (signals) is configurable. The indicator can send an alert to notify of a found signal. Signal can be filtered by sett
FREE

The RFOC Mini Chart was created to project a macro view of the market, which the option to select the timeframe of interest other than the main chart, it is possible to include 2 indicators:
In the full version it is possible to include 2 indicators: 1 - Moving average channel On the mini chart, the moving average will be created based on the prices of the selected time frame for the RFOC Mini Chart. The moving average period must be selected in the indicator settings pannel. 2 - Boillinger Ba
FREE
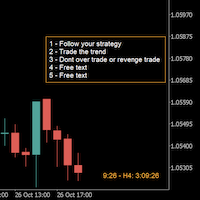
A good trader is a trader that respect his plan and keep the head cool. This indicator allow to display up to 5 lines of text for the things you always to see.
Congifuration 5 lines of text Text font, color, size Frame on/off, color, style, size Position of the text anchored Corners or anywhere on the screen Any questions or comments, send me a direct message here https://www.mql5.com/en/users/mvonline
FREE

The Oscar, one of my favorite indicators. This is my enhanced Version of it with more options and better visuals. Many different averaging methods Oscar changes color on signal cross, but not too volatile (3% extra threshold) Adaptable Divisor, higher numbers lead to more signals, due to higher fluctuations. Its a fast but quite accurate trend direction indicator. Play around with the settings and make it match to your setup. GL trading Please follow me on Twitter https://twitter.com/semager and
FREE

xCalper Economic Calendar brings economic calendar information to your Terminal chart and Experts from online sources. Just add it to your chart to see detailed news without losing attention or automate reading of calendar information to improve trading decisions.
Main Features Support data sources: Forex Factory. Filtering by day, impact or currency of news. Visual alert of upcoming news. Platform notification of upcoming news.
Parameters Filters Impact expected - Show/Hide by impact: Low,
FREE

This EA created for GBPUSD on H1. The strategy is a martingale. It has been back tested since 2015-01-01 till now on ICMarkets raw account. The minimum deposit is $1,000 and maximum should not be over $10,000 because its a Martingale. Recommended account is ECN or Raw. its a scalp EA so for sure the spread would be matter. Lot Size built up with percentage (%) that means it calculated according Stop Los and percent of deposit.
FREE

OneClickClose-Pro EA allow users to easily close all positions at once with multiple options with simple UI.
Options Includes::
1. Close All Positions
2. Close All Buy Positions
3. Close All Sell Positions
4. Close All Position GreaterThan or Equal to Profit
5. Close All Position LessThan or Equal to Profit
6. Close All Position By Symbol
7. Option to Set Deviation
8. Option to Set Maximum Retry (If position close fails)
FREE

This indicator changes the standard MetaTrader 5 candles to candles at the selected BID, ASK or Average price (BID+ASK)/2. Simply attach the indicator to the chart and select the prices to plot the candles or bars. Indicator Parameters ENUM_DRAW_TYPE - plot candles or bars on the chart For the price - the price for plotting the candles or bars The chart returns to its normal visualization mode after removing the indicator.
FREE

Sometimes swaps are hidden for certain financial instruments , hence incurring unprecedented costs over night. The need to uncover hidden swap costs is vital for profitable trading. With that being said, this expert indicator helps the trader to uncover the hidden swap costs.
Features chart objects with text short and long trade swap plug and play
Advantages uncover hidden swaps plug and play, no other configurations are needed to use it. usable on all charts and symbols swaps can be easily
FREE

This indicator shows the value of returns in the selected time frame
They are calculated as logarithm of returns , rather than price or raw returns. For small returns, arithmetic and logarithmic returns will be similar. The benefit of using returns, versus prices, is normalization. It is possible measures all variables in a comparable metric despite originating from price series of unequal values
Inputs You can display data both as a Histogram or a Line It's also possible to display the
FREE

An Adaptive Moving Average (AMA) is one more moving average overlay, just like EMA. It changes its sensitivity to price fluctuations . The Adaptive Moving Average becomes more sensitive during periods when price is moving in a certain direction and becomes less sensitive to price movement when price is volatile. For more information, welcome to our Telegram Group. https://t.me/InfinXx
FREE

"Moving Ratio Candle" is used to check the distance of a candle to a theoretical pressure point. Furthermore, we have two points of interest, the first for the mean and the second for the median. This indicator uses the shape of bars and the line that crosses the bar from left to right is based on the calculation of the closing price for both sides. The rest follows a more standard calculation. The same could be done as a line, but I want to know the behavior of this indicator in relation to the
FREE

Having more expert advisors running on the same account , eventually leads us to the question , which one of them are winners , or which are dragging down the account ? With this in mind I created this simple utility for displaying profits or losses taken by each expert advisor over time . This utility can be run as an expert advisor and can display up to 9 magic number results . If the inputs are left to zero , the results displayed are from the manually placed orders . It also displays deposi
FREE

(Google 翻訳) この指標は、 John Welles Wilder Jr. によって開発されたオリジナルの「 Average True Range (ATR) 」を実装しています。 テクニカル トレーディング システムにおける新しい コンセプト[1978] . 単純移動平均 (SMA) の代わりに、 平滑移動平均 (SMMA) とも呼ばれる ワイルダーの移動平均 を使用します。 MetaTrader の組み込み ATR インジケーターで使用されます。 彼の本の説明によると、適用されるデフォルトの期間は 14 ではなく 7 です。 (Original text) This indicator implements the original “ Average True Range (ATR) ” developed by John Welles Wilder Jr. , as described in his book— New Concepts in Technical Trading Systems [1978] . It uses Wilder’s moving avera
FREE
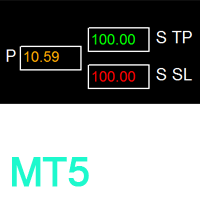
如果产品有任何问题或者您需要在此产品上添加功能,请联系我 Contact/message me if you encounter any issue using the product or need extra feature to add on the base version.
Session TakeProfit StopLoss is basically helping to set the take profit and stop loss in dollar for the total open orders (session). Once the total profit is greater than session_tp or less than session_sl, the EA will help to close all open orders acting similarly to a take profit/stop loss for a single order.
Inputs session_tp: session take profit s
FREE

Less is more. Find the strongest trends! This expert scans ALL currency pairs for a strong trend combined with a breakout.
Requirements for a trend report: 1. Up-trend or down-trend must be found in all of the following timeframes (D, H4, H1, M30) 2. Breakout in the daily timeframe (the upper or lower band of the Bollinger band must be broken)
The correctness of the trend is confirmed to 90%
FREE

主要城市的时间。北京时间、东京时间、悉尼时间、惠灵顿时间、纽约时间、法兰克福时间、伦敦时间、迪拜时间。 城市时间可选择开启或者关闭。 点差变色提醒。设置点差提醒点数,例如,设置100点,点差大于100点,文字会变红色。 Time in major cities. Beijing time, Tokyo time, Sydney time, Wellington time, New York time, Frankfurt time, London time, Dubai time. City time can be turned on or off. Dot difference color change reminder. Set the point difference reminder points. For example, set 100 points. If the point difference is greater than 100 points, the text will turn red.
FREE
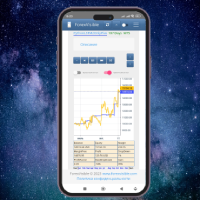
This client utility is intended for sharing and copying signals, as well as for monitoring your Expert Advisor on the site https://forexvisible.com . The Android version of the site can be downloaded here The version for the MT4 terminal can be downloaded here https://www.mql5.com/en/market/product/106509 There are many reasons to use this application in your trading, and these are: 1. If you have many trading advisors and many accounts, it is very difficult to track them and monitor everythin
FREE

"Elder Ray" or "Ray" indicator is based on the Dr. Alexander Elder's oscillators: Bulls & Bears Power. Both of them works with an EMA. This indicator is used by traders to identify divergence, market directions and more... Dr. Elder's method generally uses a 13-day EMA Period but this can be modified based on your personal demand. The calculations are: Bulls Power= high candle - EMA close Bears Poder= low candle - EMA close Lime line represents Bulls Power and OrangeRed line, shows Bears Power
FREE

The Retracement indicator shows the current and historical high, low and mid values. Optionally, it can also display major retracement levels. All these levels together form the significant levels of support and resistance. Therefore, it is essential to know them for every kind of trader.
Levels High Low Midpoint 76,4 % 61,8 % 38,2 % 23,6 %
Main features The indicator shows the actual levels of High, Low, Mid and selected retracements. Four optional retracement levels. Alert notificatio
FREE

Thank you for your interest in The Tail.
I have been trading since 2018. Or rather, it’s not me who trades, but the army of my robots, which I constantly develop. Tail is one such candidate.
This robot works on moving averages, filters trades by RSI.
The robot provides the functionality of volume and position control.
Combine different approaches. I recommend using it in a group of 3-5 of the same robots on different instruments for the best result.
I recommend keeping a high value of
FREE

Only Exponential Moving Average at Close Price is used in standard Bulls Power limiting the possibilities of that indicator to some extent. Bulls Power Mod enables you to select from four Moving Averages and seven applied prices, thus greatly expanding the indicator's functionality.
FREE
Traders Club Clock for MT5 Readme
ローソク足のすぐ横にその時間足での 残り時間とスプレッドを表示します。 ※残り時間はサーバ時間から計算しています。 月足、週足、日足、4時間足、1時間足、30分足、15分足、5分足、1分足
で表示可能となっております。
※スプレッド値ポイント単位での表示になります。
※時間の更新はティック毎ではなく1秒 毎 に更新するようにしています。
一目で残り時間とスプレッドを確認できます。 機能: 使用しているフォント種類を変更できます。 使用しているフォントサイズを変更できます。 表示しているテキストの色を変更できます。 スプレッド表示を非表示にすることができます。 表示する位置を変更することが出来ます。
FREE

EA to help traders stay within tight risk management.
Asks only for account's initial balance and Stop Out DD. This is meant for prop firm traders, but will help any trader who is looking for a simple risk manager.
Trasks and reports daily PnL and will advise you to stop at 1% daily loss. Will advise you to wait if you have too many open trades.
Based on the open chart (symbol and timeframe) will recommend size and SL distance in order to risk the desired cash risk. See screenshot for exam
FREE

Overview The script displays information about the trade account: Information about the trade account: Account - account number and type (Real, Contest or Demo); Name - name of the account owner; Company - name of a company that provide the access to trading; Server - trade server name; Connection State - connection state; Trade Allowed - shows whether trading is allowed on the account at the moment; Experts Allowed - shows whether it is allowed to trade using Expert Advisors; Balance - account
FREE

I always wondered if I can have multiple time frame Moving average on same chart , it is not possible , now with my Indicator is possible , As you know Moving average is lagging not leading indicator , but how can I predict future levels of it ?
I came with this idea , I hope you will like it , I made a Mirror of Moving average , the other side of specific time will be shown in the other side of the chart where the price didnt reach yet , that will help you to know the levels you can start sel
FREE

The Commodity Channel Index computes the deviation of the typical price of each bar from the average price over a particular time period. Multiplying the median deviation by 0.015 facilitates normalization, which makes all deviations below the first standard deviation less than -100, and all deviations above the first standard deviation more than 100. This adaptive version is based on the indicator described by John Ehlers, in the book Rocket Science for traders. The indicator uses the homodyne
FREE

RSI Scanner, Multiple Symbols and Timeframes, Graphical User Interface An indicator that scans multiple symbols added from the market watch and timeframes and displays result in a graphical panel. Features: Multi symbol Multi timeframe Alerts and Notifications Live Monitoring Sorting modes One click to change symbol and timeframe Inputs for RSI and scanner settings
FREE

White label available. contact us for more info. dushshantharajkumar@gmail.com
Slides by Chart Walker "Slides" is a MetaTrader 5 (MT5) utility designed to streamline chart navigation by facilitating automatic chart switching. With "Slides," users can preset specific time intervals for chart rotation, enabling automatic transitions between different financial instruments or timeframes. This utility proves invaluable for traders who monitor multiple charts simultaneously, as it optimizes wo
FREE

This is an alert based on a moving average convergence / divergence (MACD) and additional moving average indicator (for trend confirmation) similar to my other product where you find detailed description of how it works. You get a colored table where colors are related to trading conditions (see below) with possibility to customize all indicator parameters, including Heikin Ashi calculations. Meaning of cell COLORS (can be redefined by user): GREEN - buy signal, PINK - sell signal, YELLOW - pay
FREE

Hello,
This is an easy symbol change panel.
The free version only can change major pairs which are "AUDUSD, EURUSD, GBPUSD, USDCHF, USDCAD, USDJPY, NZDUSD"
The full version can add your symbols.
FULL version here:
https://www.mql5.com/en/market/product/71173?source=Site+Market+MT5+Indicator+New+Rating005#description
Also, can change the TimeFrame as well.
Symbols must be active on your Market Watch list.
Parameters:
ratio - change the size LineNumber - you can set that how
FREE

This is a simple indicator type thing to track potential total risk if all the stop losses to be hit. It gives the some of the total stop losses for a certain currency in positions and orders. These are the functions. (I will add more functions later, eg - total profits per symbol etc.) ( Add a comment if you need any feature. I will add it ) Total risk exposure - This is the total risk that can happen if all the stop losses in positions and open orders were to hit. Total positions risk - This i
FREE

Simple script for Buy by Market Execution on all financial instruments.
Inputs Volume - default: 0.10 Deviation - default: 10 points Stoploss - default: 50 points Takeprofit - default: 50 points Comment - default: Order by Market Confirm - default: false
Inputs Details Type Order Buy Order is preset. Deviation Maximum deviation from quoted price in points. Stoploss & Takeprofit In points value, be careful that this value will be added to minimum stop allowed by the broker. For example if you
FREE
MetaTraderプラットフォームのためのアプリのストアであるMetaTraderアプリストアで自動売買ロボットを購入する方法をご覧ください。
MQL5.community支払いシステムでは、PayPalや銀行カードおよび人気の支払いシステムを通してトランザクションをすることができます。ご満足いただけるように購入前に自動売買ロボットをテストすることを強くお勧めします。
取引の機会を逃しています。
- 無料取引アプリ
- 8千を超えるシグナルをコピー
- 金融ニュースで金融マーケットを探索
新規登録
ログイン